| Param | Original file | Final file |
|---|---|---|
| Filename | modeM0/AS1A13_026T01_9000005904_43766cztM0_level2.fits | modeM0/AS1A13_026T01_9000005904_43766cztM0_level2_quad_clean.evt |
| Size (bytes) | 633,669,120 | 100,918,080 |
| Size | 604.3 MB | 96.2 MB |
| Events in quadrant A | 5,542,362 | 700,637 |
| Events in quadrant B | 6,476,287 | 638,246 |
| Events in quadrant C | 4,266,589 | 712,525 |
| Events in quadrant D | 6,667,778 | 550,910 |
| Mode M0 | |||
|---|---|---|---|
| Quadrant | BADHDUFLAG | Total packets | Discarded packets |
| A | 0 | 21431 | 1 |
| B | 0 | 23675 | 4 |
| C | 0 | 17055 | 1 |
| D | 0 | 24291 | 1 |
| Mode SS | |||
|---|---|---|---|
| Quadrant | BADHDUFLAG | Total packets | Discarded packets |
| A | 0 | 134 | 0 |
| B | 0 | 134 | 0 |
| C | 0 | 134 | 0 |
| D | 0 | 134 | 0 |
| Mode M9 | |||
|---|---|---|---|
| Quadrant | BADHDUFLAG | Total packets | Discarded packets |
| A | 0 | 8 | 0 |
| B | 0 | 8 | 0 |
| C | 0 | 8 | 0 |
| D | 0 | 8 | 0 |
| Quadrant | Total seconds | Saturated seconds | Saturation percentage |
|---|---|---|---|
| A | 6490 | 497 | 7.657935% |
| B | 6490 | 1184 | 18.243451% |
| C | 6490 | 309 | 4.761171% |
| D | 6490 | 1265 | 19.491525% |
Noise dominated data is calculated using 1-second bins in cleaned event files. If a bin has >2000 counts, and if more than 50% of those come from <1% of pixels, then it is considered to be noise-dominated and hence unusable.
| Quadrant | # 1 sec bins | Bins with >0 counts | Bins with >2000 counts | High rate bins dominated by noise | Noise dominated (total time) | Noise dominated (detector-on time) | Marked lightcurve |
|---|---|---|---|---|---|---|---|
| A | 7335 | 6492 | 212 | 212 | 2.89% | 3.27% | 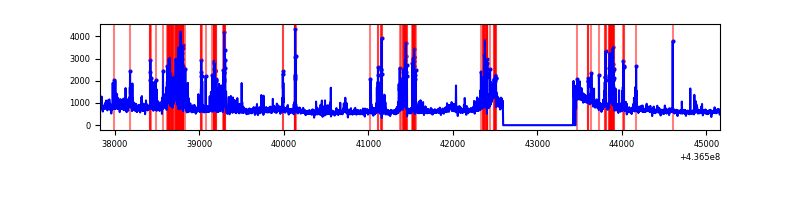 |
| B | 7335 | 6492 | 864 | 864 | 11.78% | 13.31% | 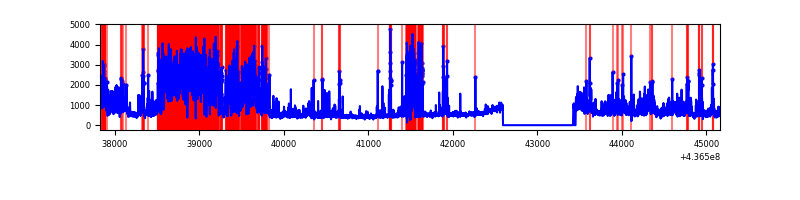 |
| C | 7335 | 6492 | 199 | 199 | 2.71% | 3.07% | 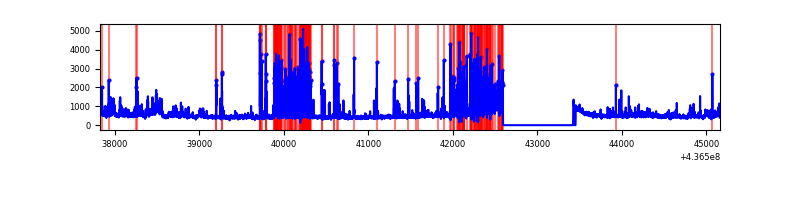 |
| D | 7335 | 6492 | 991 | 991 | 13.51% | 15.26% | 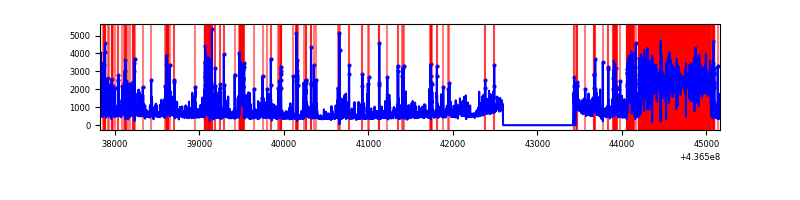 |
Top three noisy pixels from each quadrant. If the there are fewer than three noisy pixels in the level2.evt file, extra rows are filled as -1
| Pixel properties | Quadrant properties | ||||||
|---|---|---|---|---|---|---|---|
| Quadrant | DetID | PixID | Counts | Sigma | Mean | Median | Sigma |
| A | 10 | 83 | 964240 | 6168.65 | 746 | 731 | 156.2 |
| A | 13 | 248 | 583998 | 3734.23 | 746 | 731 | 156.2 |
| A | 14 | 63 | 469193 | 2999.22 | 746 | 731 | 156.2 |
| B | 0 | 200 | 2608234 | 18493.25 | 706 | 685 | 141.0 |
| B | 5 | 235 | 508884 | 3604.25 | 706 | 685 | 141.0 |
| B | 5 | 255 | 116001 | 817.84 | 706 | 685 | 141.0 |
| C | 15 | 158 | 805093 | 4706.28 | 729 | 735 | 170.9 |
| C | 3 | 233 | 418520 | 2444.45 | 729 | 735 | 170.9 |
| C | 15 | 157 | 113994 | 662.68 | 729 | 735 | 170.9 |
| D | 5 | 235 | 2410739 | 13889.69 | 672 | 652 | 173.5 |
| D | 1 | 52 | 506183 | 2913.45 | 672 | 652 | 173.5 |
| D | 12 | 233 | 264936 | 1523.11 | 672 | 652 | 173.5 |
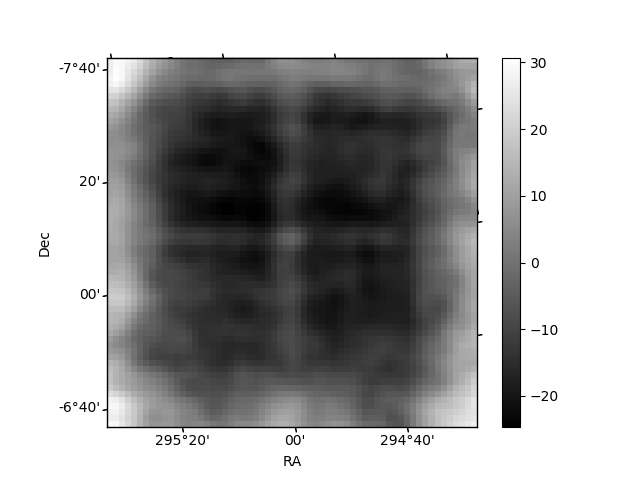
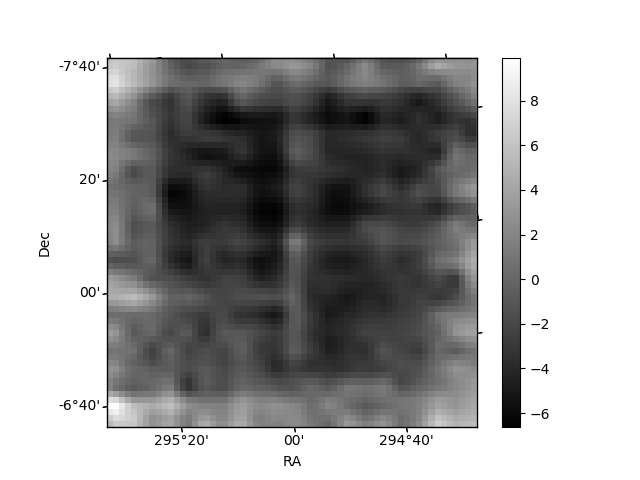
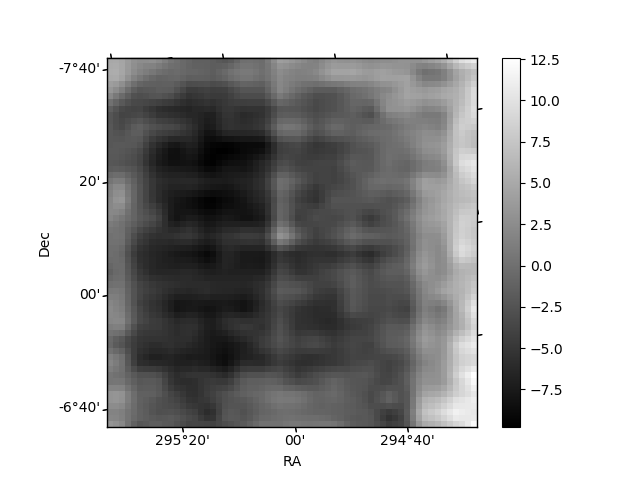
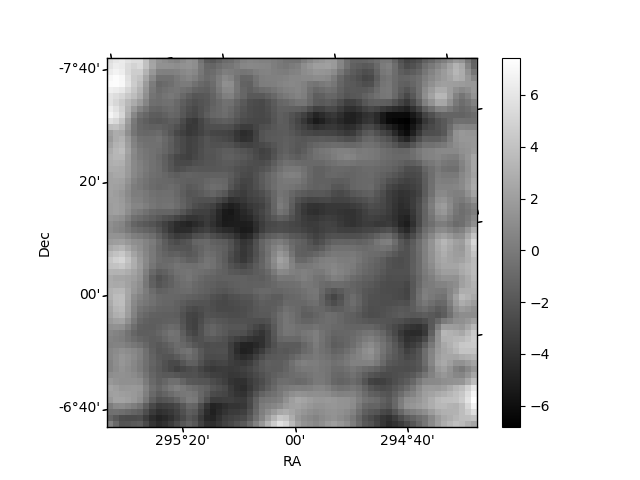
Histogram calculated using DETX and DETY for each event in the final _common_clean file
| Quadrant A | 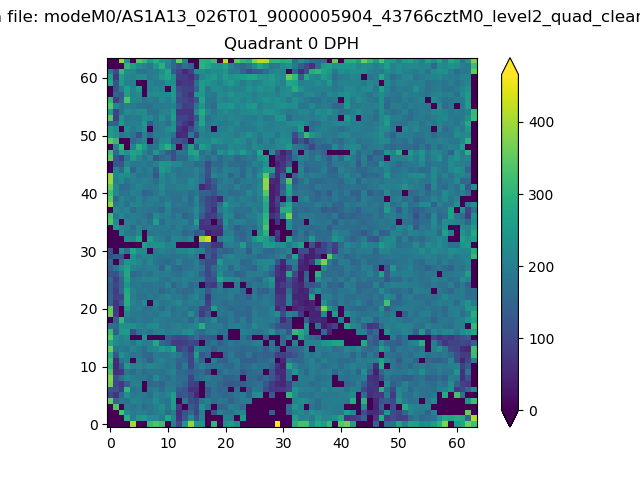 |
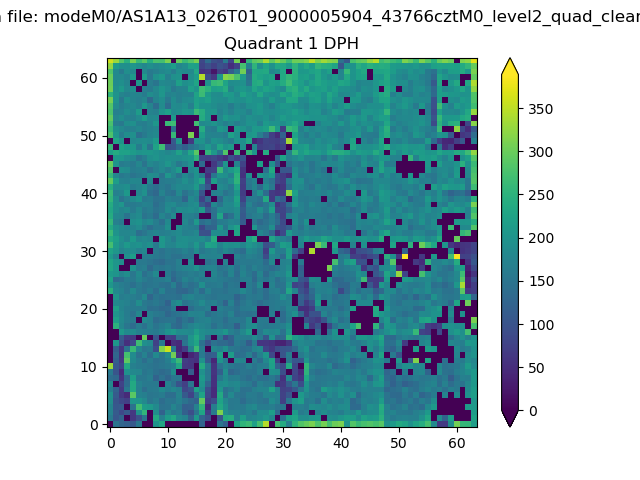 |
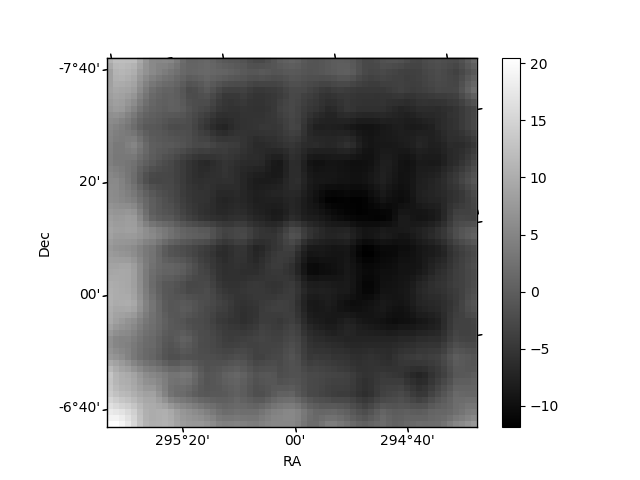
Quadrant B |
|---|---|---|---|
| Quadrant D | 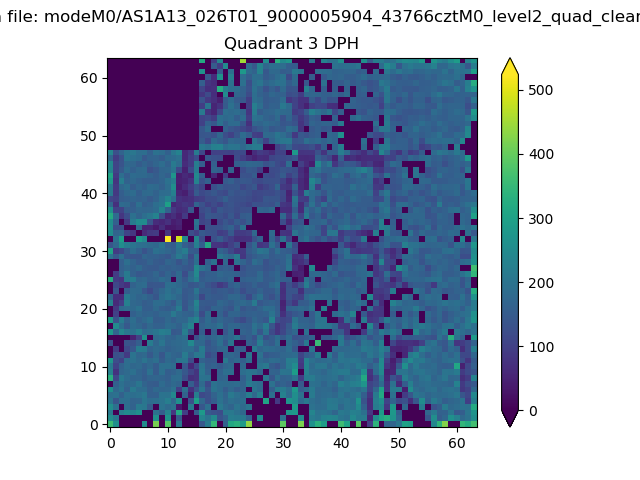 |
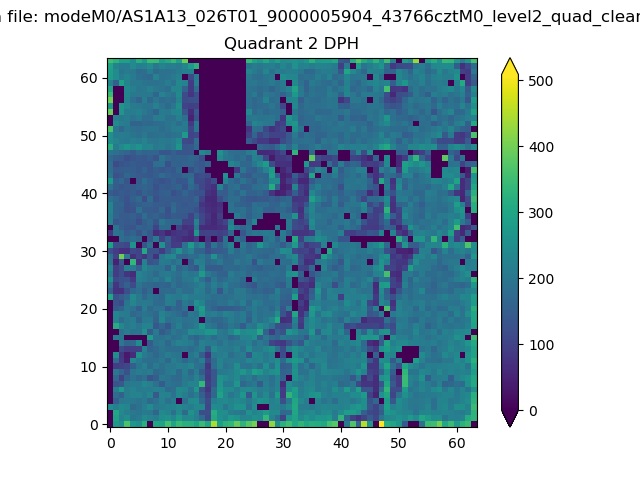 |
Quadrant C |
| Plot type | Count rate plots | Images |
|---|---|---|
| Comparison with Poisson distribution Blue bars denote a histogram of data divided into 1 sec bins. Red curve is a Poisson curve with rate = median count rate of data. |
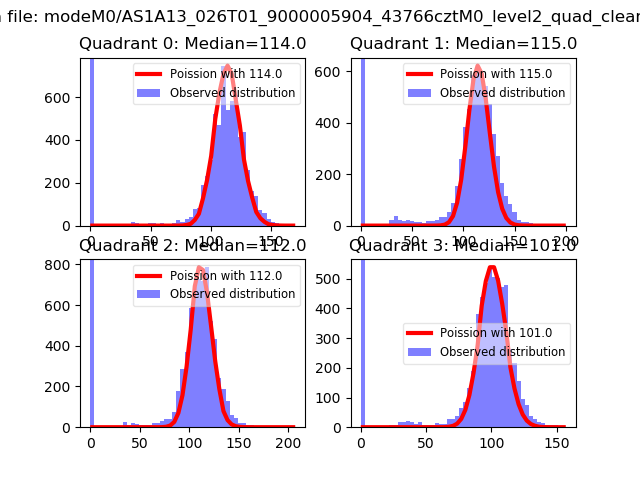 |
 |
| Quadrant-wise count rates Data is divided into 100 sec bins |
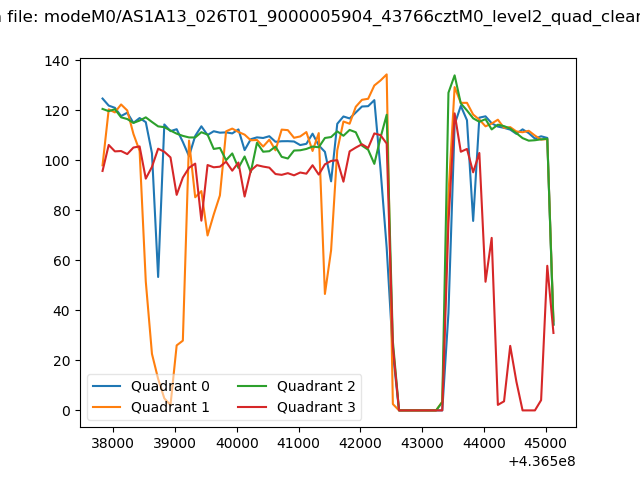 |
|
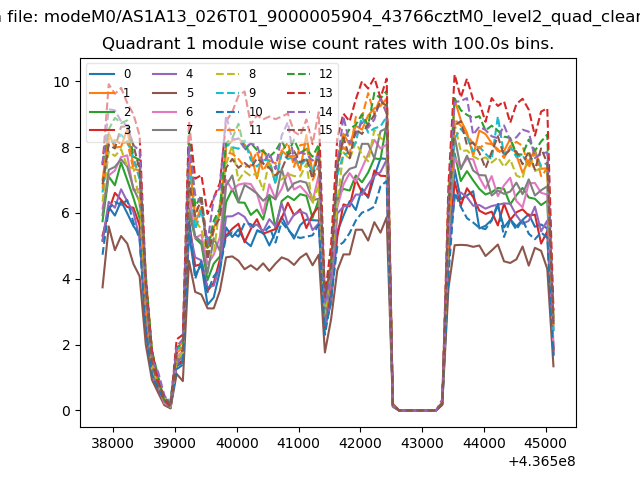
| Module-wise count rates for Quadrant A Data is divided into 100 sec bins |
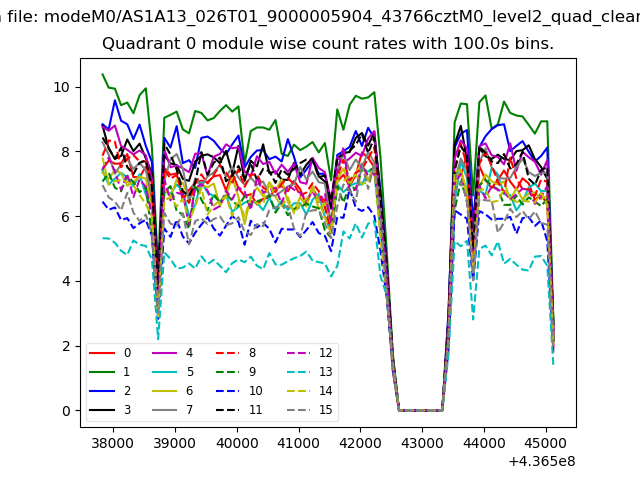 |
 |
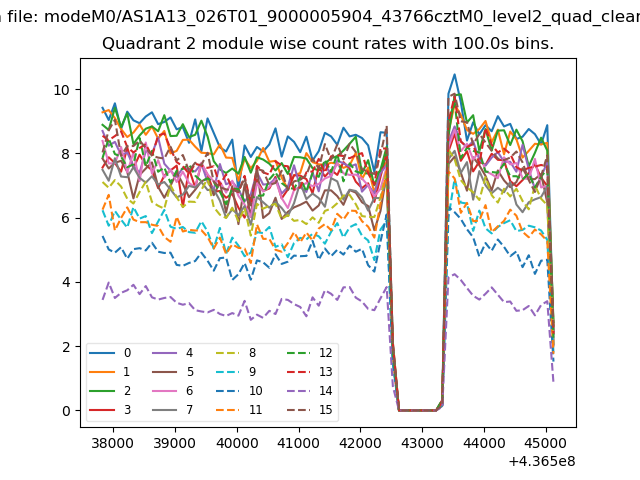
| Module-wise count rates for Quadrant B Data is divided into 100 sec bins |
 |
 |
| Module-wise count rates for Quadrant C Data is divided into 100 sec bins |
 |
 |
| Module-wise count rates for Quadrant D Data is divided into 100 sec bins |
 |
 |
| Parameter | Plot |
|---|---|
| CZT HV Monitor | 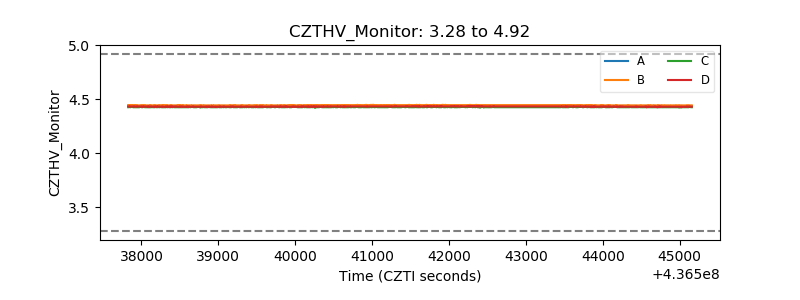 |
| D_VDD | 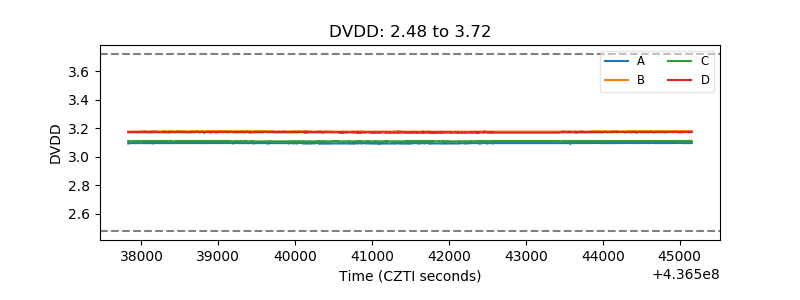 |
| Temperature 1 | 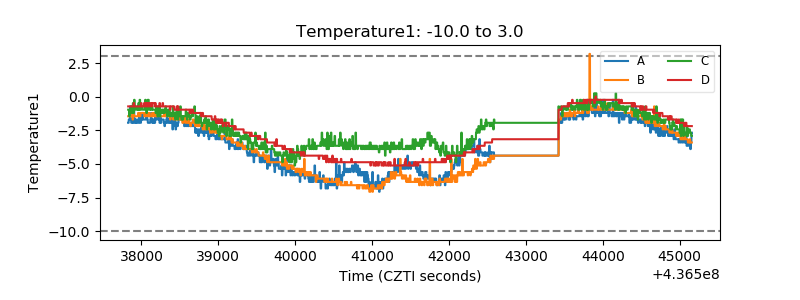 |
| Veto HV Monitor | 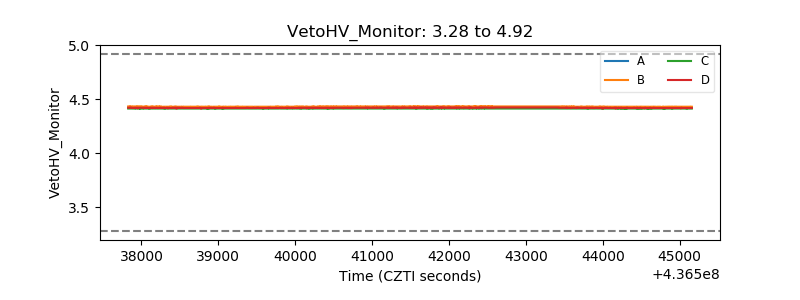 |
| Veto LLD | 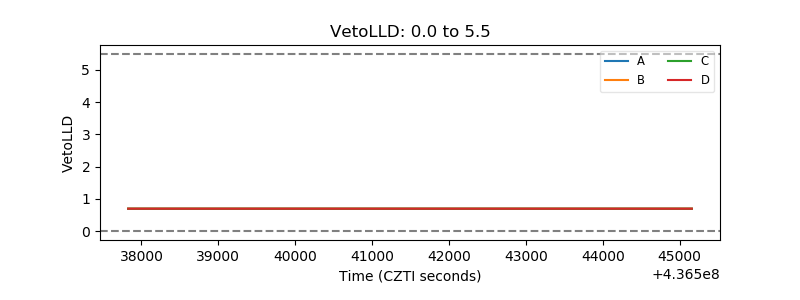 |
| Alpha Counter | 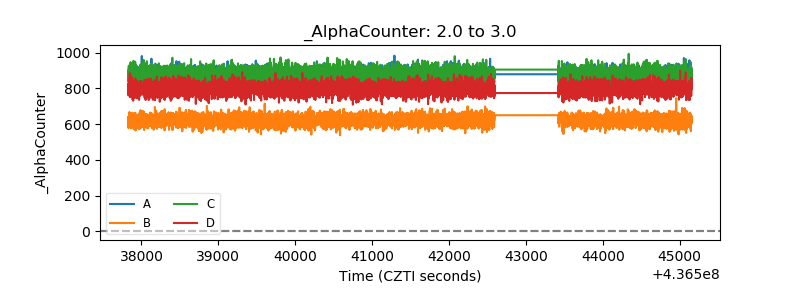 |
| _CPM_Rate | 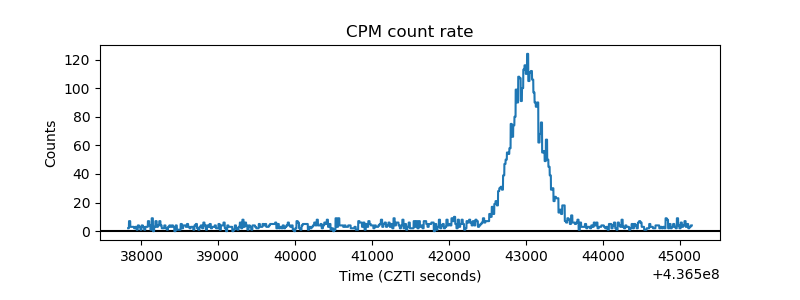 |
| CZT Counter | 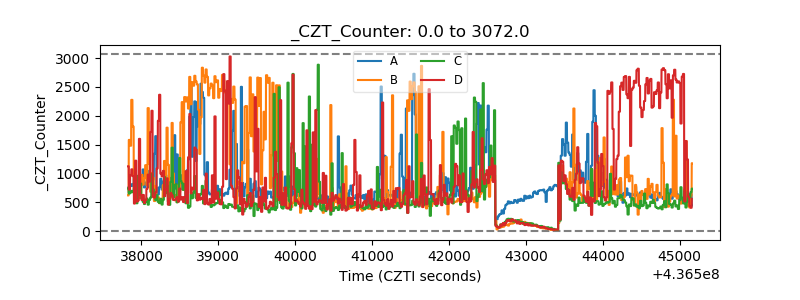 |
| +2.5 Volts monitor | 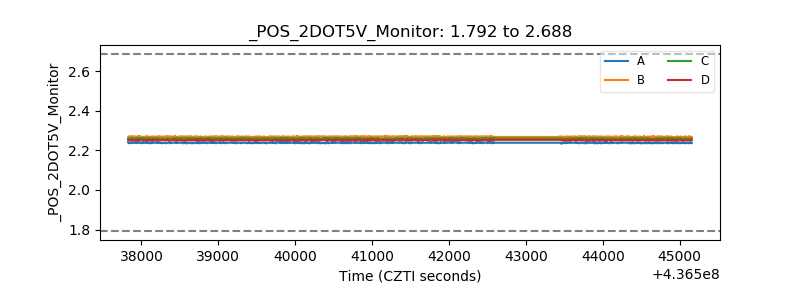 |
| +5 Volts monitor | 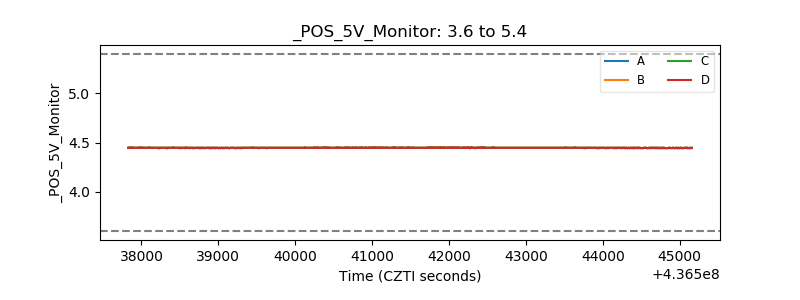 |
| _ROLL_ROT |  |
| _Roll_DEC | 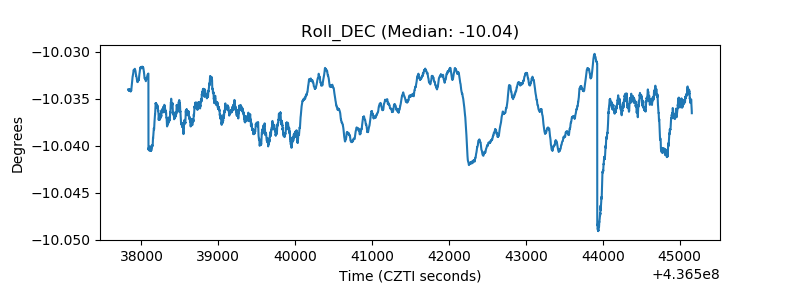 |
| _Roll_RA | 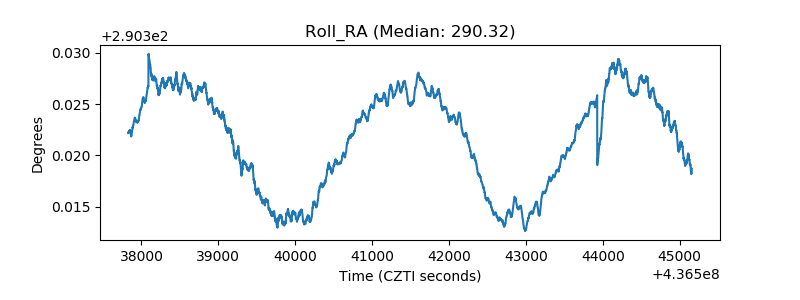 |
| Veto Counter |  |