| Param | Original file | Final file |
|---|---|---|
| Filename | modeM0/AS1A13_026T01_9000005904_43767cztM0_level2.fits | modeM0/AS1A13_026T01_9000005904_43767cztM0_level2_quad_clean.evt |
| Size (bytes) | 614,171,520 | 99,593,280 |
| Size | 585.7 MB | 95.0 MB |
| Events in quadrant A | 4,652,381 | 704,851 |
| Events in quadrant B | 4,497,775 | 711,286 |
| Events in quadrant C | 5,147,758 | 682,303 |
| Events in quadrant D | 7,933,579 | 464,605 |
| Mode M0 | |||
|---|---|---|---|
| Quadrant | BADHDUFLAG | Total packets | Discarded packets |
| A | 0 | 18578 | 1 |
| B | 0 | 17692 | 2 |
| C | 0 | 19725 | 1 |
| D | 0 | 27994 | 1 |
| Mode SS | |||
|---|---|---|---|
| Quadrant | BADHDUFLAG | Total packets | Discarded packets |
| A | 0 | 132 | 0 |
| B | 0 | 132 | 0 |
| C | 0 | 132 | 0 |
| D | 0 | 132 | 0 |
| Mode M9 | |||
|---|---|---|---|
| Quadrant | BADHDUFLAG | Total packets | Discarded packets |
| A | 0 | 4 | 0 |
| B | 0 | 4 | 0 |
| C | 0 | 4 | 0 |
| D | 0 | 4 | 0 |
| Quadrant | Total seconds | Saturated seconds | Saturation percentage |
|---|---|---|---|
| A | 6484 | 215 | 3.315854% |
| B | 6483 | 372 | 5.738084% |
| C | 6483 | 497 | 7.666204% |
| D | 6484 | 1941 | 29.935225% |
Noise dominated data is calculated using 1-second bins in cleaned event files. If a bin has >2000 counts, and if more than 50% of those come from <1% of pixels, then it is considered to be noise-dominated and hence unusable.
| Quadrant | # 1 sec bins | Bins with >0 counts | Bins with >2000 counts | High rate bins dominated by noise | Noise dominated (total time) | Noise dominated (detector-on time) | Marked lightcurve |
|---|---|---|---|---|---|---|---|
| A | 6889 | 6485 | 72 | 72 | 1.05% | 1.11% | 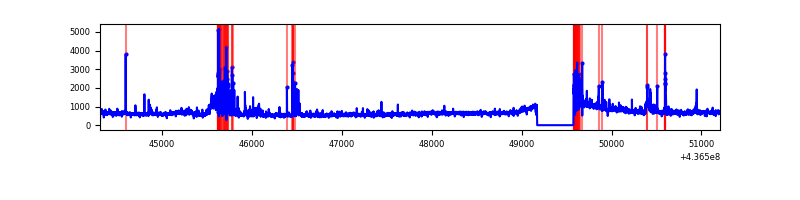 |
| B | 6888 | 6484 | 145 | 145 | 2.11% | 2.24% | 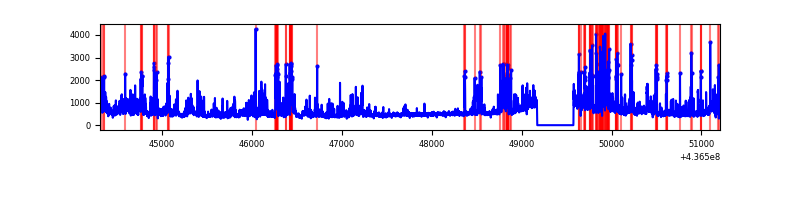 |
| C | 6888 | 6484 | 365 | 365 | 5.30% | 5.63% | 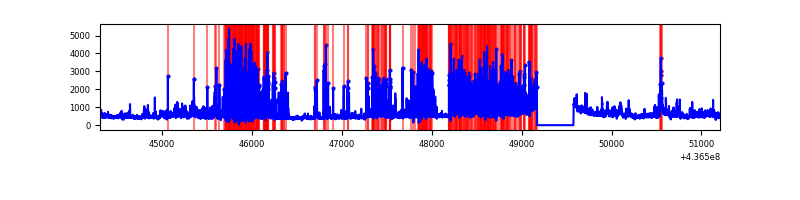 |
| D | 6889 | 6485 | 1619 | 1619 | 23.50% | 24.97% | 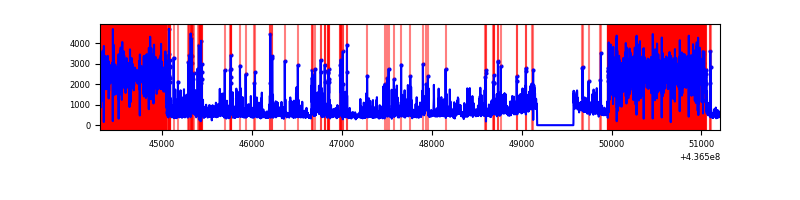 |
Top three noisy pixels from each quadrant. If the there are fewer than three noisy pixels in the level2.evt file, extra rows are filled as -1
| Pixel properties | Quadrant properties | ||||||
|---|---|---|---|---|---|---|---|
| Quadrant | DetID | PixID | Counts | Sigma | Mean | Median | Sigma |
| A | 10 | 83 | 936563 | 5985.59 | 744 | 727 | 156.3 |
| A | 13 | 248 | 258620 | 1649.48 | 744 | 727 | 156.3 |
| A | 15 | 223 | 249656 | 1592.14 | 744 | 727 | 156.3 |
| B | 0 | 200 | 603276 | 4137.54 | 741 | 718 | 145.6 |
| B | 5 | 235 | 338073 | 2316.49 | 741 | 718 | 145.6 |
| B | 5 | 255 | 132123 | 902.31 | 741 | 718 | 145.6 |
| C | 15 | 158 | 1509497 | 9007.81 | 714 | 716 | 167.5 |
| C | 3 | 233 | 571446 | 3407.41 | 714 | 716 | 167.5 |
| C | 15 | 157 | 132829 | 788.75 | 714 | 716 | 167.5 |
| D | 5 | 235 | 4250942 | 26277.15 | 618 | 597 | 161.8 |
| D | 1 | 52 | 238922 | 1473.41 | 618 | 597 | 161.8 |
| D | 5 | 222 | 173654 | 1069.9 | 618 | 597 | 161.8 |
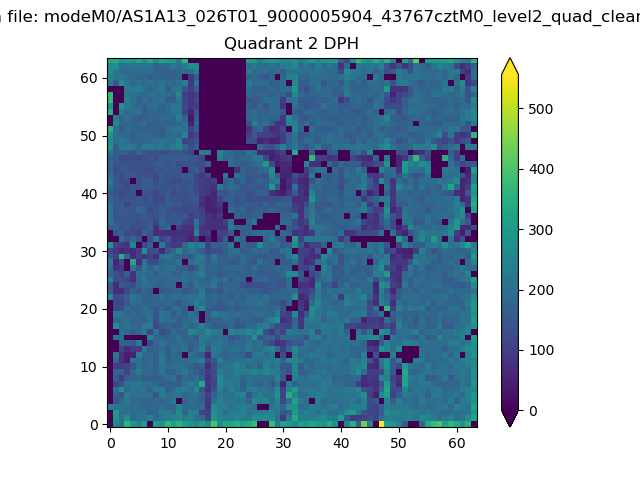
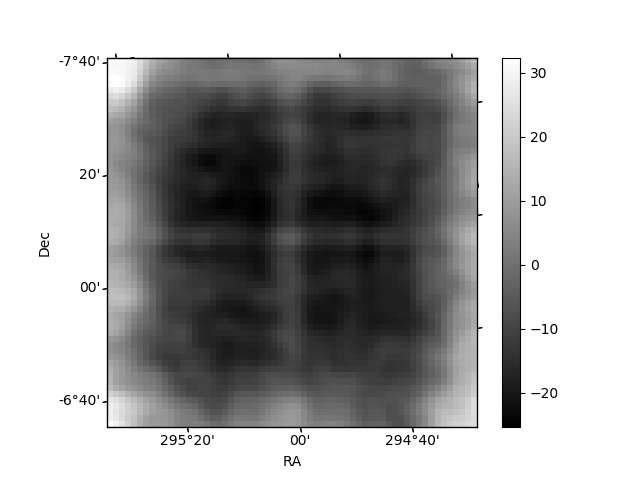
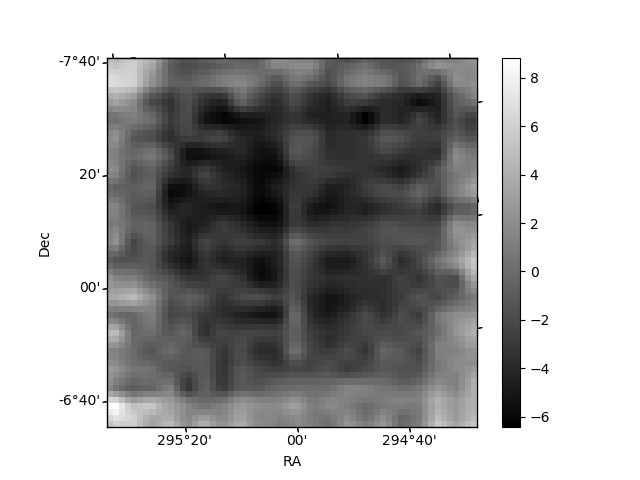
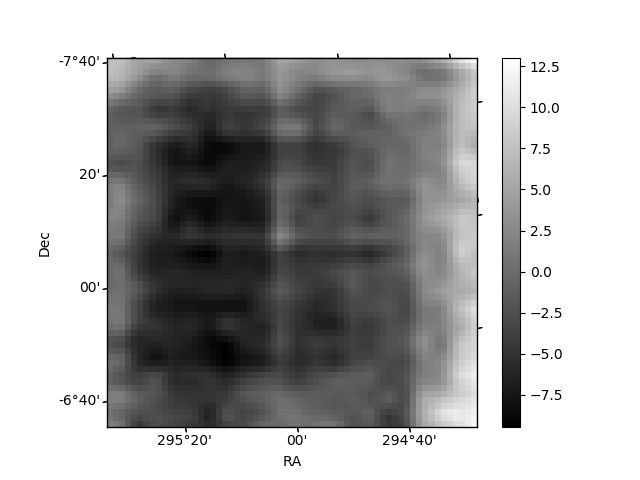
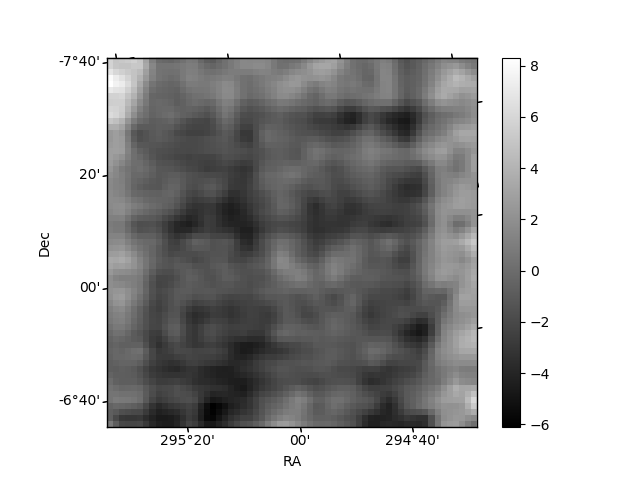
Histogram calculated using DETX and DETY for each event in the final _common_clean file
| Quadrant A | 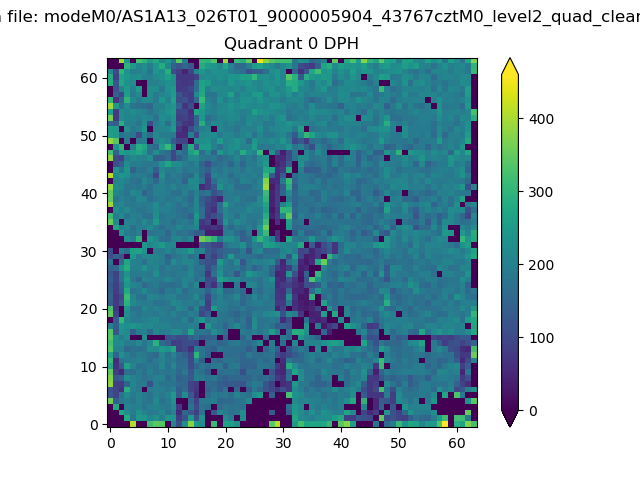 |
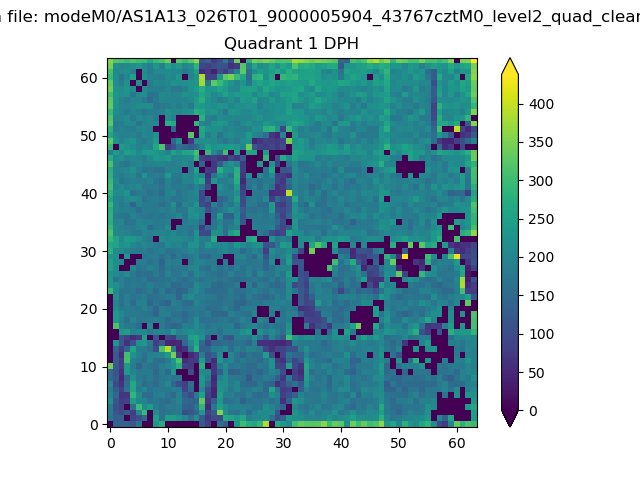 |
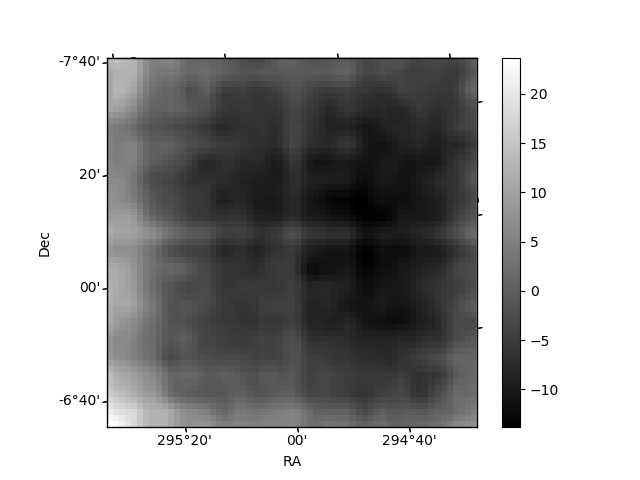
Quadrant B |
|---|---|---|---|
| Quadrant D | 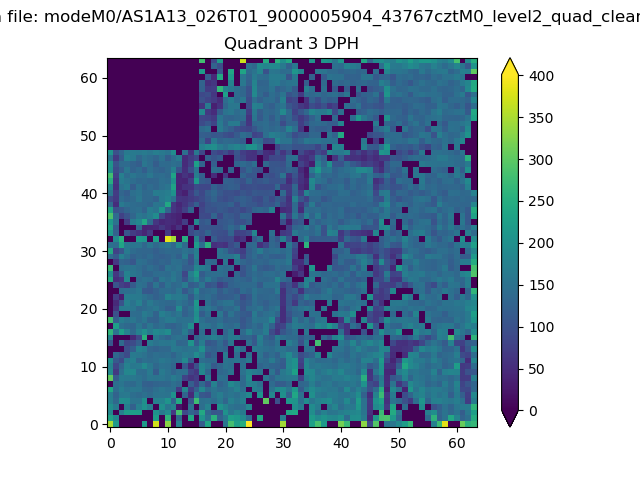 |
 |
Quadrant C |
| Plot type | Count rate plots | Images |
|---|---|---|
| Comparison with Poisson distribution Blue bars denote a histogram of data divided into 1 sec bins. Red curve is a Poisson curve with rate = median count rate of data. |
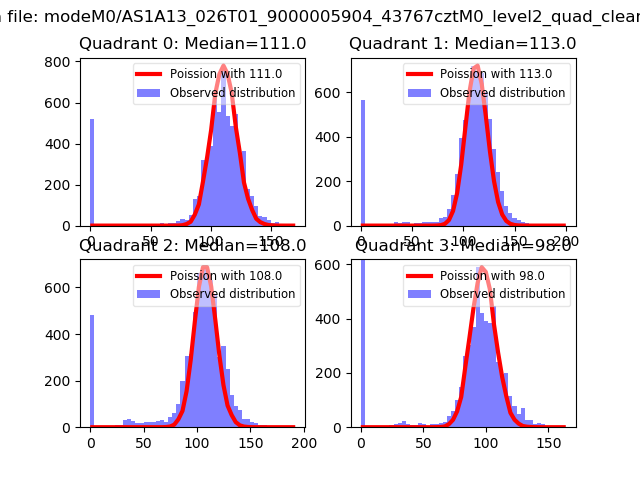 |
 |
| Quadrant-wise count rates Data is divided into 100 sec bins |
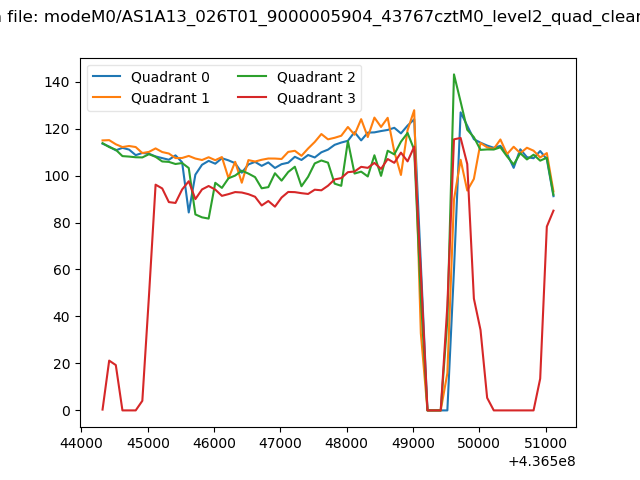 |
|
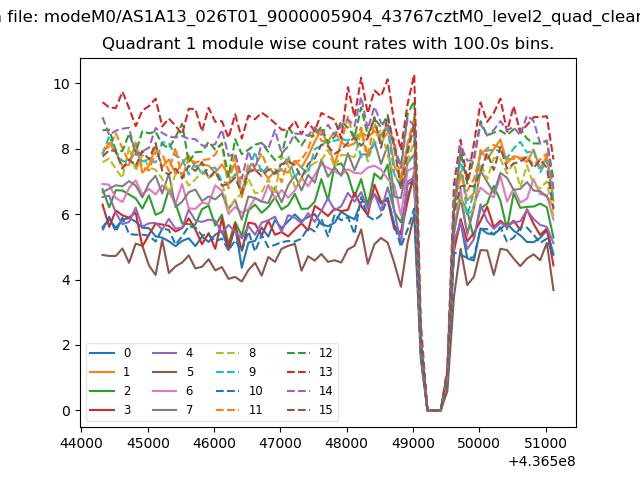
| Module-wise count rates for Quadrant A Data is divided into 100 sec bins |
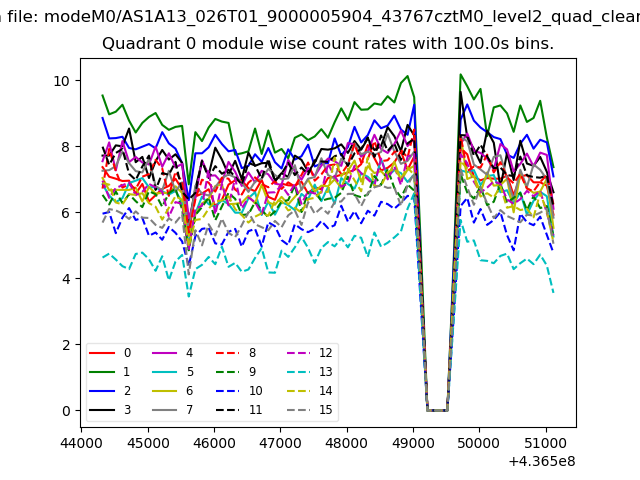 |
 |
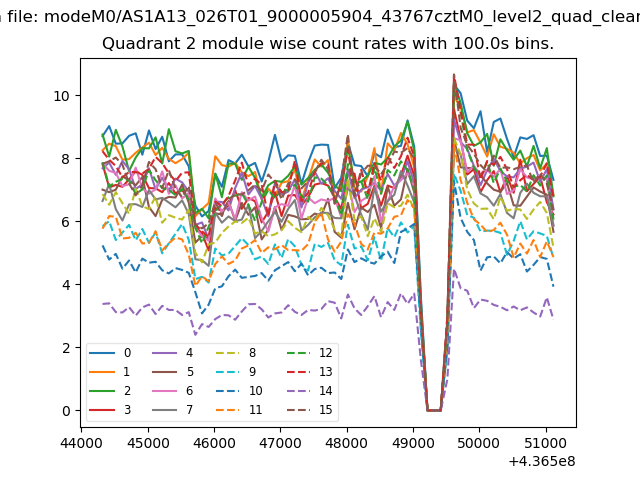
| Module-wise count rates for Quadrant B Data is divided into 100 sec bins |
 |
 |
| Module-wise count rates for Quadrant C Data is divided into 100 sec bins |
 |
 |
| Module-wise count rates for Quadrant D Data is divided into 100 sec bins |
 |
 |
| Parameter | Plot |
|---|---|
| CZT HV Monitor | 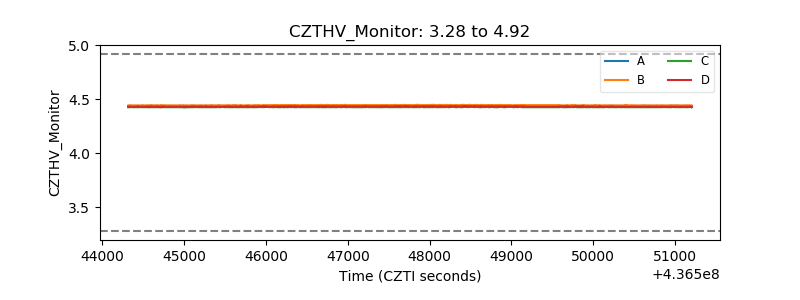 |
| D_VDD | 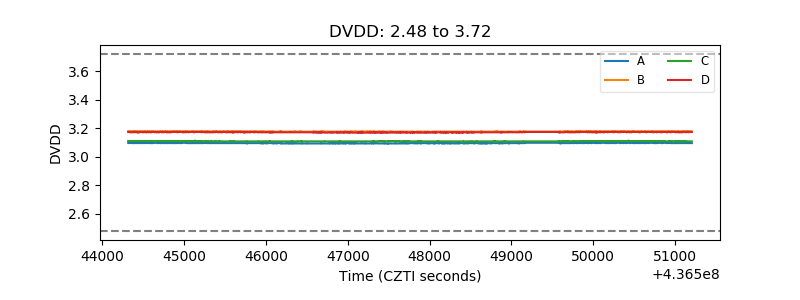 |
| Temperature 1 | 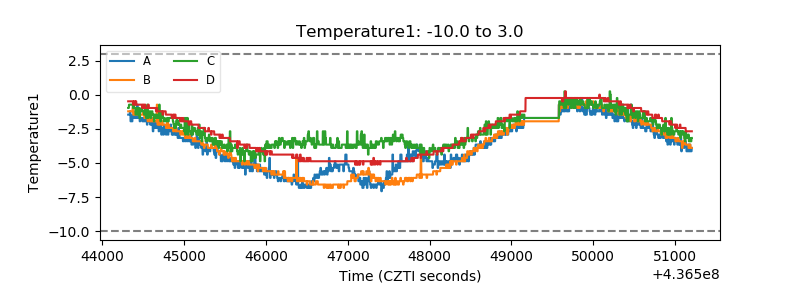 |
| Veto HV Monitor | 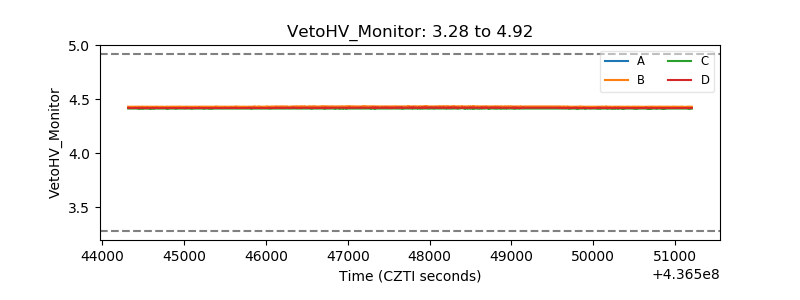 |
| Veto LLD | 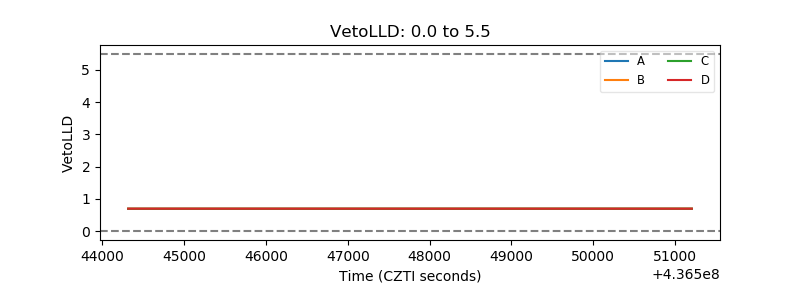 |
| Alpha Counter | 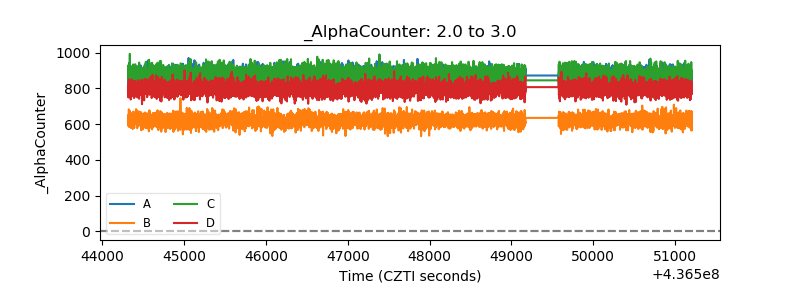 |
| _CPM_Rate | 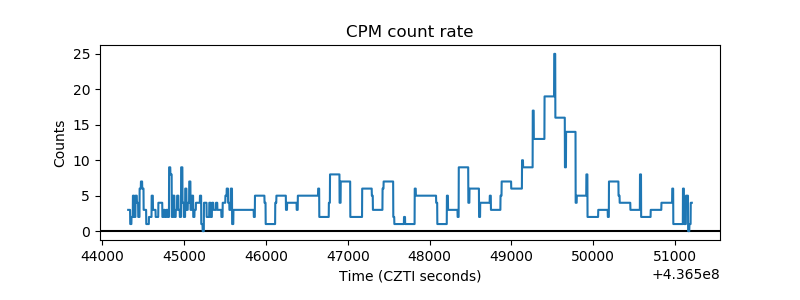 |
| CZT Counter | 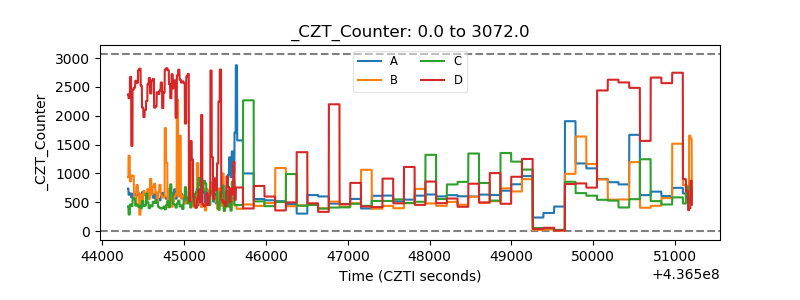 |
| +2.5 Volts monitor | 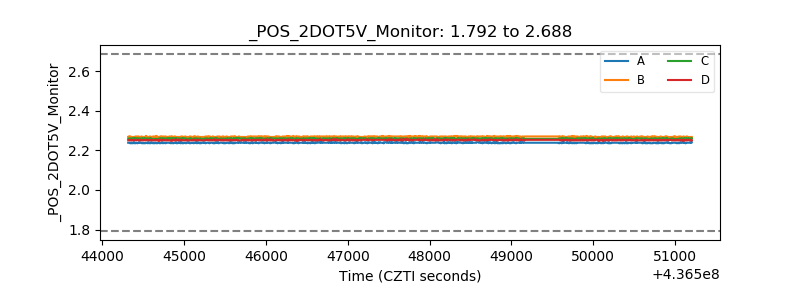 |
| +5 Volts monitor | 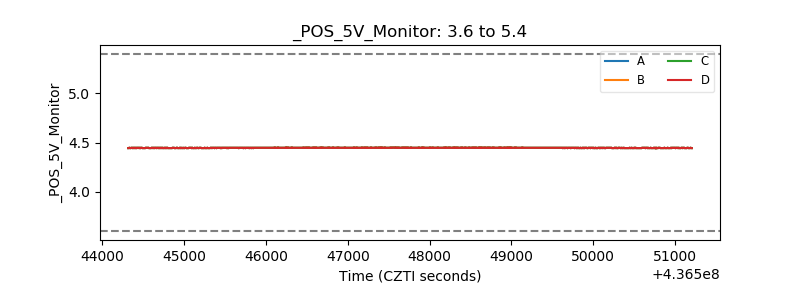 |
| _ROLL_ROT |  |
| _Roll_DEC | 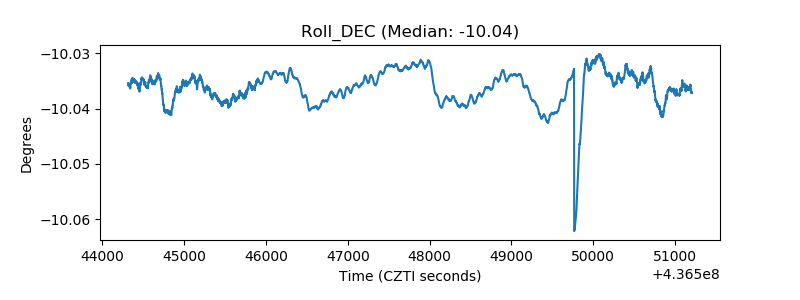 |
| _Roll_RA | 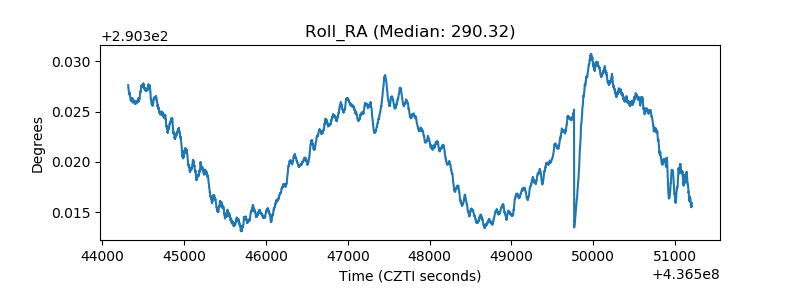 |
| Veto Counter | 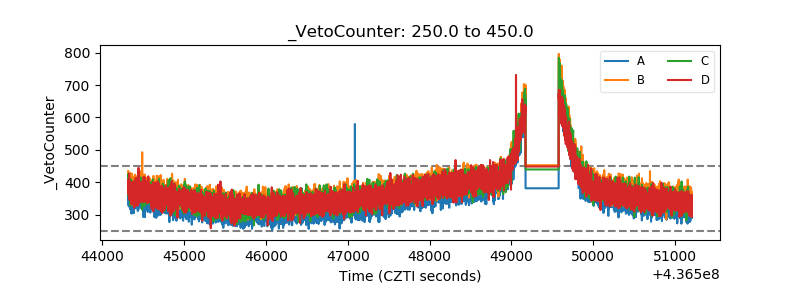 |