| Param | Original file | Final file |
|---|---|---|
| Filename | modeM0/AS1A13_026T01_9000005904_43768cztM0_level2.fits | modeM0/AS1A13_026T01_9000005904_43768cztM0_level2_quad_clean.evt |
| Size (bytes) | 766,221,120 | 113,472,000 |
| Size | 730.7 MB | 108.2 MB |
| Events in quadrant A | 7,117,970 | 776,573 |
| Events in quadrant B | 4,923,669 | 831,487 |
| Events in quadrant C | 6,151,538 | 788,621 |
| Events in quadrant D | 9,588,672 | 515,922 |
| Mode M0 | |||
|---|---|---|---|
| Quadrant | BADHDUFLAG | Total packets | Discarded packets |
| A | 0 | 26626 | 0 |
| B | 0 | 19667 | 2 |
| C | 0 | 23474 | 0 |
| D | 0 | 33650 | 0 |
| Mode SS | |||
|---|---|---|---|
| Quadrant | BADHDUFLAG | Total packets | Discarded packets |
| A | 0 | 150 | 0 |
| B | 0 | 150 | 0 |
| C | 0 | 150 | 0 |
| D | 0 | 150 | 0 |
| Quadrant | Total seconds | Saturated seconds | Saturation percentage |
|---|---|---|---|
| A | 7513 | 620 | 8.252363% |
| B | 7512 | 270 | 3.594249% |
| C | 7512 | 515 | 6.855698% |
| D | 7512 | 2377 | 31.642705% |
Noise dominated data is calculated using 1-second bins in cleaned event files. If a bin has >2000 counts, and if more than 50% of those come from <1% of pixels, then it is considered to be noise-dominated and hence unusable.
| Quadrant | # 1 sec bins | Bins with >0 counts | Bins with >2000 counts | High rate bins dominated by noise | Noise dominated (total time) | Noise dominated (detector-on time) | Marked lightcurve |
|---|---|---|---|---|---|---|---|
| A | 7513 | 7513 | 387 | 387 | 5.15% | 5.15% | 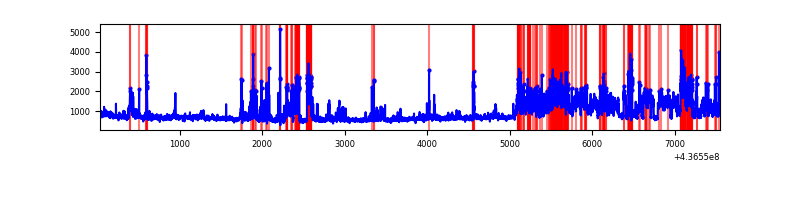 |
| B | 7512 | 7512 | 142 | 142 | 1.89% | 1.89% | 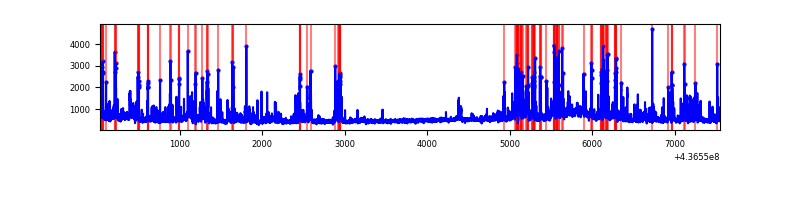 |
| C | 7512 | 7512 | 480 | 480 | 6.39% | 6.39% | 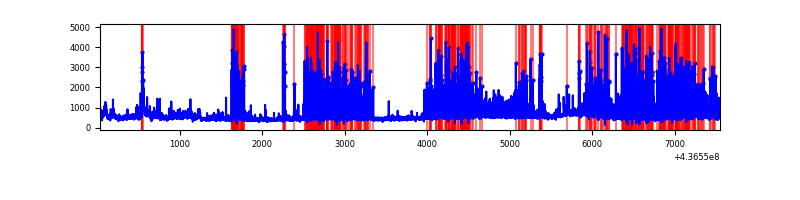 |
| D | 7512 | 7512 | 1966 | 1966 | 26.17% | 26.17% | 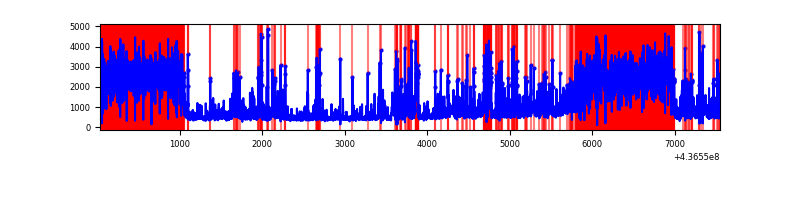 |
Top three noisy pixels from each quadrant. If the there are fewer than three noisy pixels in the level2.evt file, extra rows are filled as -1
| Pixel properties | Quadrant properties | ||||||
|---|---|---|---|---|---|---|---|
| Quadrant | DetID | PixID | Counts | Sigma | Mean | Median | Sigma |
| A | 14 | 63 | 1983403 | 11376.68 | 834 | 817 | 174.3 |
| A | 10 | 83 | 1034776 | 5933.17 | 834 | 817 | 174.3 |
| A | 15 | 223 | 524820 | 3006.89 | 834 | 817 | 174.3 |
| B | 0 | 200 | 506307 | 3052.97 | 846 | 821 | 165.6 |
| B | 5 | 235 | 340539 | 2051.79 | 846 | 821 | 165.6 |
| B | 0 | 213 | 144593 | 868.34 | 846 | 821 | 165.6 |
| C | 15 | 158 | 2274944 | 11885.3 | 814 | 820 | 191.3 |
| C | 3 | 233 | 426728 | 2225.93 | 814 | 820 | 191.3 |
| C | 14 | 254 | 117721 | 610.96 | 814 | 820 | 191.3 |
| D | 5 | 235 | 4756092 | 26083.73 | 701 | 676 | 182.3 |
| D | 1 | 52 | 366083 | 2004.28 | 701 | 676 | 182.3 |
| D | 13 | 249 | 348206 | 1906.22 | 701 | 676 | 182.3 |
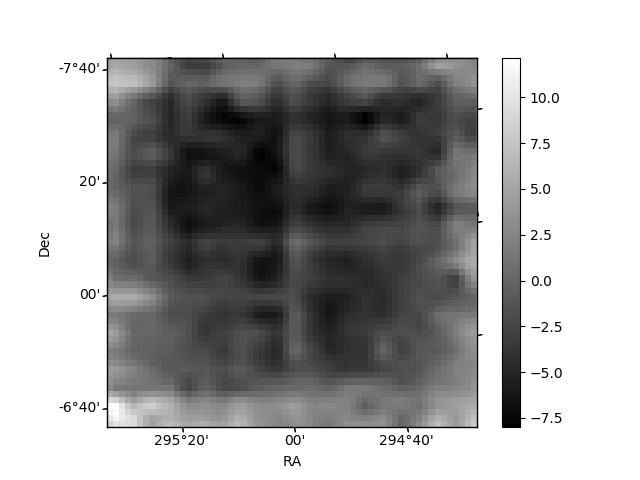
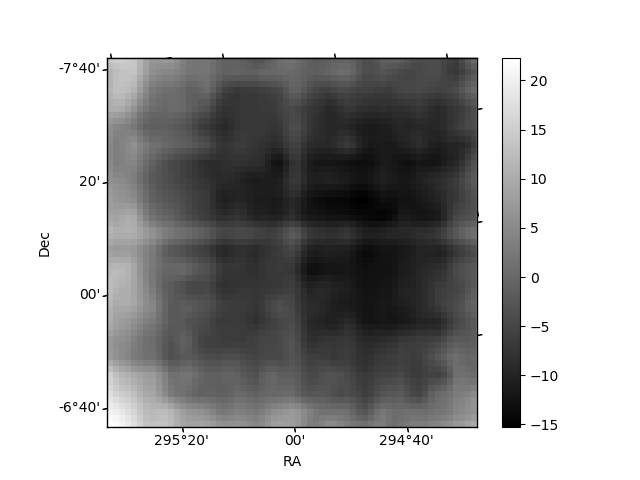
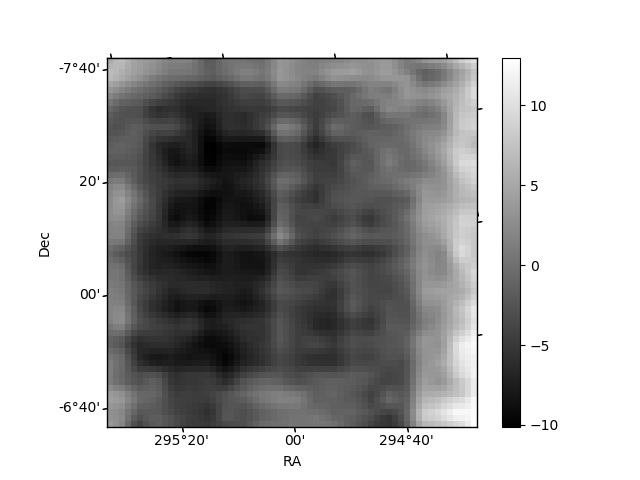
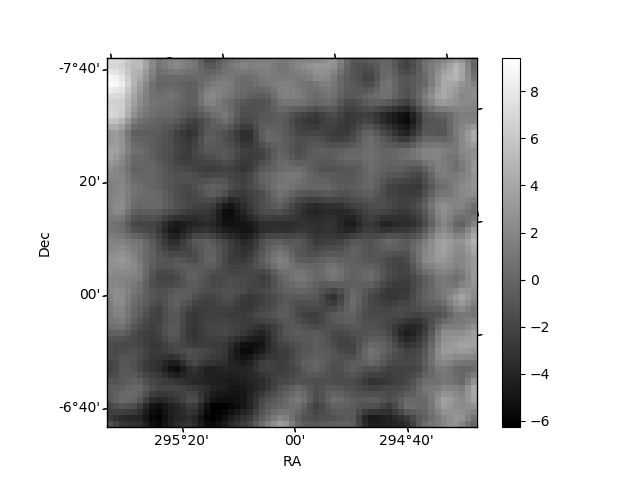
Histogram calculated using DETX and DETY for each event in the final _common_clean file
| Quadrant A | 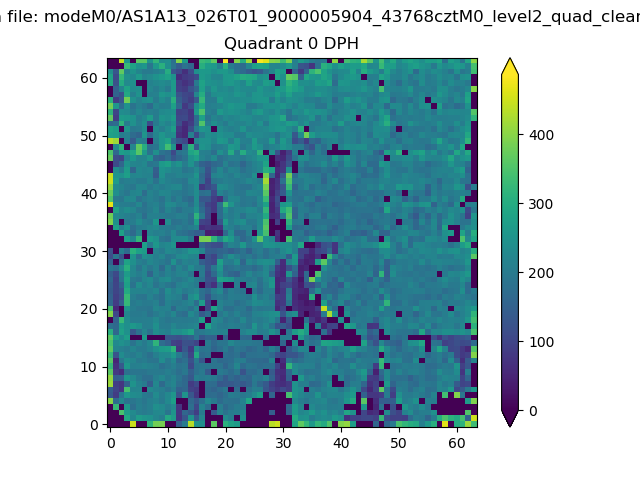 |
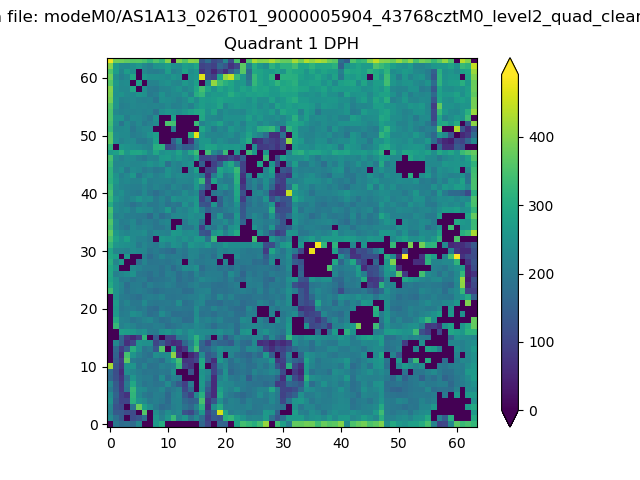 |
Quadrant B |
|---|---|---|---|
| Quadrant D | 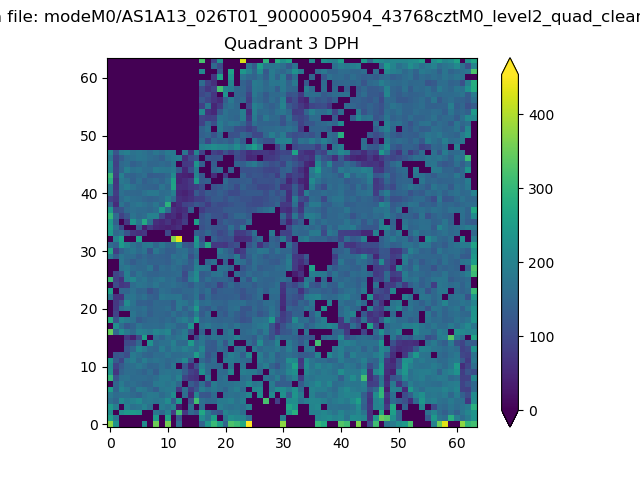 |
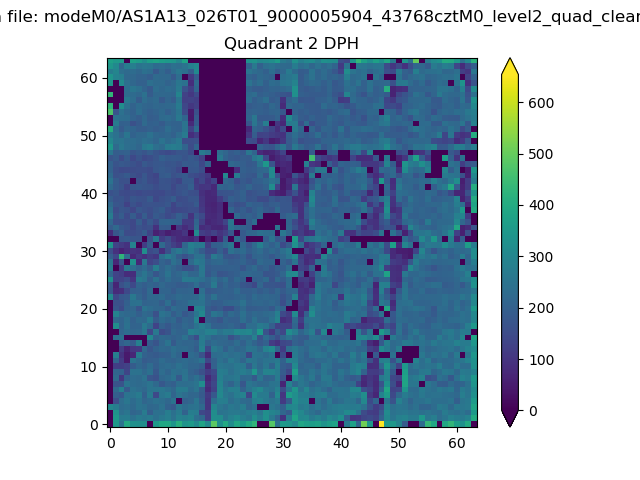 |
Quadrant C |
| Plot type | Count rate plots | Images |
|---|---|---|
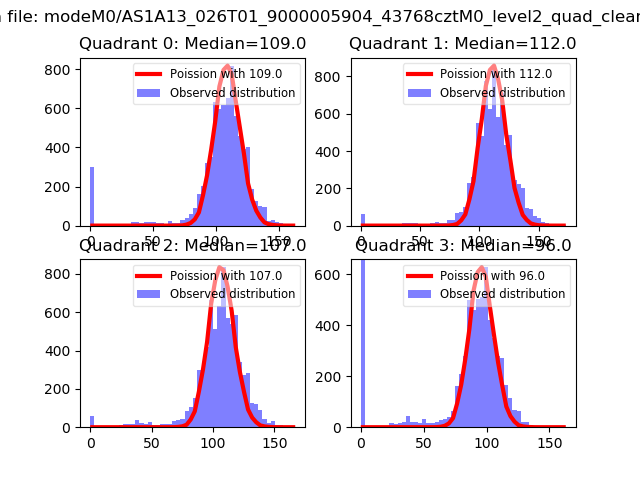
| Comparison with Poisson distribution Blue bars denote a histogram of data divided into 1 sec bins. Red curve is a Poisson curve with rate = median count rate of data. |
 |
 |
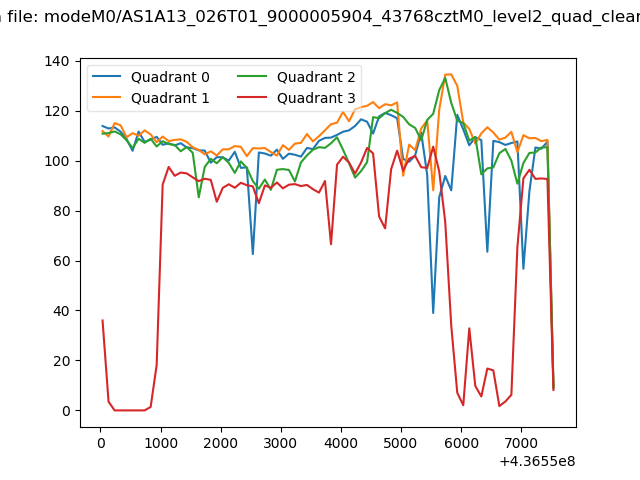
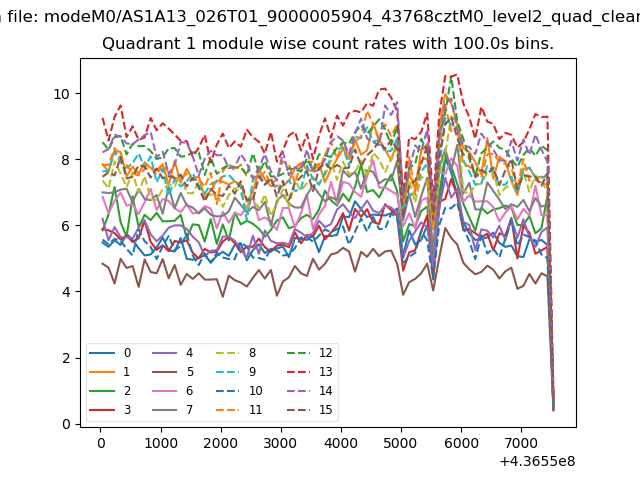
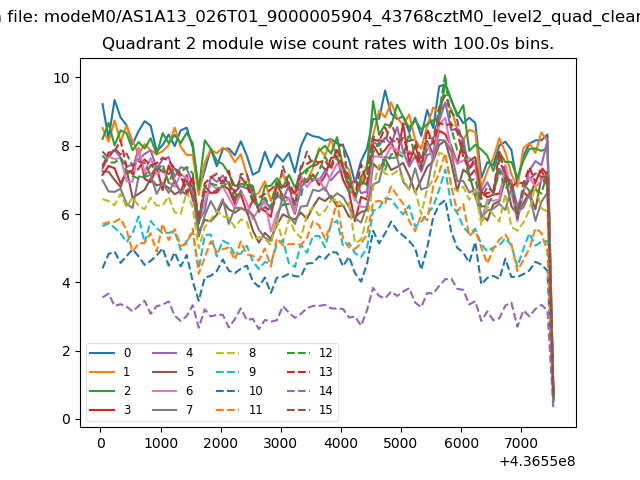
| Quadrant-wise count rates Data is divided into 100 sec bins |
 |
|
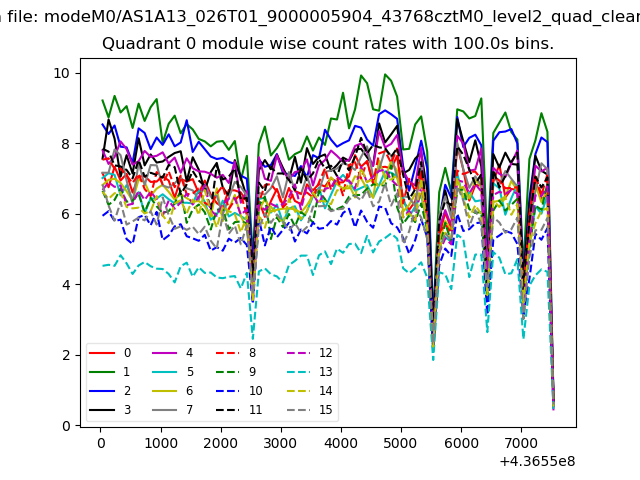
| Module-wise count rates for Quadrant A Data is divided into 100 sec bins |
 |
 |
| Module-wise count rates for Quadrant B Data is divided into 100 sec bins |
 |
 |
| Module-wise count rates for Quadrant C Data is divided into 100 sec bins |
 |
 |
| Module-wise count rates for Quadrant D Data is divided into 100 sec bins |
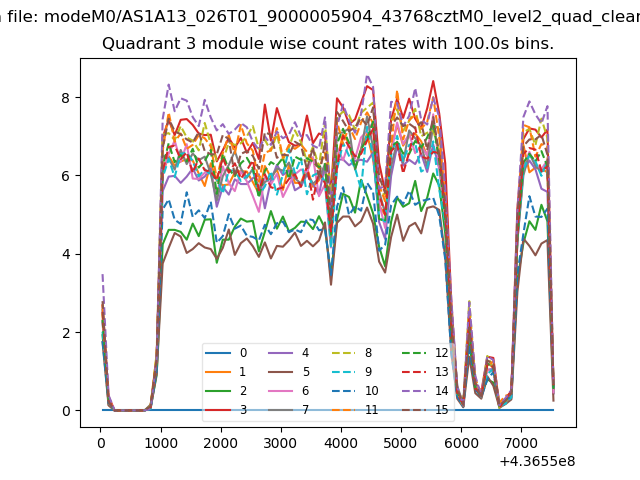 |
 |
| Parameter | Plot |
|---|---|
| CZT HV Monitor | 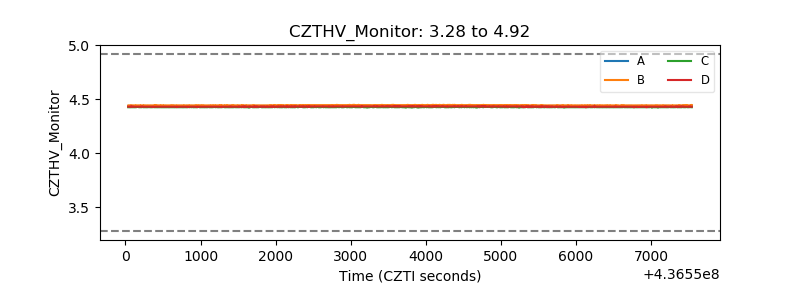 |
| D_VDD | 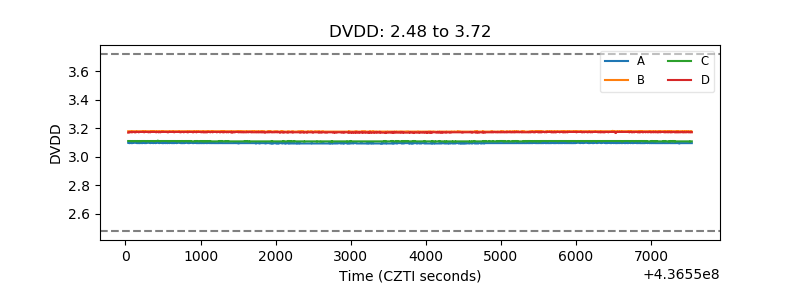 |
| Temperature 1 | 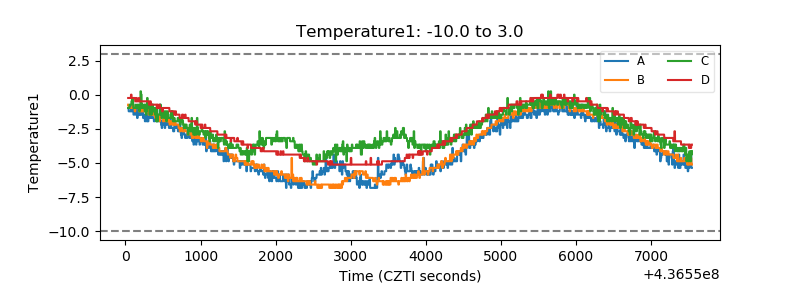 |
| Veto HV Monitor |  |
| Veto LLD | 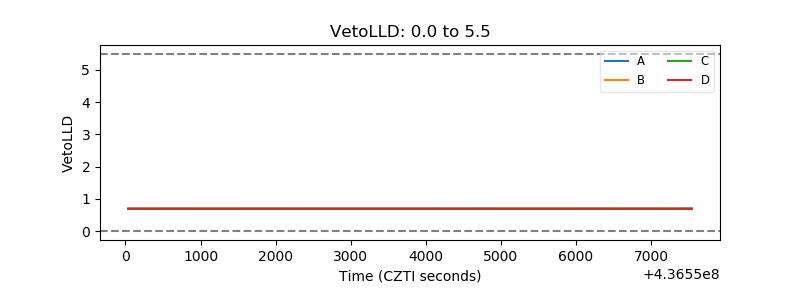 |
| Alpha Counter | 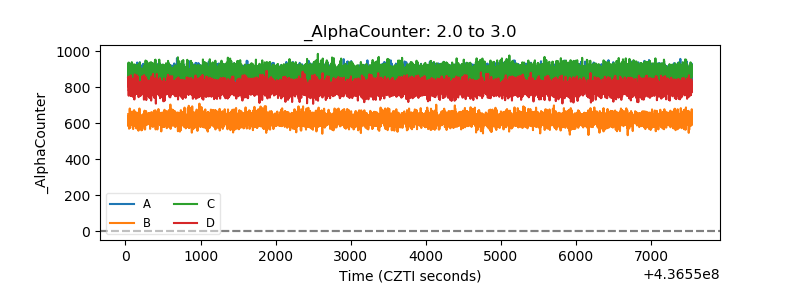 |
| _CPM_Rate | 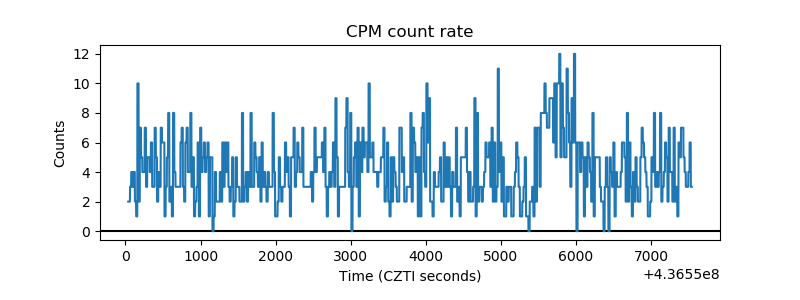 |
| CZT Counter | 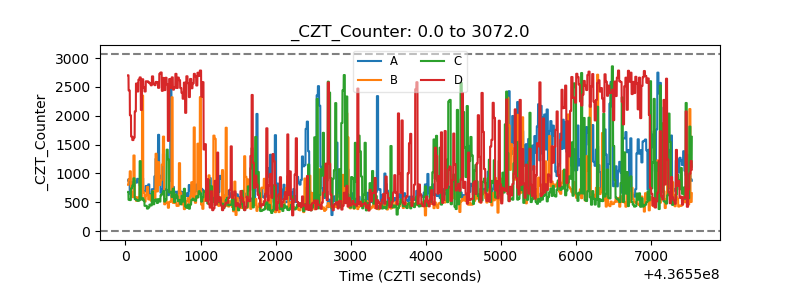 |
| +2.5 Volts monitor | 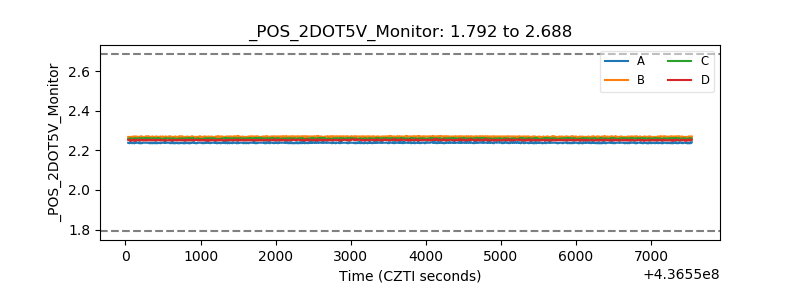 |
| +5 Volts monitor | 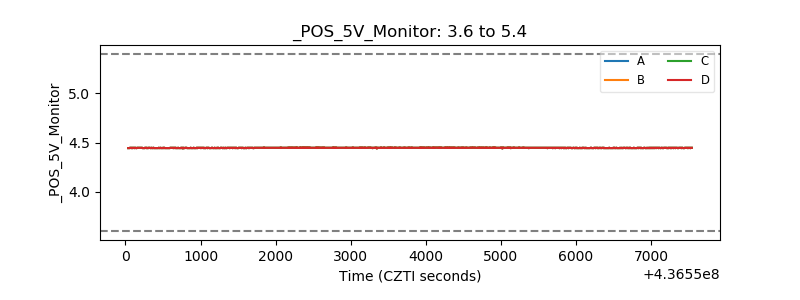 |
| _ROLL_ROT | 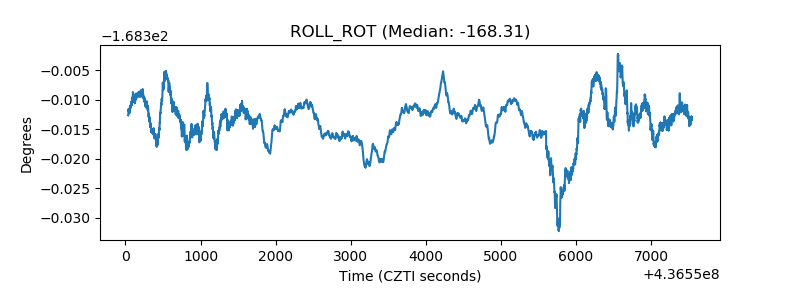 |
| _Roll_DEC | 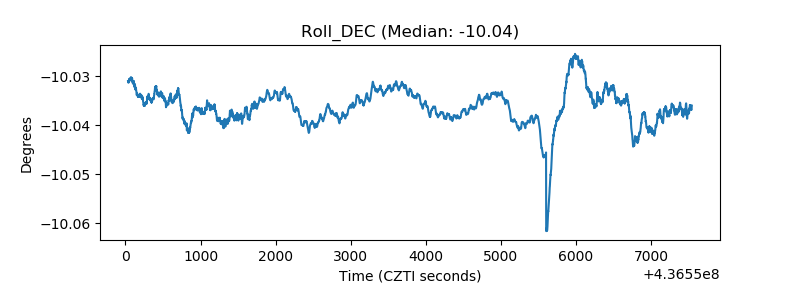 |
| _Roll_RA | 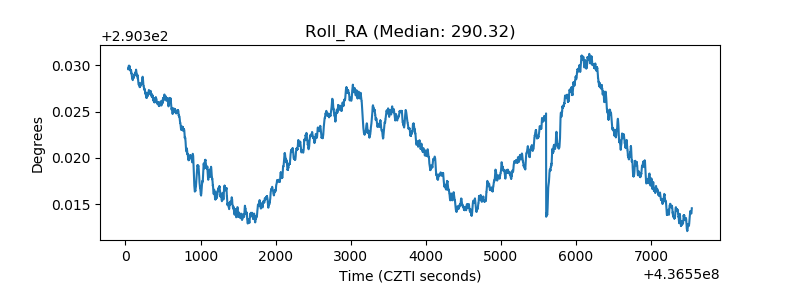 |
| Veto Counter | 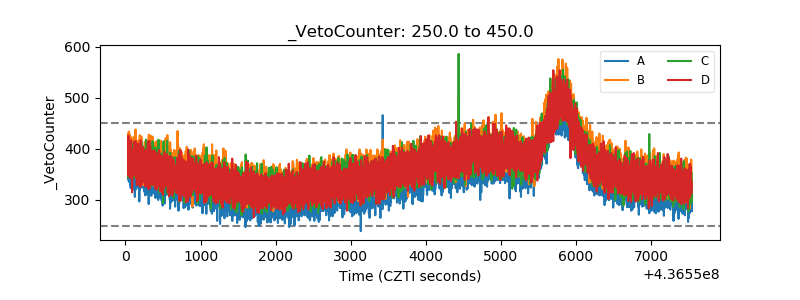 |