| Param | Original file | Final file |
|---|---|---|
| Filename | modeM0/AS1A13_026T01_9000005904_43769cztM0_level2.fits | modeM0/AS1A13_026T01_9000005904_43769cztM0_level2_quad_clean.evt |
| Size (bytes) | 772,162,560 | 114,750,720 |
| Size | 736.4 MB | 109.4 MB |
| Events in quadrant A | 6,467,966 | 801,585 |
| Events in quadrant B | 4,768,224 | 835,706 |
| Events in quadrant C | 7,719,405 | 751,724 |
| Events in quadrant D | 9,036,116 | 553,527 |
| Mode M0 | |||
|---|---|---|---|
| Quadrant | BADHDUFLAG | Total packets | Discarded packets |
| A | 0 | 24711 | 0 |
| B | 0 | 19379 | 0 |
| C | 0 | 28188 | 0 |
| D | 0 | 32109 | 0 |
| Mode SS | |||
|---|---|---|---|
| Quadrant | BADHDUFLAG | Total packets | Discarded packets |
| A | 0 | 152 | 0 |
| B | 0 | 152 | 0 |
| C | 0 | 152 | 0 |
| D | 0 | 152 | 0 |
| Quadrant | Total seconds | Saturated seconds | Saturation percentage |
|---|---|---|---|
| A | 7643 | 374 | 4.893366% |
| B | 7644 | 200 | 2.616431% |
| C | 7644 | 921 | 12.048666% |
| D | 7644 | 1990 | 26.033490% |
Noise dominated data is calculated using 1-second bins in cleaned event files. If a bin has >2000 counts, and if more than 50% of those come from <1% of pixels, then it is considered to be noise-dominated and hence unusable.
| Quadrant | # 1 sec bins | Bins with >0 counts | Bins with >2000 counts | High rate bins dominated by noise | Noise dominated (total time) | Noise dominated (detector-on time) | Marked lightcurve |
|---|---|---|---|---|---|---|---|
| A | 7643 | 7643 | 290 | 290 | 3.79% | 3.79% | 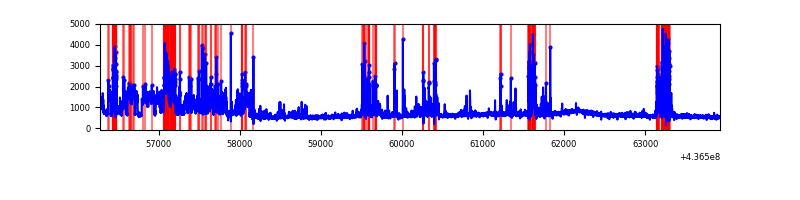 |
| B | 7644 | 7644 | 92 | 92 | 1.20% | 1.20% | 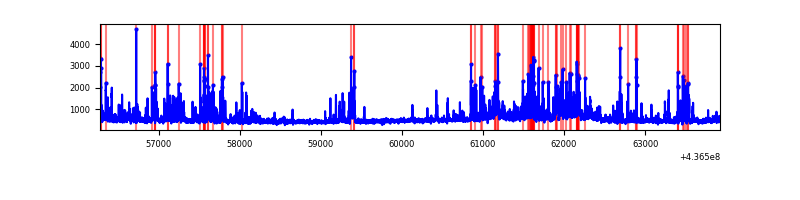 |
| C | 7644 | 7644 | 846 | 846 | 11.07% | 11.07% | 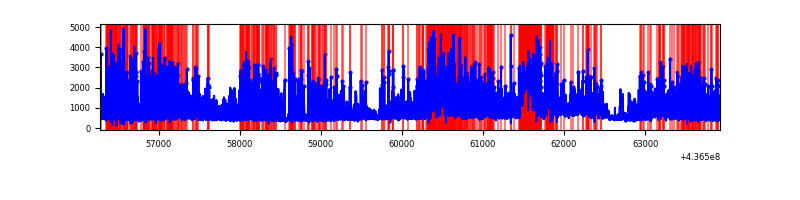 |
| D | 7644 | 7644 | 1708 | 1708 | 22.34% | 22.34% |  |
Top three noisy pixels from each quadrant. If the there are fewer than three noisy pixels in the level2.evt file, extra rows are filled as -1
| Pixel properties | Quadrant properties | ||||||
|---|---|---|---|---|---|---|---|
| Quadrant | DetID | PixID | Counts | Sigma | Mean | Median | Sigma |
| A | 10 | 83 | 1037388 | 5918.84 | 839 | 823 | 175.1 |
| A | 14 | 63 | 1006130 | 5740.36 | 839 | 823 | 175.1 |
| A | 15 | 223 | 559195 | 3188.33 | 839 | 823 | 175.1 |
| B | 0 | 200 | 601135 | 3628.97 | 851 | 826 | 165.4 |
| B | 5 | 235 | 170677 | 1026.78 | 851 | 826 | 165.4 |
| B | 5 | 172 | 140778 | 846.03 | 851 | 826 | 165.4 |
| C | 15 | 158 | 3251884 | 17181.35 | 801 | 806 | 189.2 |
| C | 15 | 174 | 664815 | 3509.16 | 801 | 806 | 189.2 |
| C | 3 | 233 | 483149 | 2549.09 | 801 | 806 | 189.2 |
| D | 5 | 235 | 3740767 | 20258.96 | 711 | 688 | 184.6 |
| D | 13 | 249 | 594943 | 3218.91 | 711 | 688 | 184.6 |
| D | 14 | 210 | 357962 | 1935.25 | 711 | 688 | 184.6 |
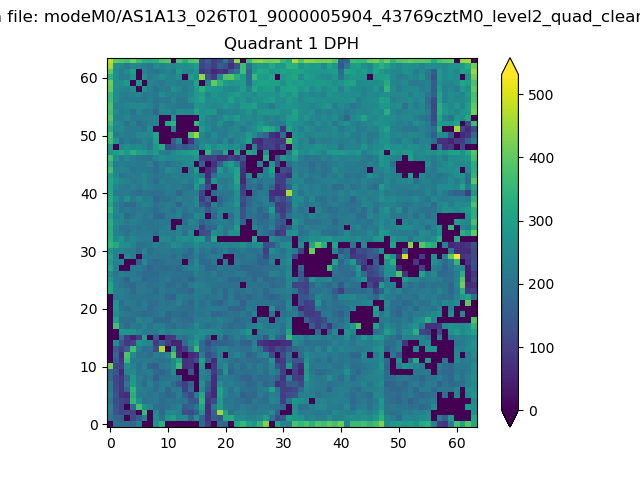
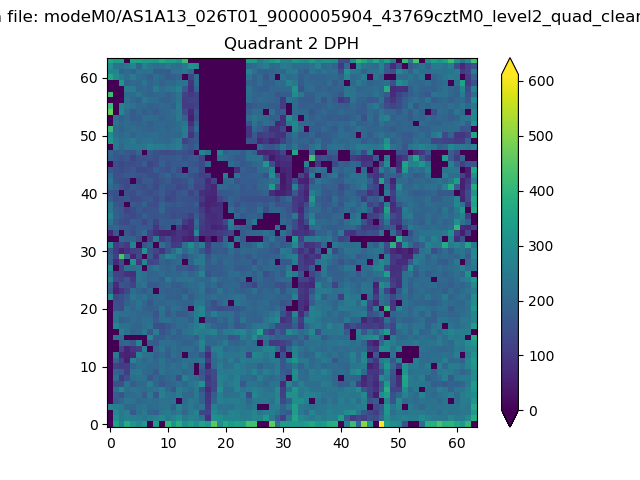
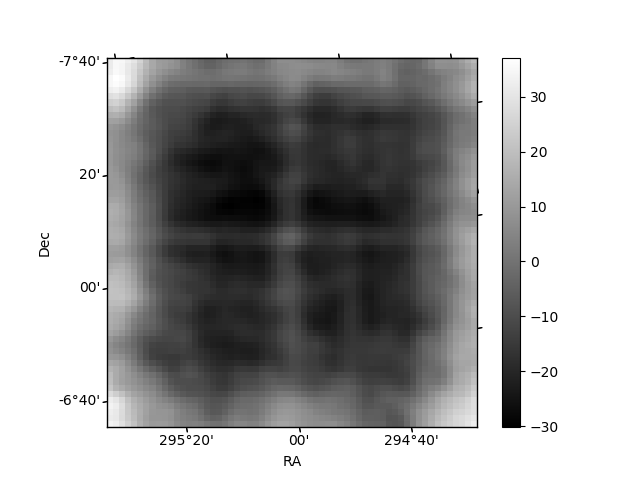
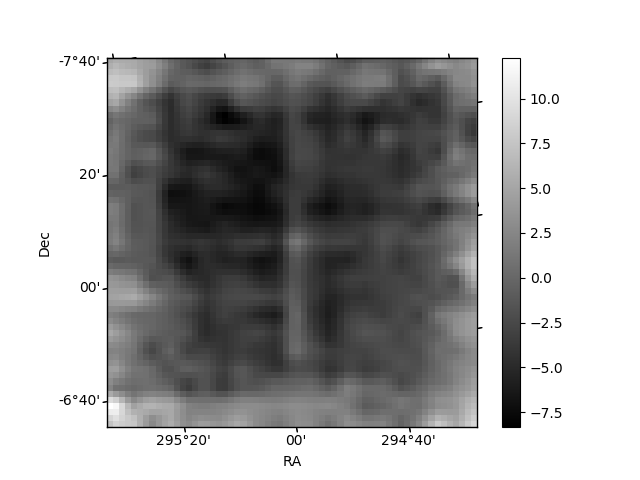
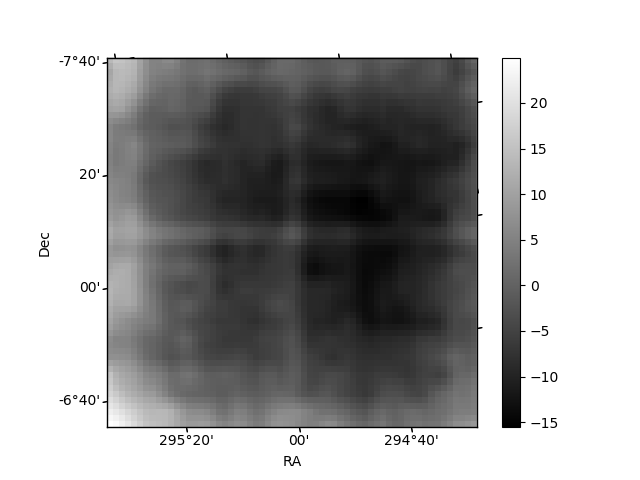
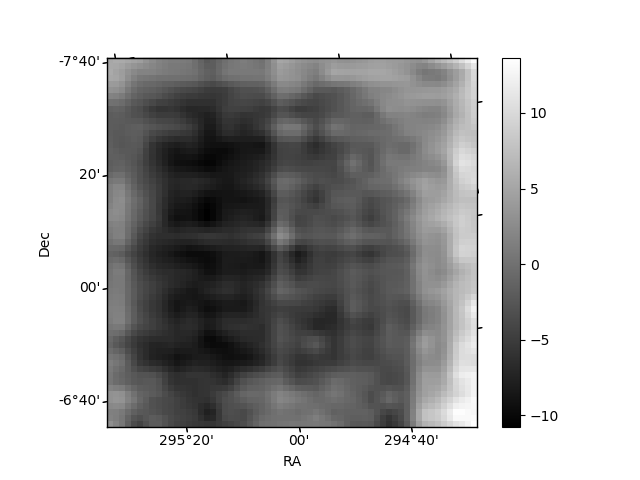
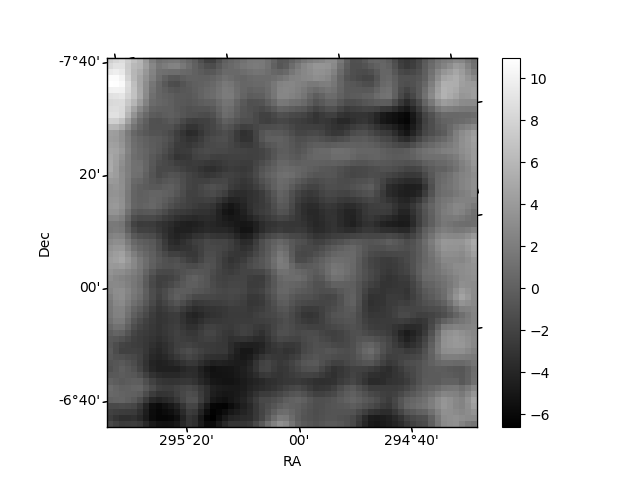
Histogram calculated using DETX and DETY for each event in the final _common_clean file
| Quadrant A | 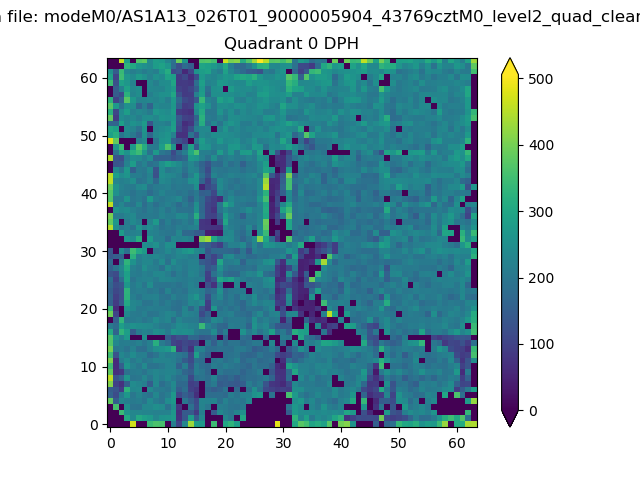 |
 |
Quadrant B |
|---|---|---|---|
| Quadrant D | 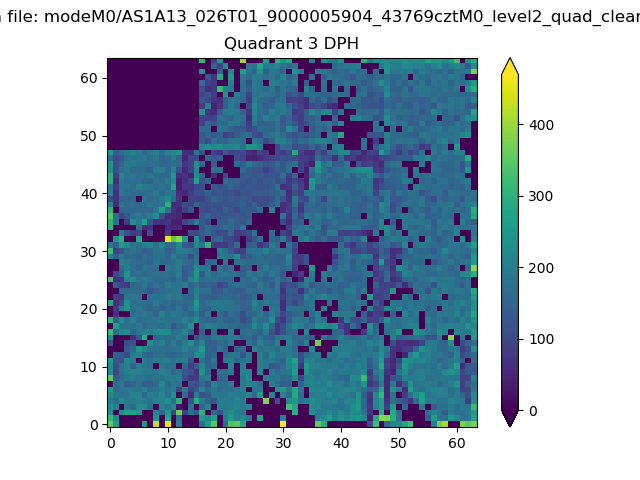 |
 |
Quadrant C |
| Plot type | Count rate plots | Images |
|---|---|---|
| Comparison with Poisson distribution Blue bars denote a histogram of data divided into 1 sec bins. Red curve is a Poisson curve with rate = median count rate of data. |
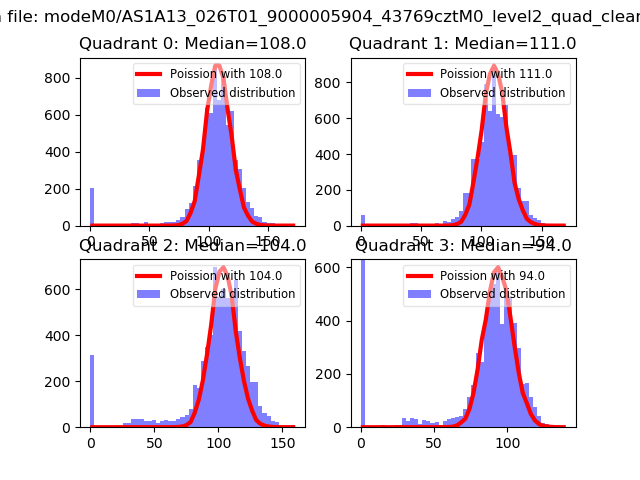 |
 |
| Quadrant-wise count rates Data is divided into 100 sec bins |
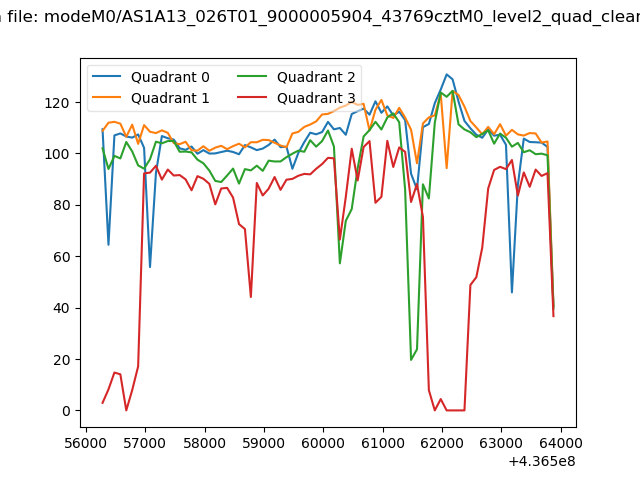 |
|
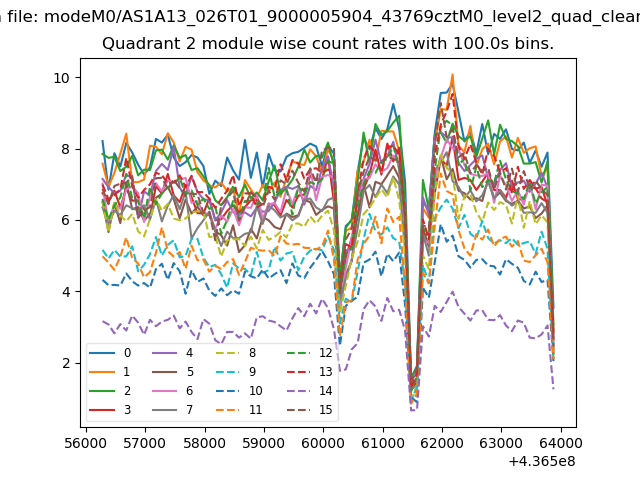
| Module-wise count rates for Quadrant A Data is divided into 100 sec bins |
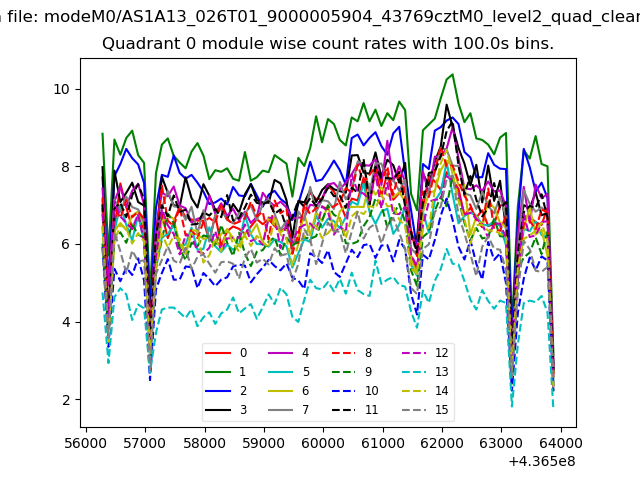 |
 |
| Module-wise count rates for Quadrant B Data is divided into 100 sec bins |
 |
 |
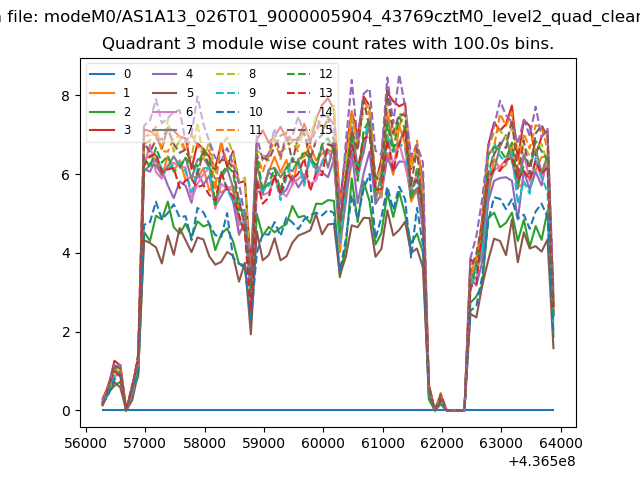
| Module-wise count rates for Quadrant C Data is divided into 100 sec bins |
 |
 |
| Module-wise count rates for Quadrant D Data is divided into 100 sec bins |
 |
 |
| Parameter | Plot |
|---|---|
| CZT HV Monitor |  |
| D_VDD | 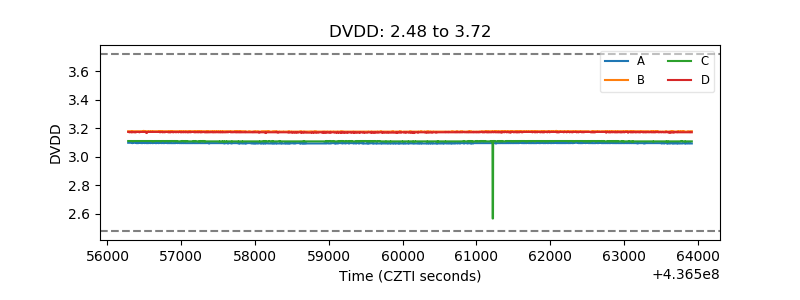 |
| Temperature 1 | 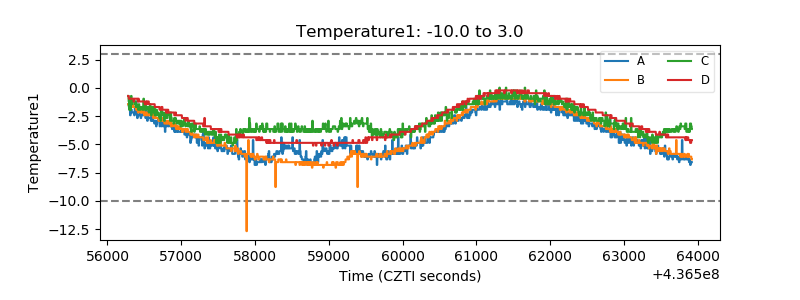 |
| Veto HV Monitor | 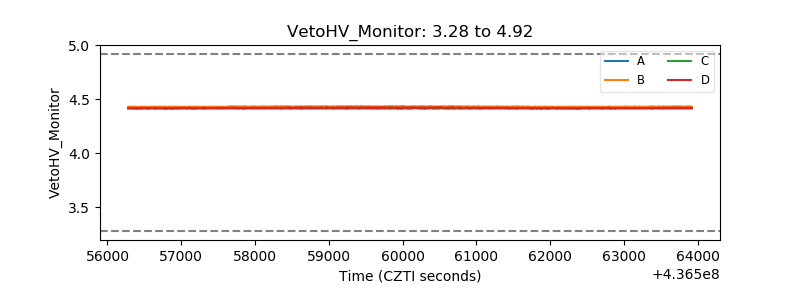 |
| Veto LLD | 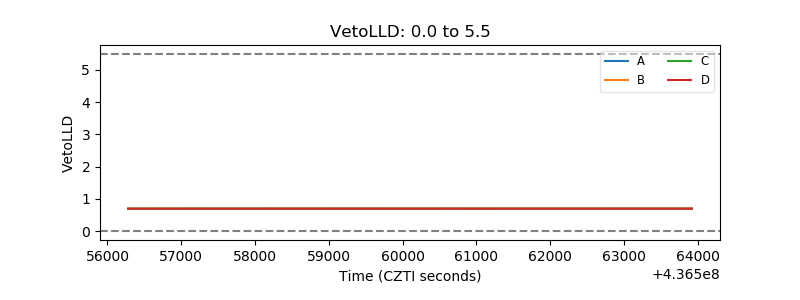 |
| Alpha Counter | 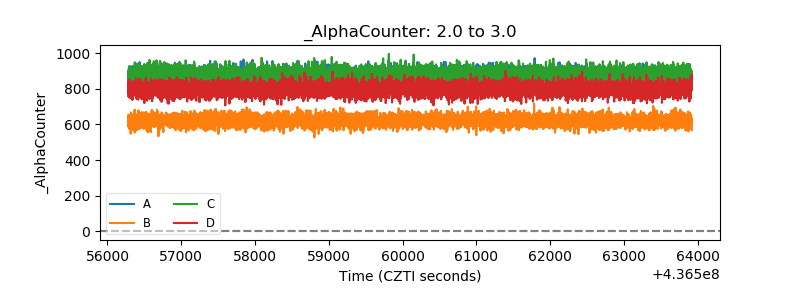 |
| _CPM_Rate | 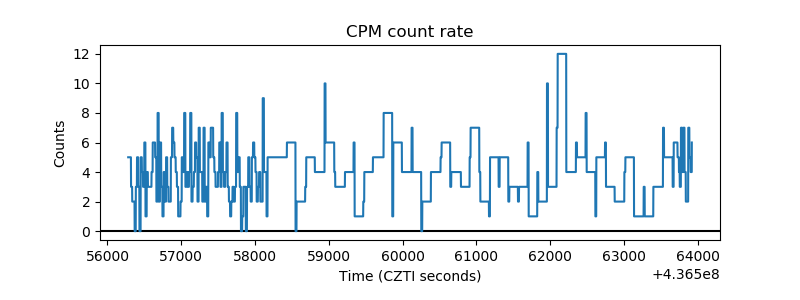 |
| CZT Counter | 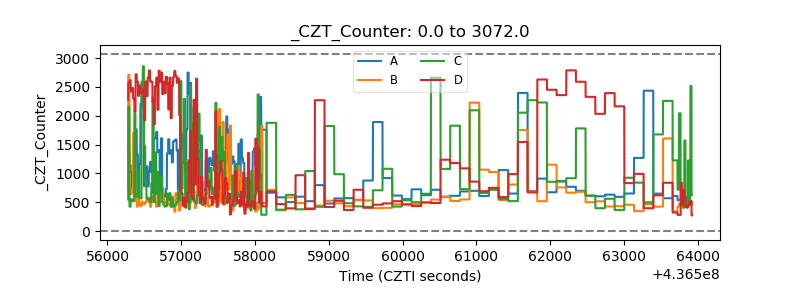 |
| +2.5 Volts monitor | 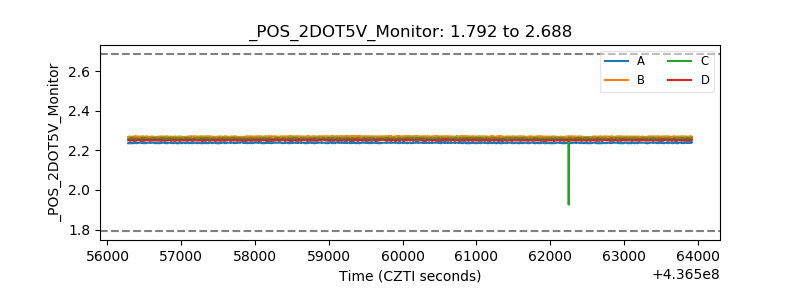 |
| +5 Volts monitor | 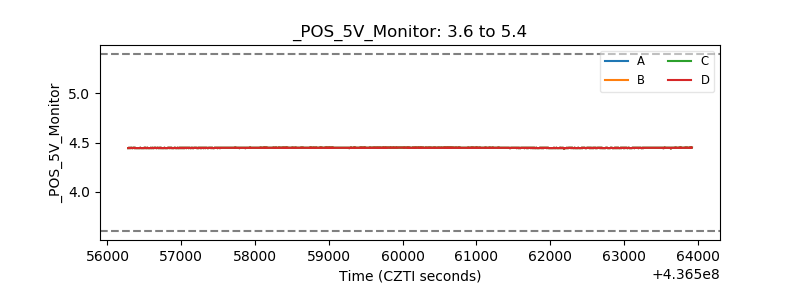 |
| _ROLL_ROT | 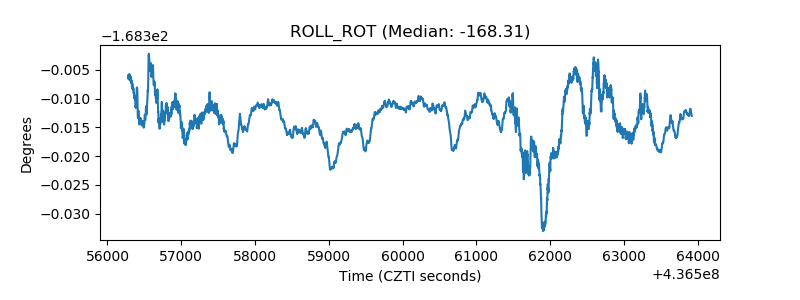 |
| _Roll_DEC | 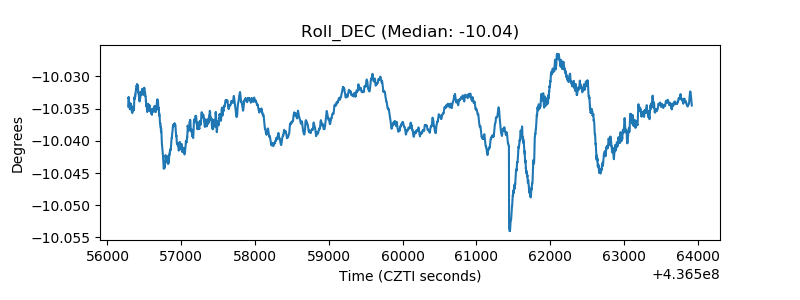 |
| _Roll_RA | 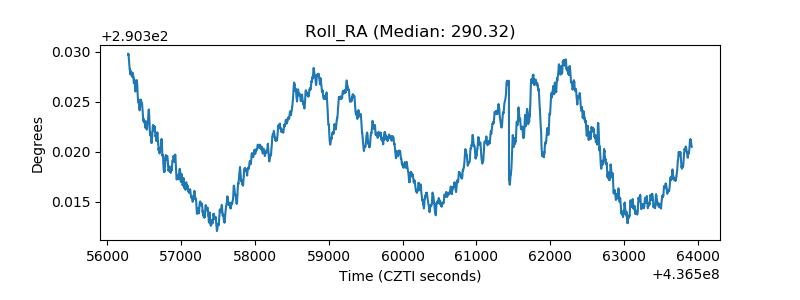 |
| Veto Counter | 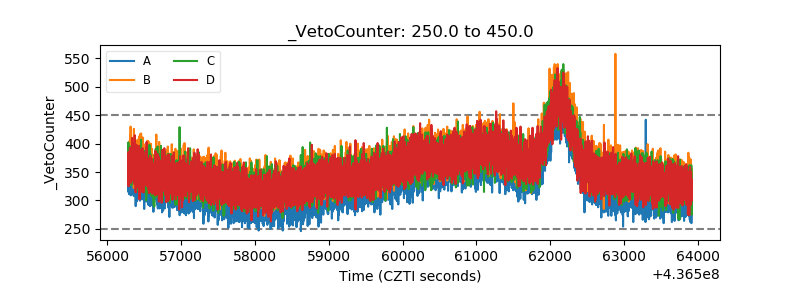 |