| Param | Original file | Final file |
|---|---|---|
| Filename | modeM0/AS1A13_026T01_9000005904_43772cztM0_level2.fits | modeM0/AS1A13_026T01_9000005904_43772cztM0_level2_quad_clean.evt |
| Size (bytes) | 1,824,505,920 | 278,317,440 |
| Size | 1.7 GB | 265.4 MB |
| Events in quadrant A | 15,817,517 | 1,889,344 |
| Events in quadrant B | 13,072,985 | 2,006,515 |
| Events in quadrant C | 19,009,712 | 1,655,716 |
| Events in quadrant D | 18,165,980 | 1,559,619 |
| Mode M0 | |||
|---|---|---|---|
| Quadrant | BADHDUFLAG | Total packets | Discarded packets |
| A | 0 | 60444 | 4 |
| B | 0 | 51744 | 4 |
| C | 0 | 69534 | 4 |
| D | 0 | 67188 | 4 |
| Mode SS | |||
|---|---|---|---|
| Quadrant | BADHDUFLAG | Total packets | Discarded packets |
| A | 0 | 386 | 0 |
| B | 0 | 386 | 0 |
| C | 0 | 386 | 0 |
| D | 0 | 388 | 0 |
| Mode M9 | |||
|---|---|---|---|
| Quadrant | BADHDUFLAG | Total packets | Discarded packets |
| A | 0 | 12 | 0 |
| B | 0 | 12 | 0 |
| C | 0 | 12 | 0 |
| D | 0 | 12 | 0 |
| Quadrant | Total seconds | Saturated seconds | Saturation percentage |
|---|---|---|---|
| A | 19077 | 1440 | 7.548357% |
| B | 19077 | 1108 | 5.808041% |
| C | 19077 | 2926 | 15.337841% |
| D | 19078 | 2673 | 14.010903% |
Noise dominated data is calculated using 1-second bins in cleaned event files. If a bin has >2000 counts, and if more than 50% of those come from <1% of pixels, then it is considered to be noise-dominated and hence unusable.
| Quadrant | # 1 sec bins | Bins with >0 counts | Bins with >2000 counts | High rate bins dominated by noise | Noise dominated (total time) | Noise dominated (detector-on time) | Marked lightcurve |
|---|---|---|---|---|---|---|---|
| A | 20277 | 19082 | 735 | 735 | 3.62% | 3.85% | 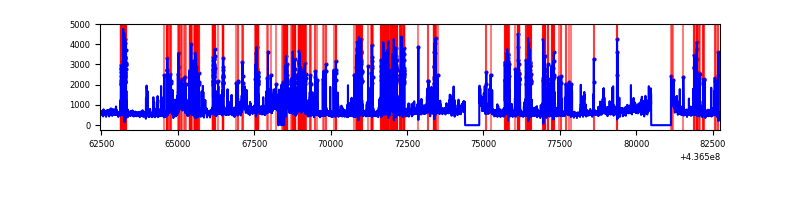 |
| B | 20277 | 19082 | 534 | 534 | 2.63% | 2.80% | 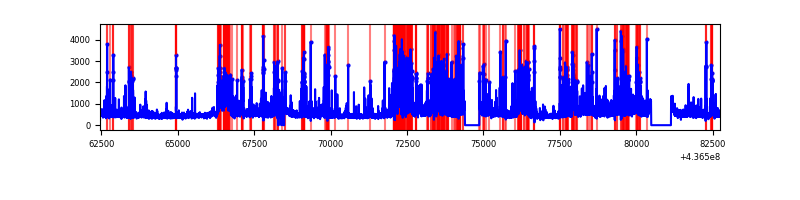 |
| C | 20277 | 19082 | 2388 | 2388 | 11.78% | 12.51% | 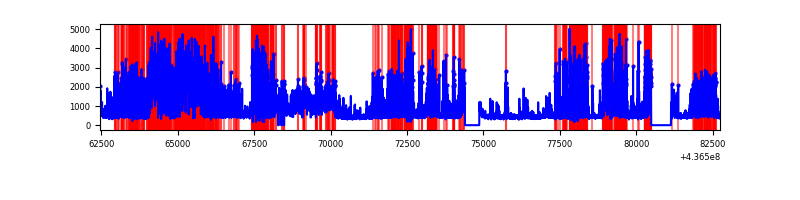 |
| D | 20278 | 19083 | 1959 | 1959 | 9.66% | 10.27% | 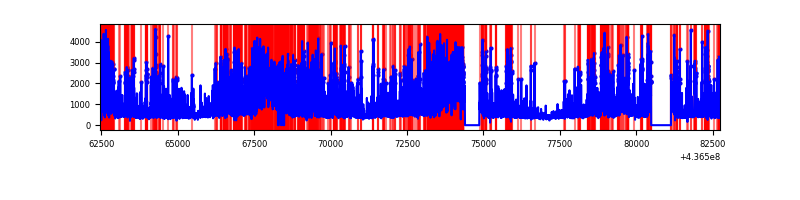 |
Top three noisy pixels from each quadrant. If the there are fewer than three noisy pixels in the level2.evt file, extra rows are filled as -1
| Pixel properties | Quadrant properties | ||||||
|---|---|---|---|---|---|---|---|
| Quadrant | DetID | PixID | Counts | Sigma | Mean | Median | Sigma |
| A | 10 | 83 | 2584696 | 5844.31 | 2113 | 2070 | 441.9 |
| A | 13 | 248 | 1961030 | 4433.0 | 2113 | 2070 | 441.9 |
| A | 15 | 223 | 1437218 | 3247.65 | 2113 | 2070 | 441.9 |
| B | 0 | 200 | 1874512 | 4474.97 | 2138 | 2075 | 418.4 |
| B | 5 | 235 | 913562 | 2178.38 | 2138 | 2075 | 418.4 |
| B | 5 | 172 | 326788 | 776.04 | 2138 | 2075 | 418.4 |
| C | 15 | 174 | 6702046 | 14409.44 | 1982 | 1997 | 465.0 |
| C | 15 | 158 | 2722425 | 5850.68 | 1982 | 1997 | 465.0 |
| C | 3 | 233 | 597676 | 1281.09 | 1982 | 1997 | 465.0 |
| D | 5 | 235 | 3616404 | 7020.64 | 2003 | 1941 | 514.8 |
| D | 5 | 222 | 1452261 | 2817.06 | 2003 | 1941 | 514.8 |
| D | 1 | 52 | 1161339 | 2251.98 | 2003 | 1941 | 514.8 |
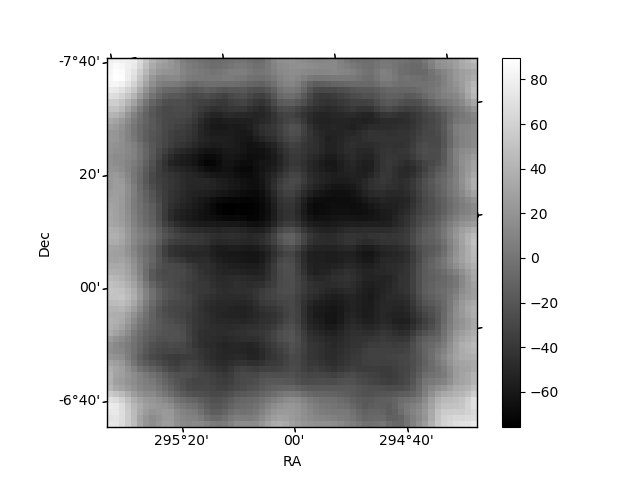
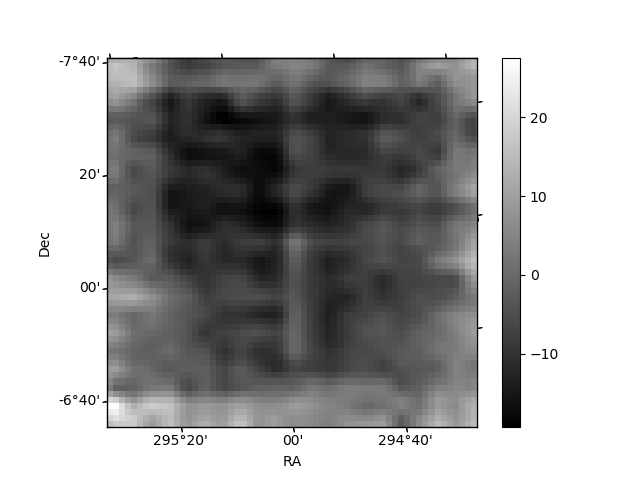
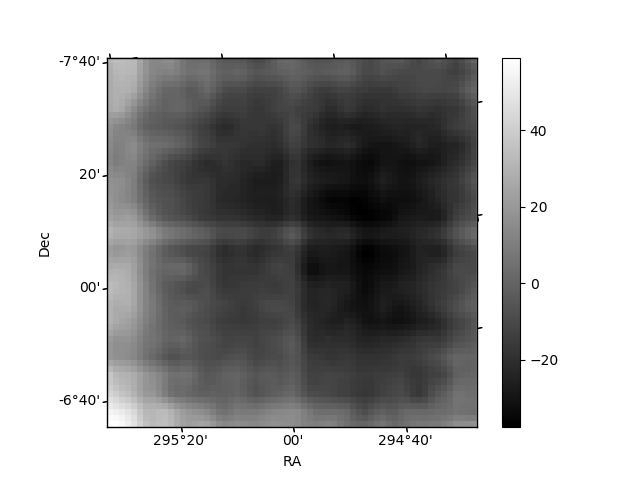
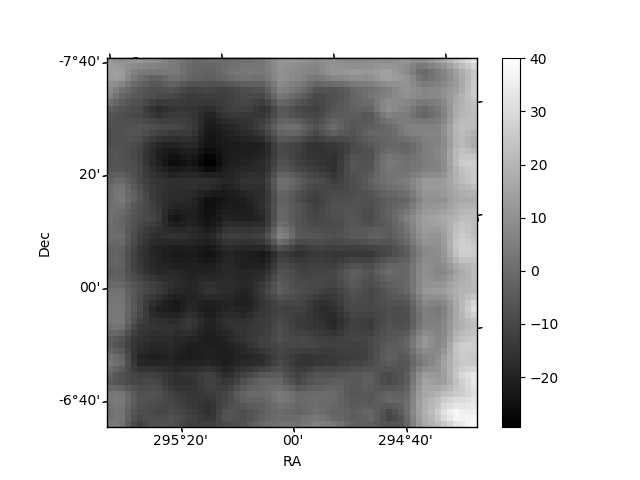
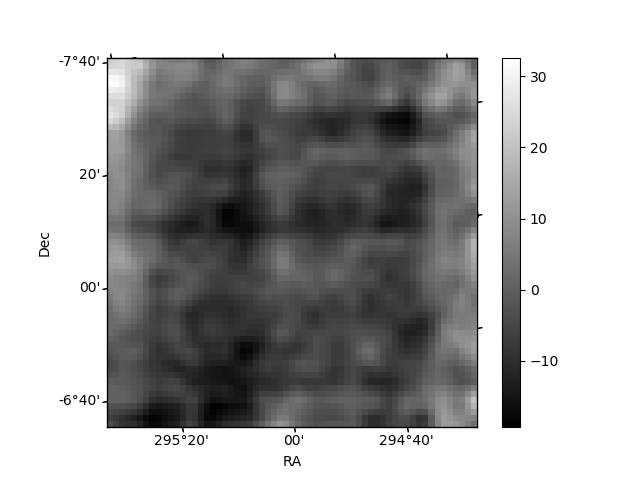
Histogram calculated using DETX and DETY for each event in the final _common_clean file
| Quadrant A | 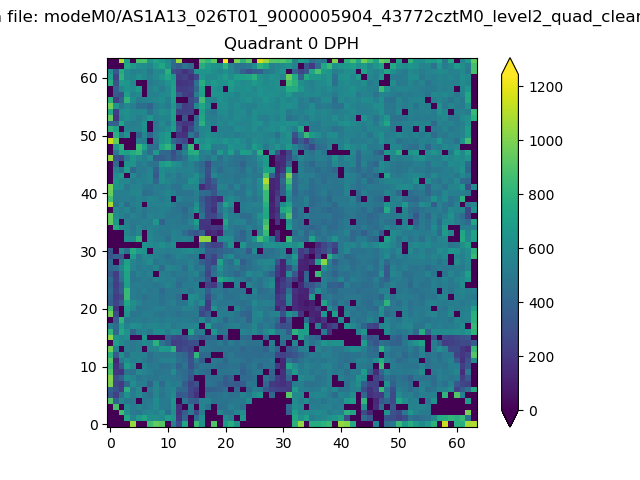 |
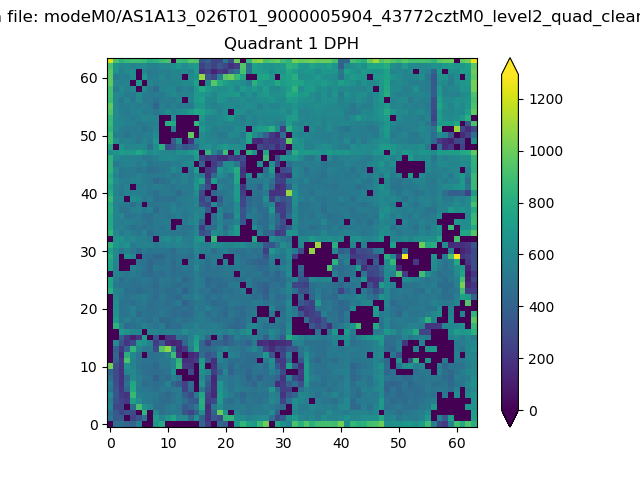 |
Quadrant B |
|---|---|---|---|
| Quadrant D | 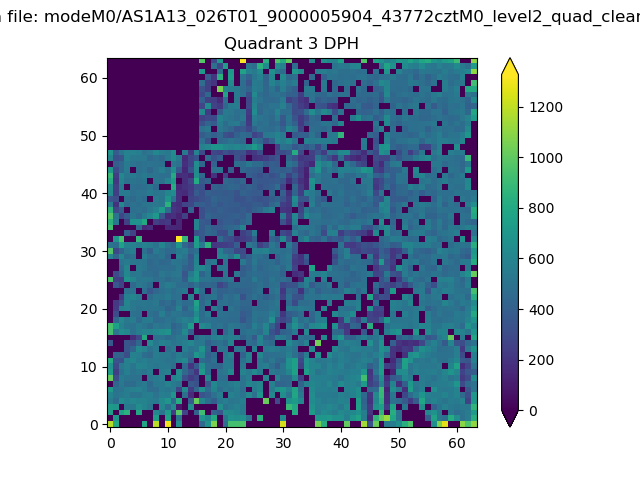 |
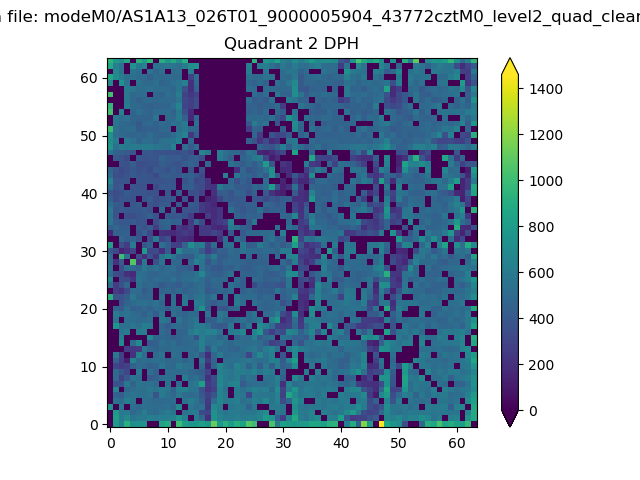 |
Quadrant C |
| Plot type | Count rate plots | Images |
|---|---|---|
| Comparison with Poisson distribution Blue bars denote a histogram of data divided into 1 sec bins. Red curve is a Poisson curve with rate = median count rate of data. |
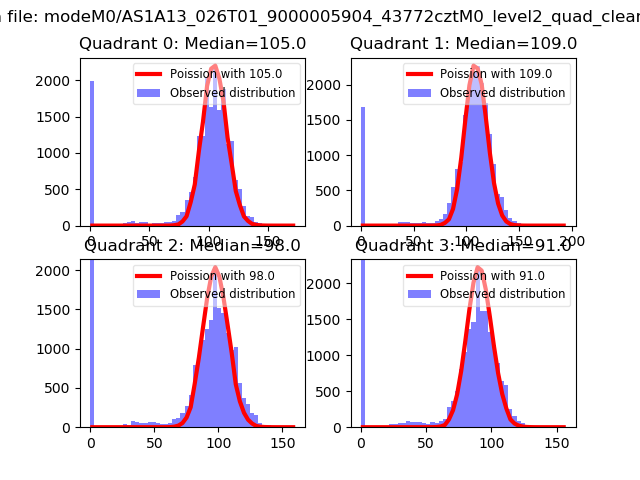 |
 |
| Quadrant-wise count rates Data is divided into 100 sec bins |
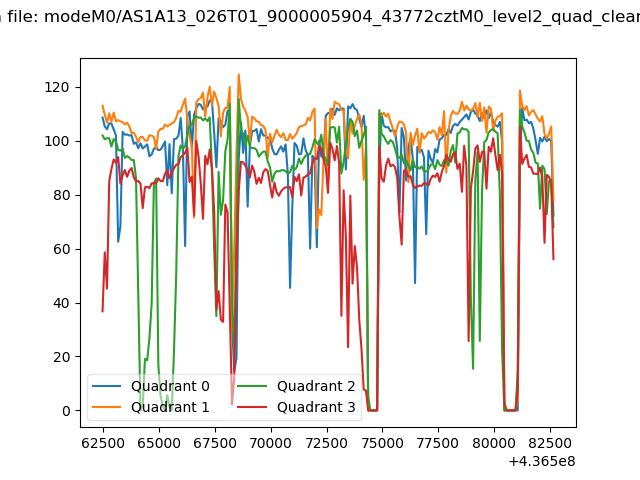 |
|
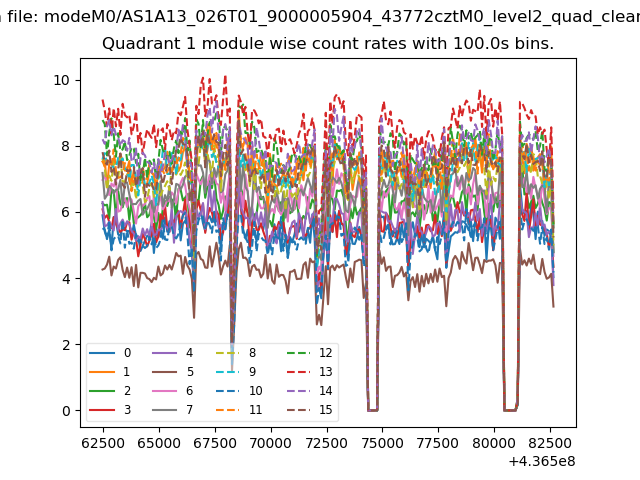
| Module-wise count rates for Quadrant A Data is divided into 100 sec bins |
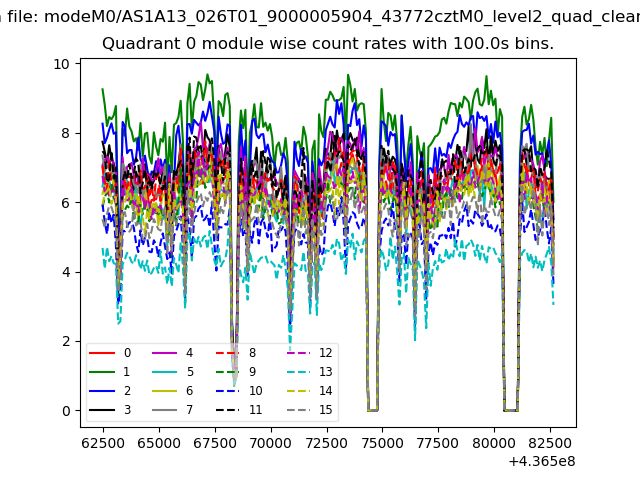 |
 |
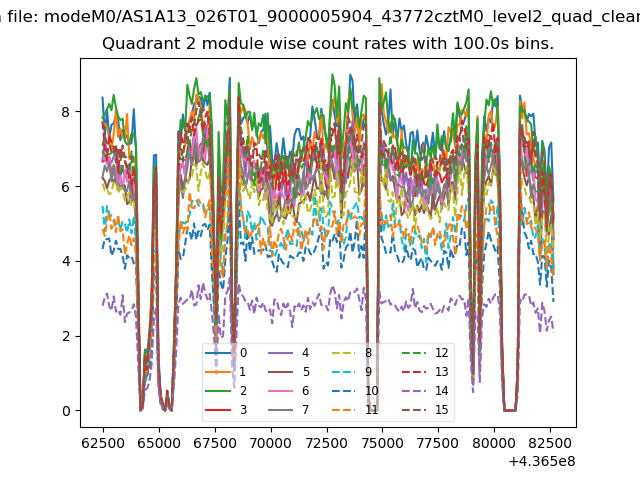
| Module-wise count rates for Quadrant B Data is divided into 100 sec bins |
 |
 |
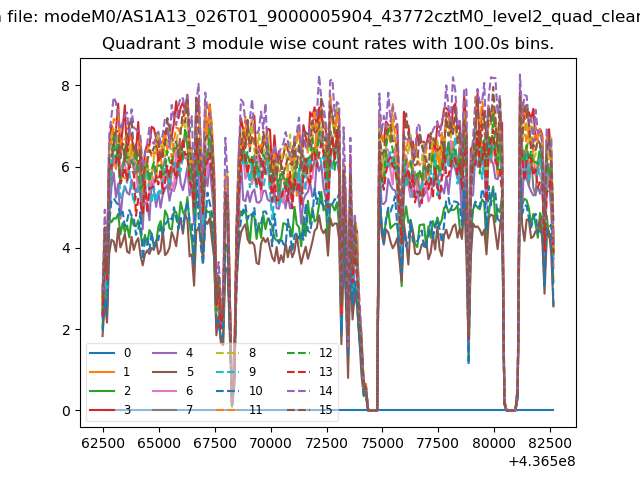
| Module-wise count rates for Quadrant C Data is divided into 100 sec bins |
 |
 |
| Module-wise count rates for Quadrant D Data is divided into 100 sec bins |
 |
 |
| Parameter | Plot |
|---|---|
| CZT HV Monitor | 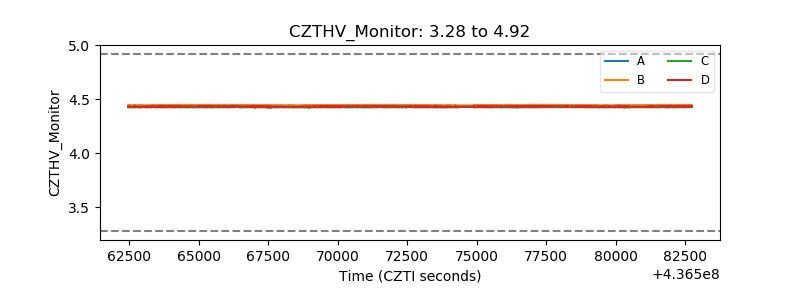 |
| D_VDD | 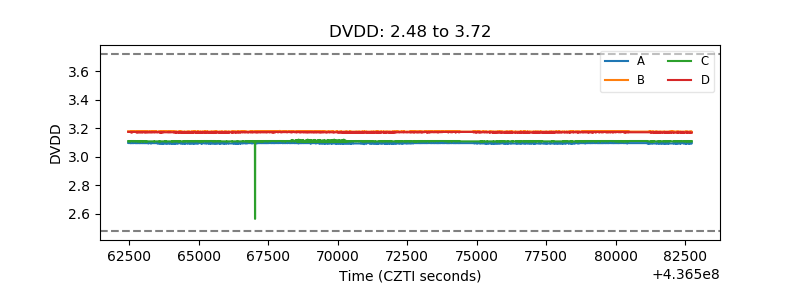 |
| Temperature 1 | 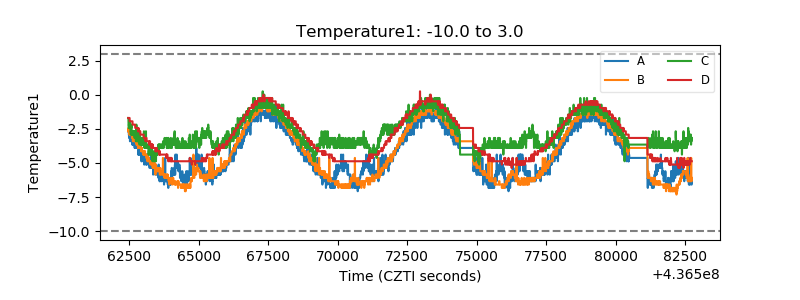 |
| Veto HV Monitor | 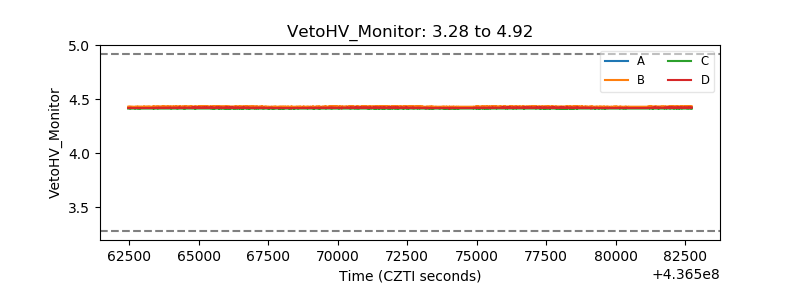 |
| Veto LLD | 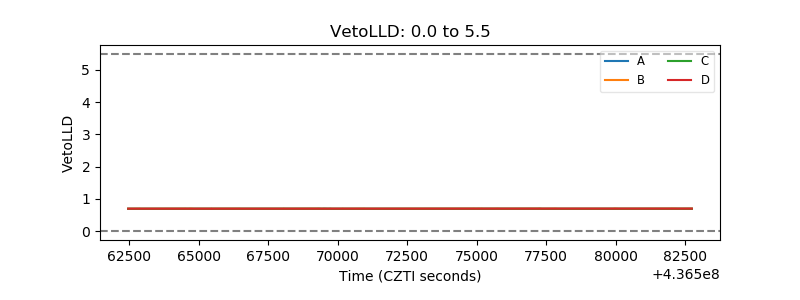 |
| Alpha Counter | 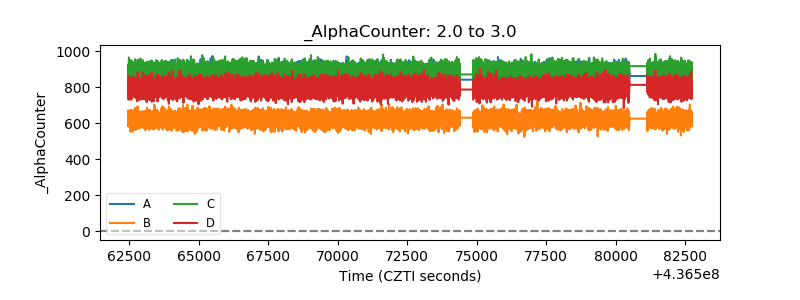 |
| _CPM_Rate | 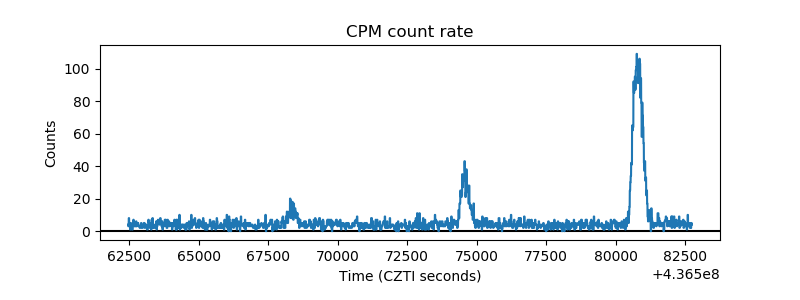 |
| CZT Counter | 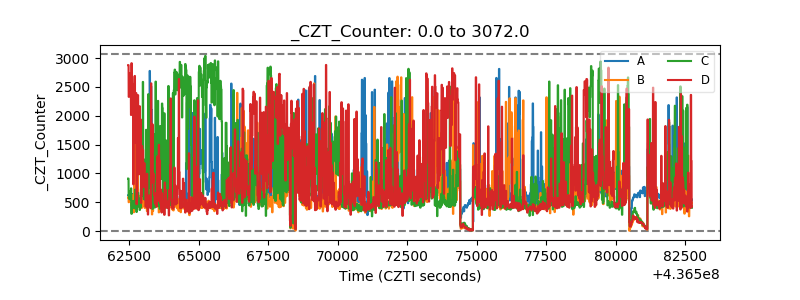 |
| +2.5 Volts monitor | 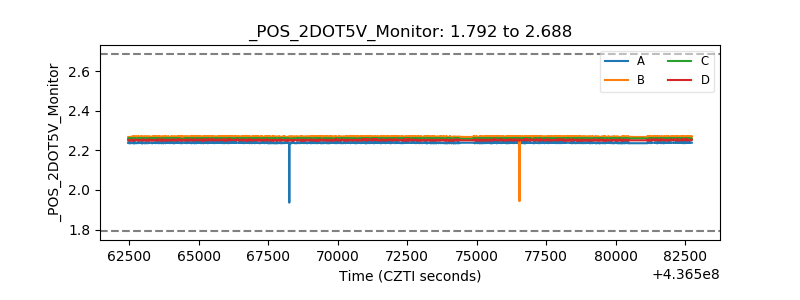 |
| +5 Volts monitor | 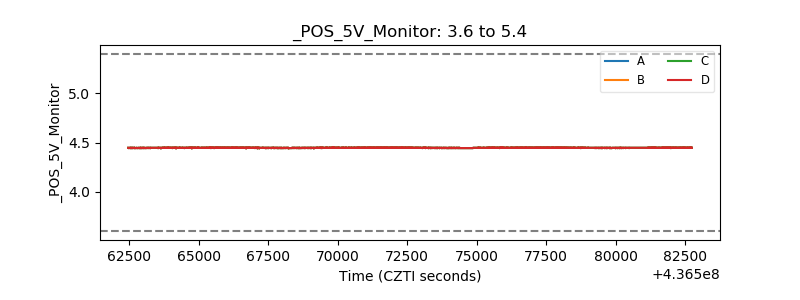 |
| _ROLL_ROT | 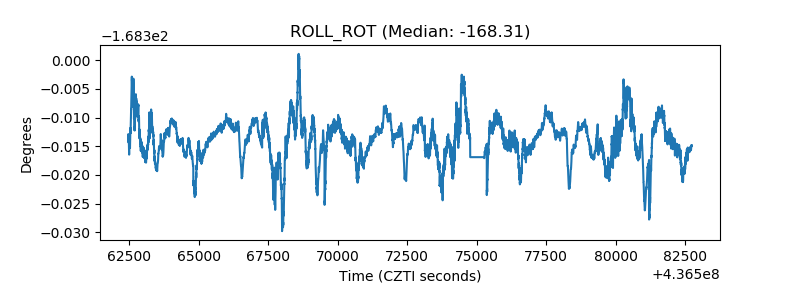 |
| _Roll_DEC | 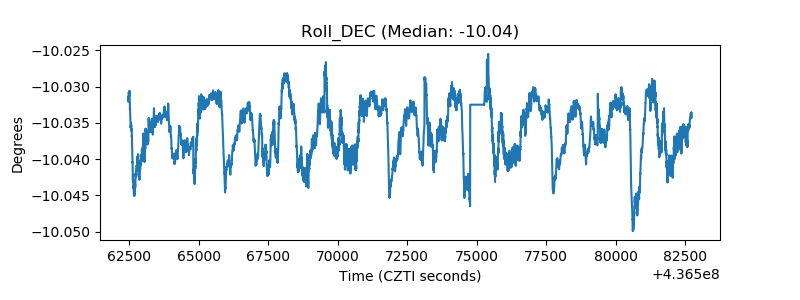 |
| _Roll_RA | 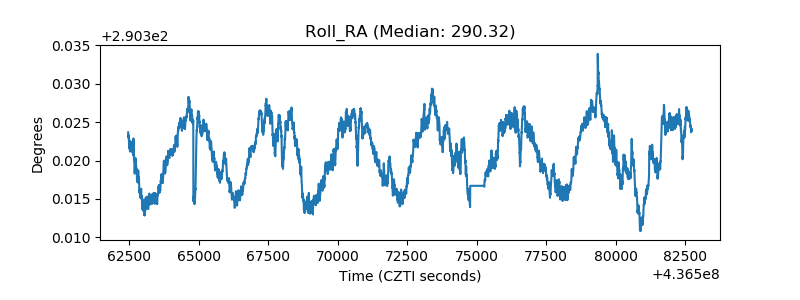 |
| Veto Counter | 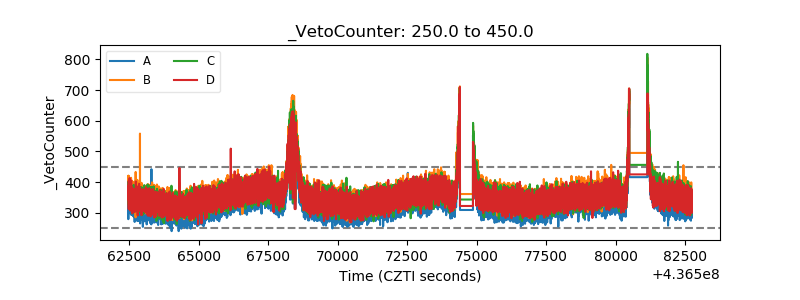 |