| Param | Original file | Final file |
|---|---|---|
| Filename | modeM0/AS1A13_026T01_9000005904_43773cztM0_level2.fits | modeM0/AS1A13_026T01_9000005904_43773cztM0_level2_quad_clean.evt |
| Size (bytes) | 677,289,600 | 97,591,680 |
| Size | 645.9 MB | 93.1 MB |
| Events in quadrant A | 5,273,094 | 686,214 |
| Events in quadrant B | 5,634,339 | 674,818 |
| Events in quadrant C | 6,540,463 | 620,946 |
| Events in quadrant D | 7,109,231 | 509,513 |
| Mode M0 | |||
|---|---|---|---|
| Quadrant | BADHDUFLAG | Total packets | Discarded packets |
| A | 0 | 20437 | 1 |
| B | 0 | 21238 | 1 |
| C | 0 | 23970 | 1 |
| D | 0 | 25655 | 2 |
| Mode SS | |||
|---|---|---|---|
| Quadrant | BADHDUFLAG | Total packets | Discarded packets |
| A | 0 | 136 | 0 |
| B | 0 | 136 | 0 |
| C | 0 | 136 | 0 |
| D | 0 | 136 | 0 |
| Mode M9 | |||
|---|---|---|---|
| Quadrant | BADHDUFLAG | Total packets | Discarded packets |
| A | 0 | 9 | 0 |
| B | 0 | 9 | 0 |
| C | 0 | 9 | 0 |
| D | 0 | 9 | 0 |
| Quadrant | Total seconds | Saturated seconds | Saturation percentage |
|---|---|---|---|
| A | 6636 | 329 | 4.957806% |
| B | 6636 | 725 | 10.925256% |
| C | 6636 | 983 | 14.813140% |
| D | 6635 | 1429 | 21.537302% |
Noise dominated data is calculated using 1-second bins in cleaned event files. If a bin has >2000 counts, and if more than 50% of those come from <1% of pixels, then it is considered to be noise-dominated and hence unusable.
| Quadrant | # 1 sec bins | Bins with >0 counts | Bins with >2000 counts | High rate bins dominated by noise | Noise dominated (total time) | Noise dominated (detector-on time) | Marked lightcurve |
|---|---|---|---|---|---|---|---|
| A | 7531 | 6637 | 202 | 202 | 2.68% | 3.04% | 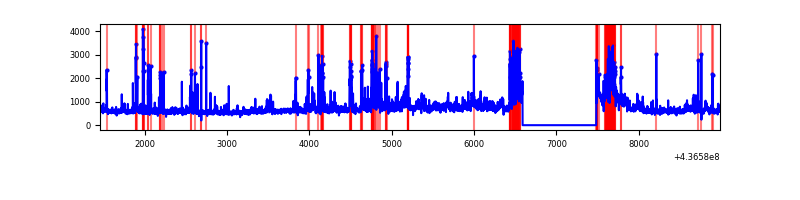 |
| B | 7531 | 6637 | 485 | 485 | 6.44% | 7.31% | 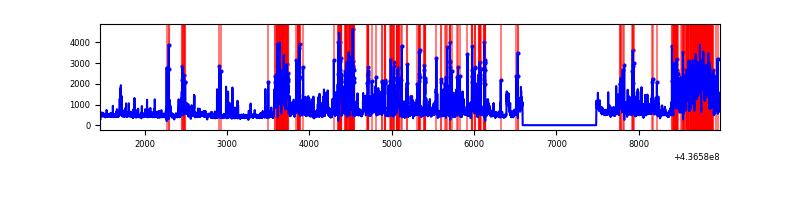 |
| C | 7531 | 6637 | 863 | 863 | 11.46% | 13.00% | 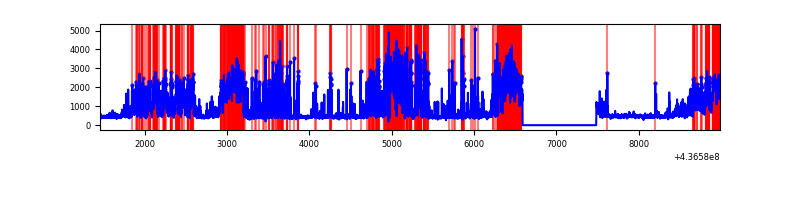 |
| D | 7530 | 6636 | 1221 | 1221 | 16.22% | 18.40% | 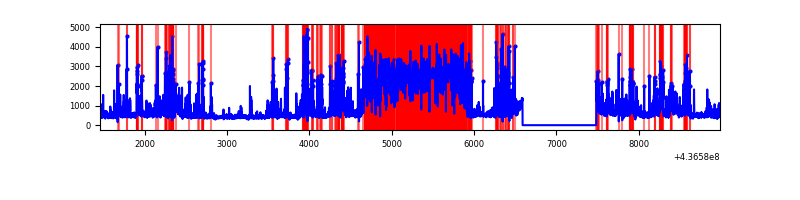 |
Top three noisy pixels from each quadrant. If the there are fewer than three noisy pixels in the level2.evt file, extra rows are filled as -1
| Pixel properties | Quadrant properties | ||||||
|---|---|---|---|---|---|---|---|
| Quadrant | DetID | PixID | Counts | Sigma | Mean | Median | Sigma |
| A | 10 | 83 | 954049 | 6246.55 | 733 | 719 | 152.6 |
| A | 14 | 63 | 526255 | 3443.5 | 733 | 719 | 152.6 |
| A | 15 | 223 | 380169 | 2486.29 | 733 | 719 | 152.6 |
| B | 0 | 200 | 1306047 | 9234.74 | 722 | 702 | 141.4 |
| B | 3 | 96 | 388381 | 2742.66 | 722 | 702 | 141.4 |
| B | 7 | 205 | 372698 | 2631.71 | 722 | 702 | 141.4 |
| C | 15 | 174 | 2822013 | 17169.54 | 696 | 699 | 164.3 |
| C | 15 | 158 | 435929 | 2648.66 | 696 | 699 | 164.3 |
| C | 14 | 254 | 231387 | 1403.89 | 696 | 699 | 164.3 |
| D | 5 | 235 | 1749541 | 10492.65 | 651 | 629 | 166.7 |
| D | 12 | 33 | 1708223 | 10244.76 | 651 | 629 | 166.7 |
| D | 13 | 249 | 226956 | 1357.86 | 651 | 629 | 166.7 |
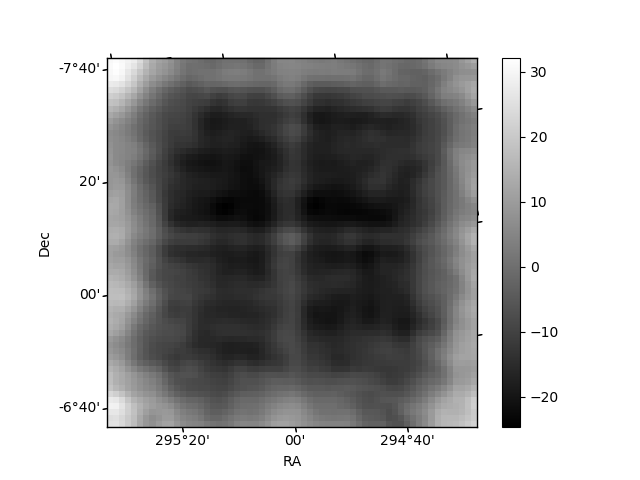
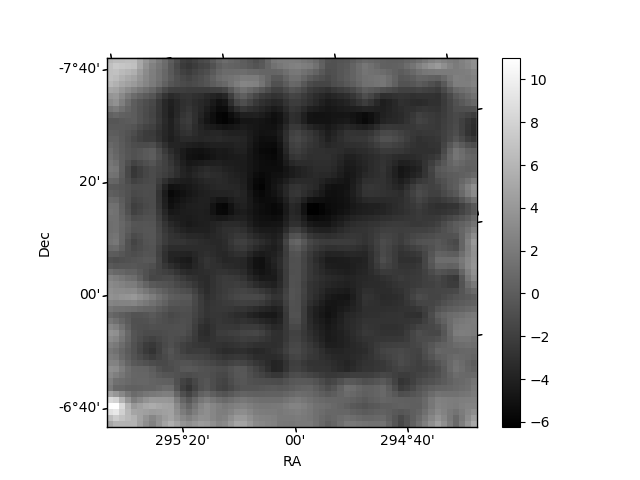
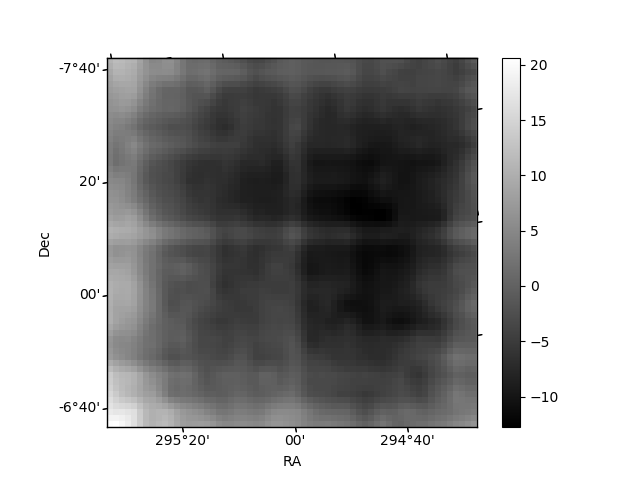
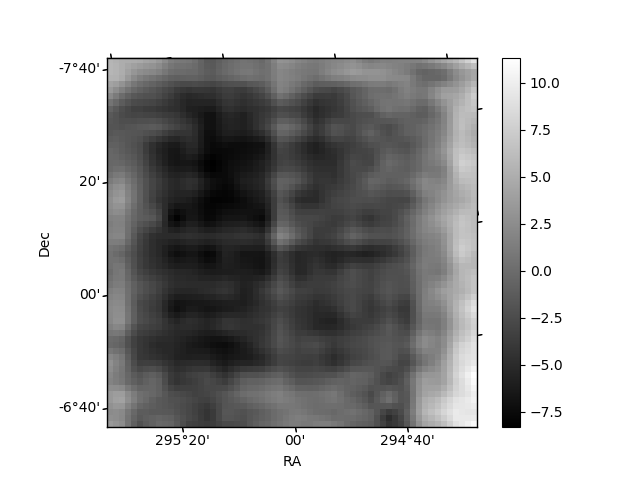
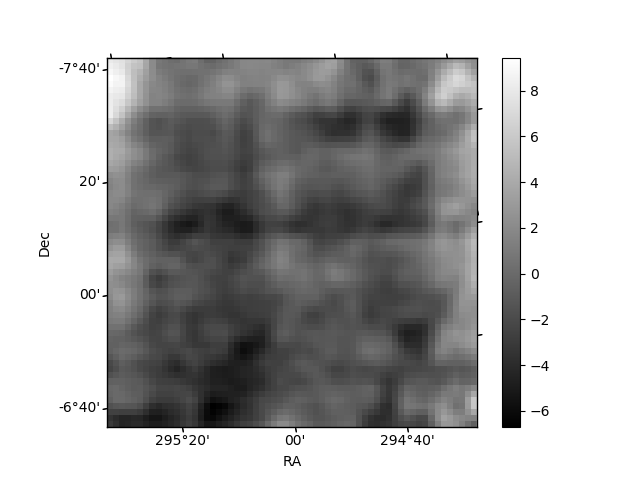
Histogram calculated using DETX and DETY for each event in the final _common_clean file
| Quadrant A | 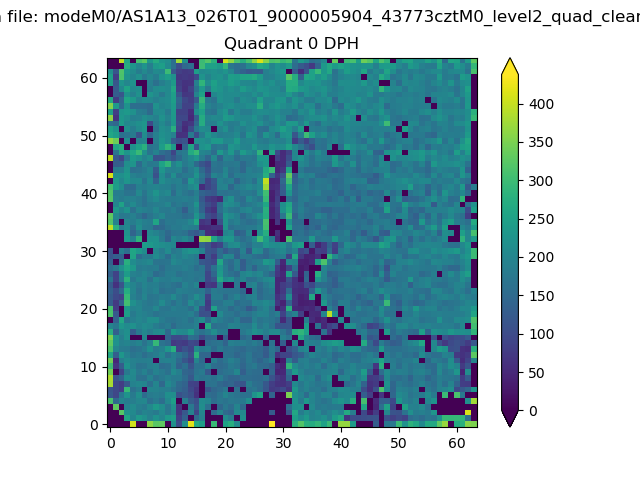 |
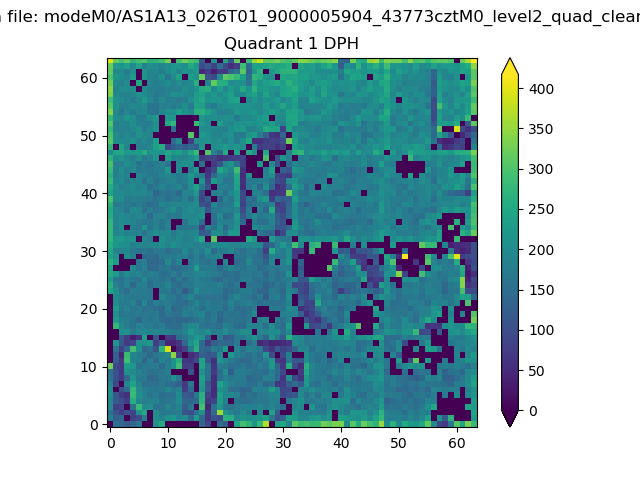 |
Quadrant B |
|---|---|---|---|
| Quadrant D | 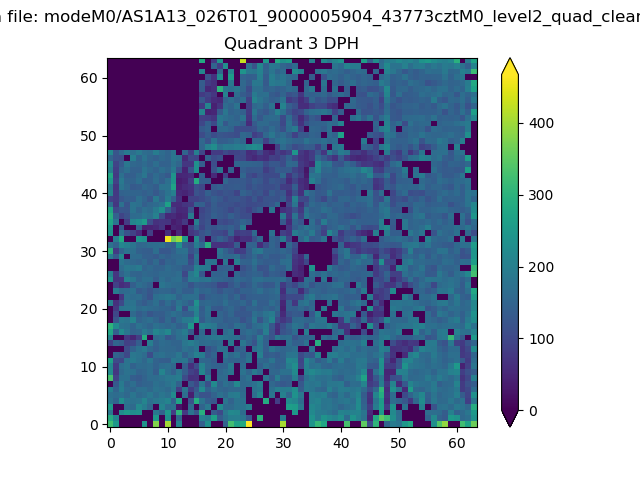 |
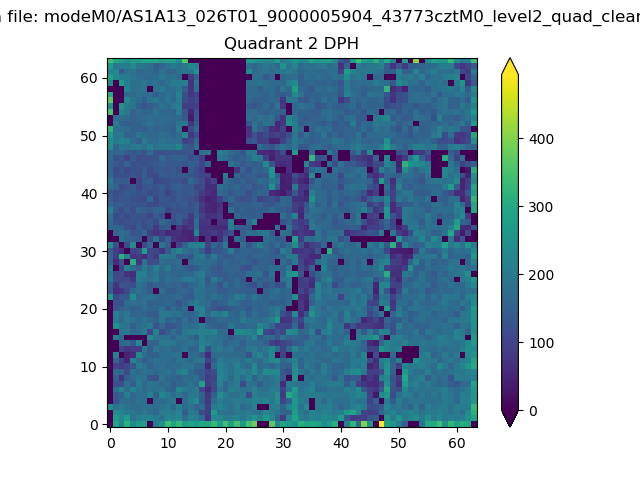 |
Quadrant C |
| Plot type | Count rate plots | Images |
|---|---|---|
| Comparison with Poisson distribution Blue bars denote a histogram of data divided into 1 sec bins. Red curve is a Poisson curve with rate = median count rate of data. |
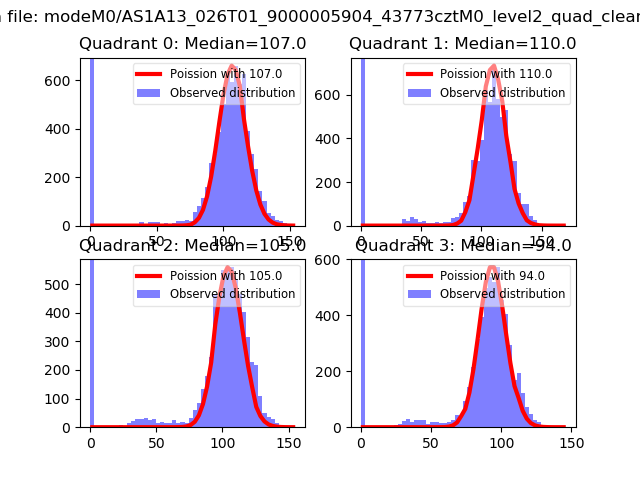 |
 |
| Quadrant-wise count rates Data is divided into 100 sec bins |
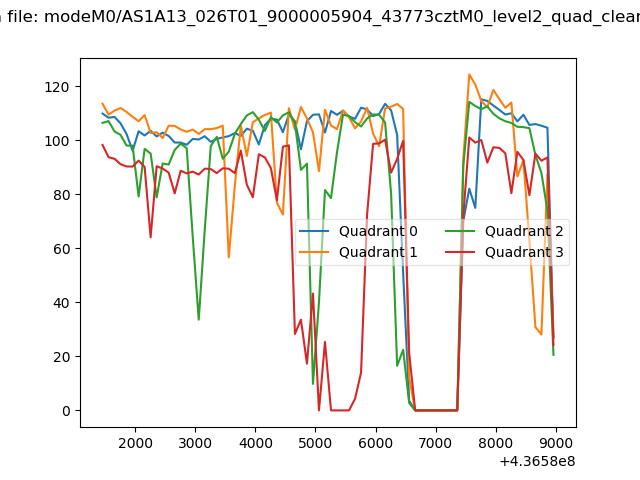 |
|
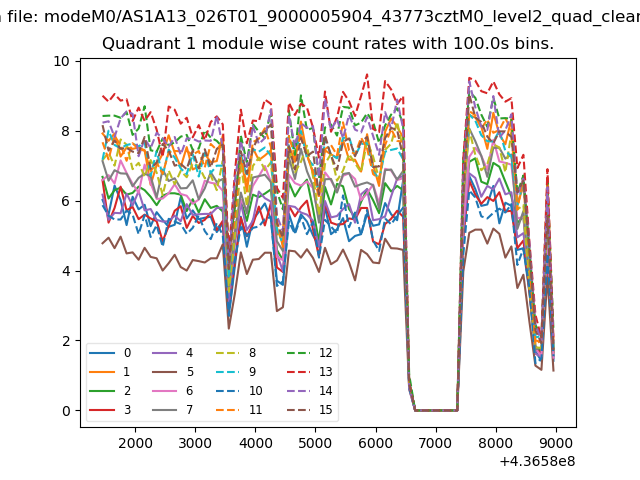
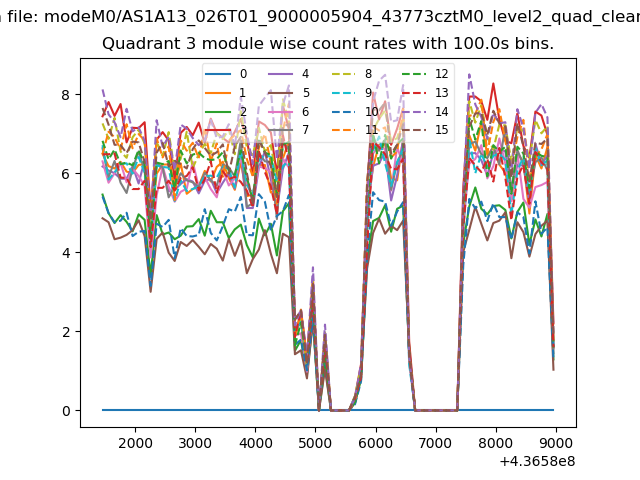
| Module-wise count rates for Quadrant A Data is divided into 100 sec bins |
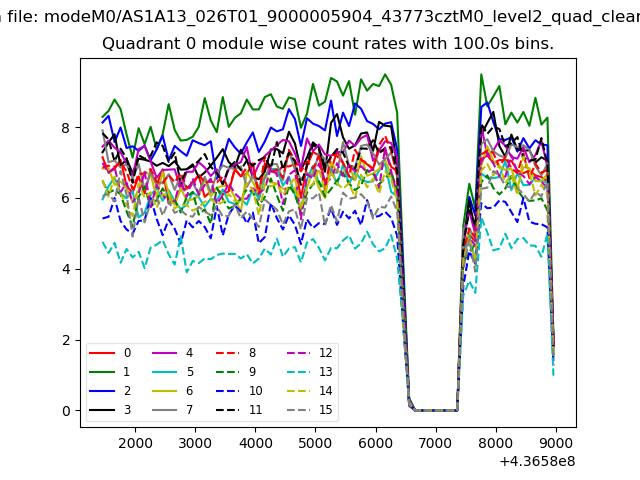 |
 |
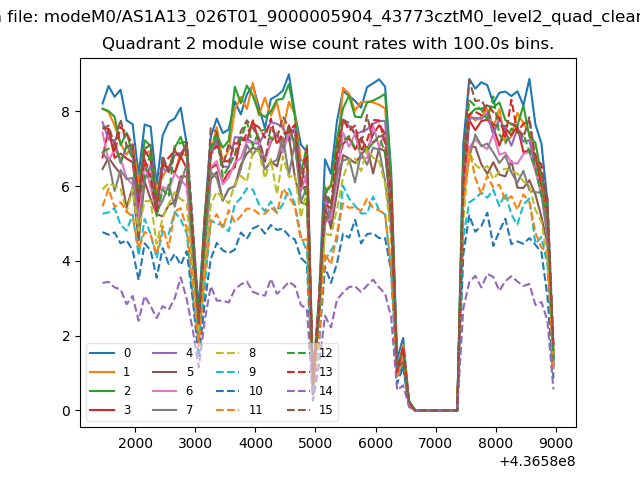
| Module-wise count rates for Quadrant B Data is divided into 100 sec bins |
 |
 |
| Module-wise count rates for Quadrant C Data is divided into 100 sec bins |
 |
 |
| Module-wise count rates for Quadrant D Data is divided into 100 sec bins |
 |
 |
| Parameter | Plot |
|---|---|
| CZT HV Monitor | 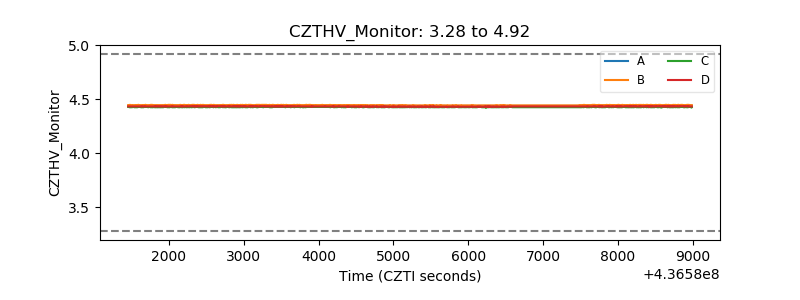 |
| D_VDD | 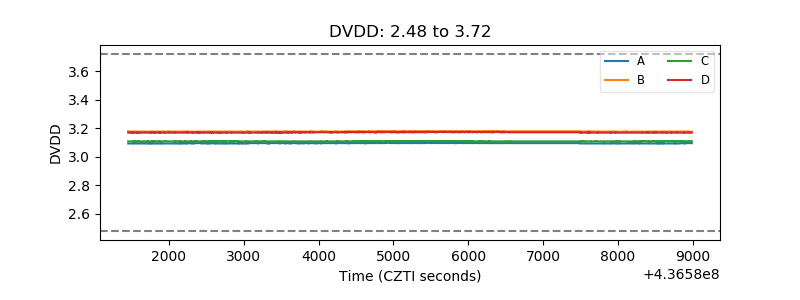 |
| Temperature 1 | 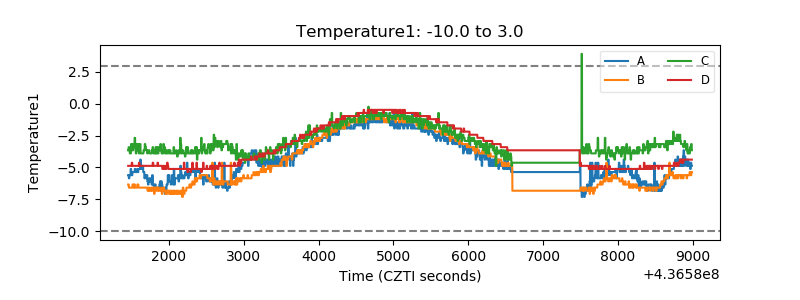 |
| Veto HV Monitor |  |
| Veto LLD | 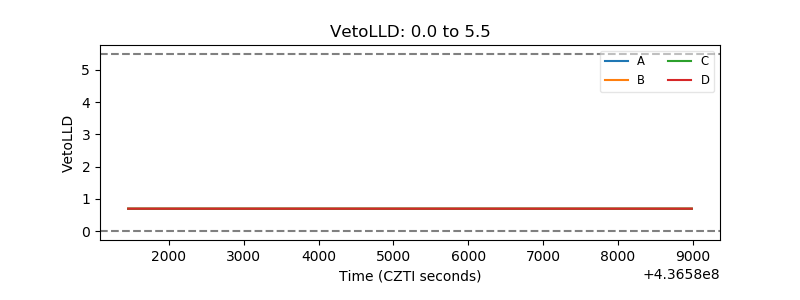 |
| Alpha Counter | 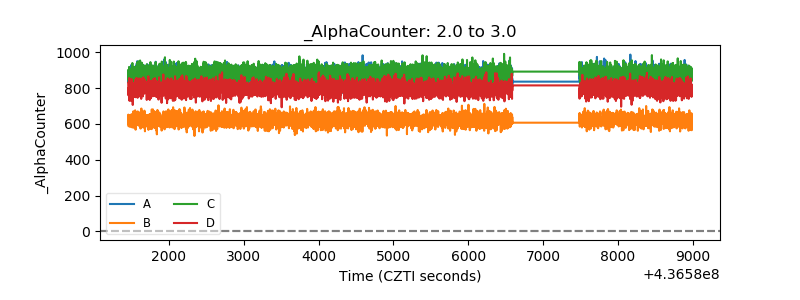 |
| _CPM_Rate | 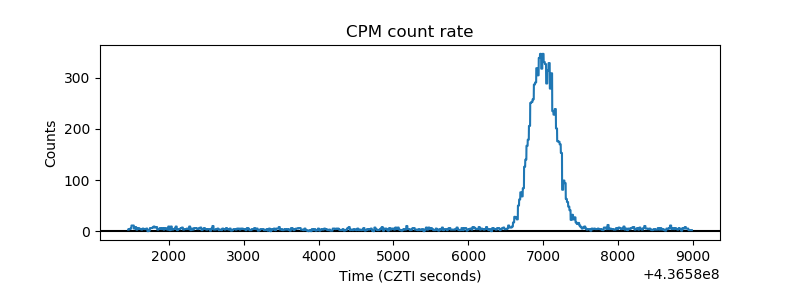 |
| CZT Counter | 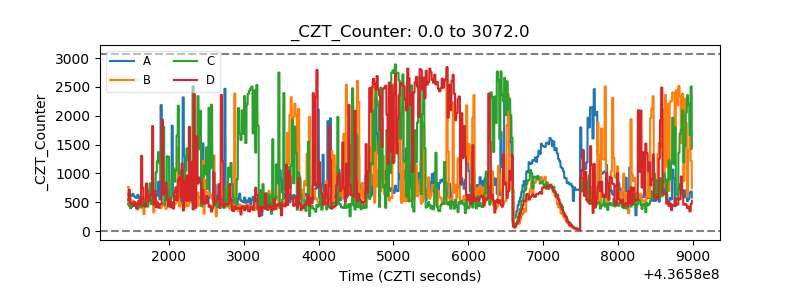 |
| +2.5 Volts monitor | 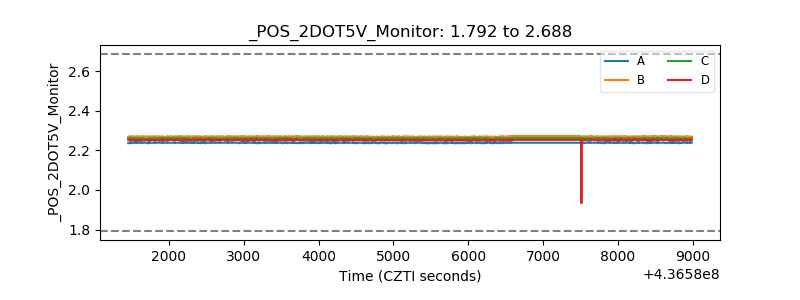 |
| +5 Volts monitor | 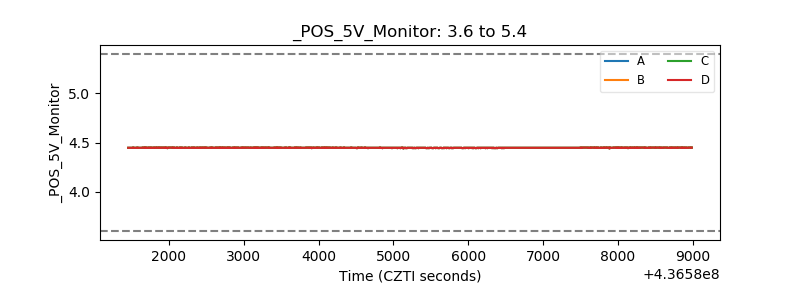 |
| _ROLL_ROT | 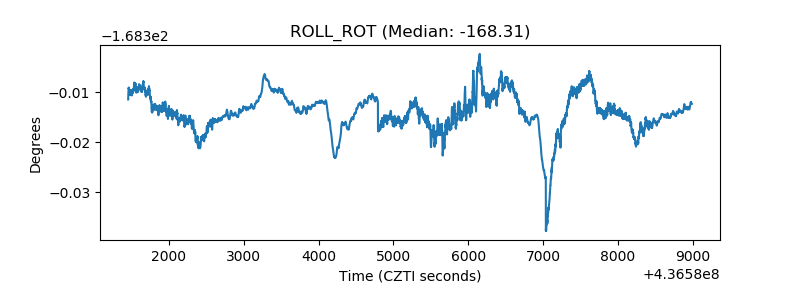 |
| _Roll_DEC | 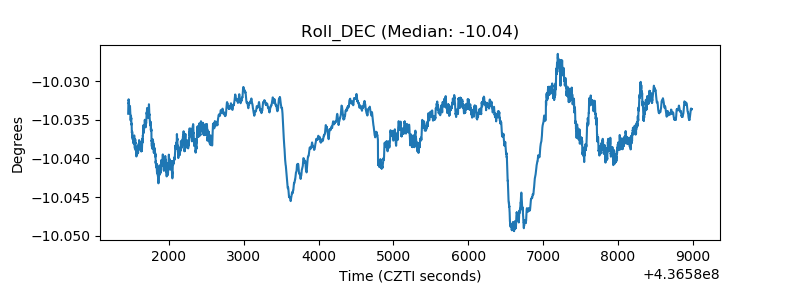 |
| _Roll_RA | 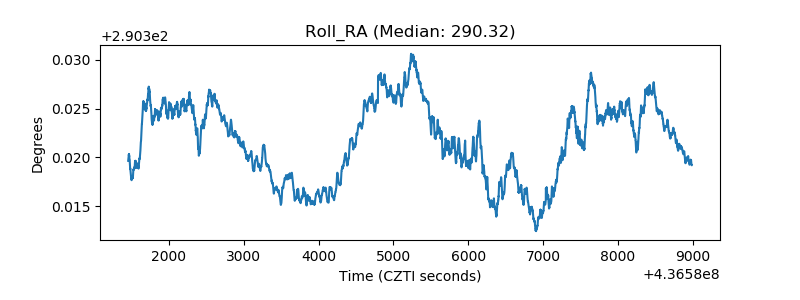 |
| Veto Counter | 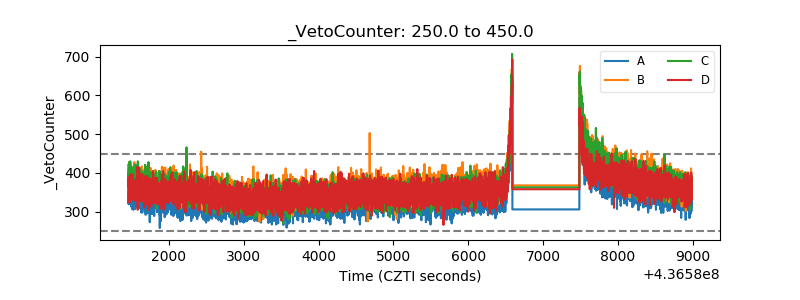 |