| Param | Original file | Final file |
|---|---|---|
| Filename | modeM0/AS1A13_026T01_9000005904_43774cztM0_level2.fits | modeM0/AS1A13_026T01_9000005904_43774cztM0_level2_quad_clean.evt |
| Size (bytes) | 705,510,720 | 91,774,080 |
| Size | 672.8 MB | 87.5 MB |
| Events in quadrant A | 4,862,207 | 660,422 |
| Events in quadrant B | 5,958,940 | 630,084 |
| Events in quadrant C | 7,949,878 | 527,578 |
| Events in quadrant D | 6,866,795 | 529,648 |
| Mode M0 | |||
|---|---|---|---|
| Quadrant | BADHDUFLAG | Total packets | Discarded packets |
| A | 0 | 18934 | 1 |
| B | 0 | 21862 | 1 |
| C | 0 | 27792 | 1 |
| D | 0 | 24580 | 1 |
| Mode SS | |||
|---|---|---|---|
| Quadrant | BADHDUFLAG | Total packets | Discarded packets |
| A | 0 | 140416161044520 | 140415365808174 |
| B | 0 | -1 | -1 |
| C | 0 | -1 | -1 |
| D | 0 | -1 | -1 |
| Mode M9 | |||
|---|---|---|---|
| Quadrant | BADHDUFLAG | Total packets | Discarded packets |
| A | 0 | 10 | 0 |
| B | 0 | 10 | 0 |
| C | 0 | 10 | 0 |
| D | 0 | 10 | 0 |
| Quadrant | Total seconds | Saturated seconds | Saturation percentage |
|---|---|---|---|
| A | 6175 | 361 | 5.846154% |
| B | 6175 | 997 | 16.145749% |
| C | 6175 | 1664 | 26.947368% |
| D | 6175 | 1058 | 17.133603% |
Noise dominated data is calculated using 1-second bins in cleaned event files. If a bin has >2000 counts, and if more than 50% of those come from <1% of pixels, then it is considered to be noise-dominated and hence unusable.
| Quadrant | # 1 sec bins | Bins with >0 counts | Bins with >2000 counts | High rate bins dominated by noise | Noise dominated (total time) | Noise dominated (detector-on time) | Marked lightcurve |
|---|---|---|---|---|---|---|---|
| A | 7180 | 6176 | 206 | 206 | 2.87% | 3.34% | 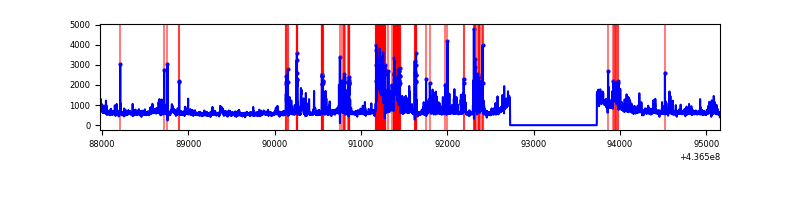 |
| B | 7180 | 6176 | 647 | 647 | 9.01% | 10.48% | 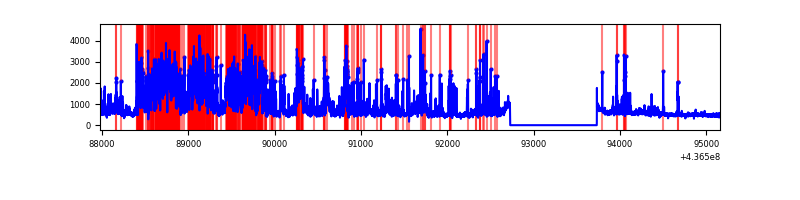 |
| C | 7180 | 6176 | 1500 | 1500 | 20.89% | 24.29% | 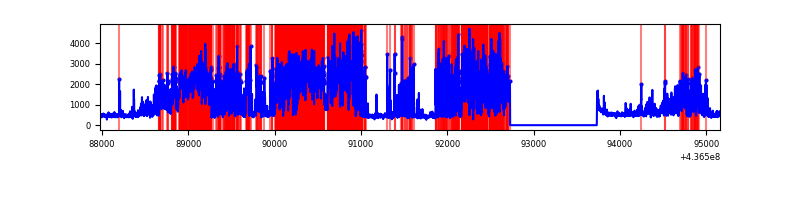 |
| D | 7180 | 6175 | 912 | 912 | 12.70% | 14.77% | 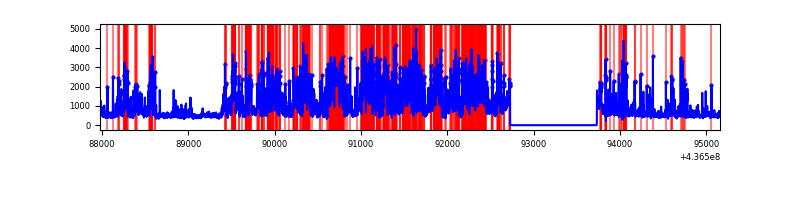 |
Top three noisy pixels from each quadrant. If the there are fewer than three noisy pixels in the level2.evt file, extra rows are filled as -1
| Pixel properties | Quadrant properties | ||||||
|---|---|---|---|---|---|---|---|
| Quadrant | DetID | PixID | Counts | Sigma | Mean | Median | Sigma |
| A | 10 | 83 | 894156 | 6089.71 | 704 | 690 | 146.7 |
| A | 15 | 223 | 791572 | 5390.52 | 704 | 690 | 146.7 |
| A | 14 | 63 | 147992 | 1003.99 | 704 | 690 | 146.7 |
| B | 0 | 200 | 1574884 | 11654.65 | 686 | 667 | 135.1 |
| B | 3 | 96 | 607022 | 4489.12 | 686 | 667 | 135.1 |
| B | 5 | 235 | 485966 | 3592.89 | 686 | 667 | 135.1 |
| C | 15 | 174 | 4418963 | 29220.89 | 641 | 646 | 151.2 |
| C | 15 | 158 | 589469 | 3894.23 | 641 | 646 | 151.2 |
| C | 14 | 96 | 119295 | 784.69 | 641 | 646 | 151.2 |
| D | 12 | 33 | 1480846 | 8724.6 | 658 | 636 | 169.7 |
| D | 5 | 235 | 1052084 | 6197.41 | 658 | 636 | 169.7 |
| D | 4 | 233 | 650881 | 3832.65 | 658 | 636 | 169.7 |
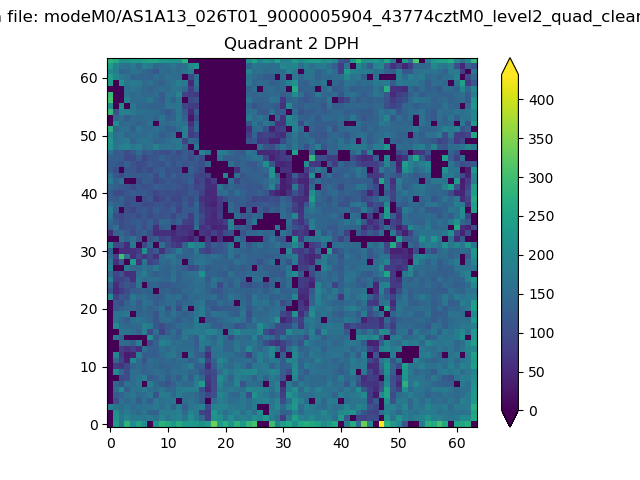
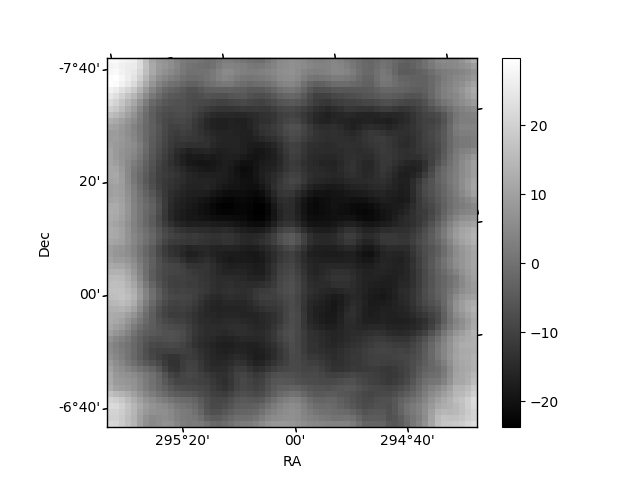
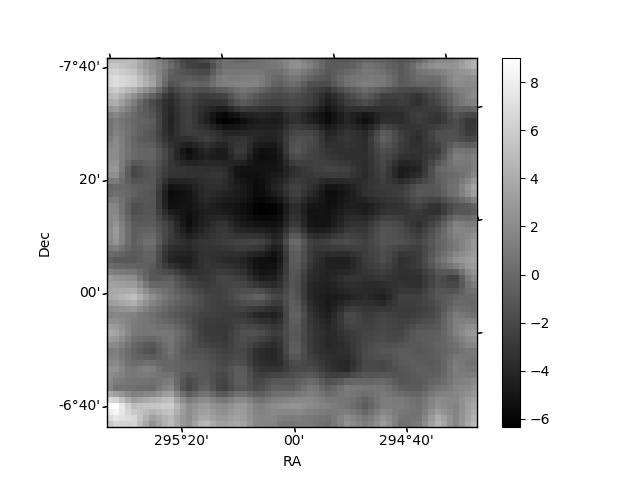
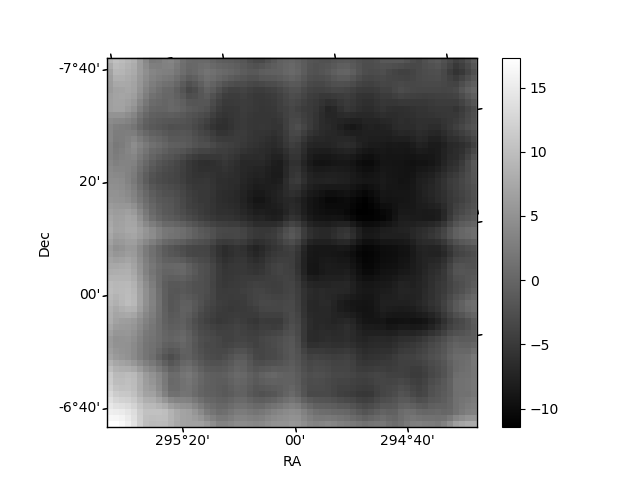
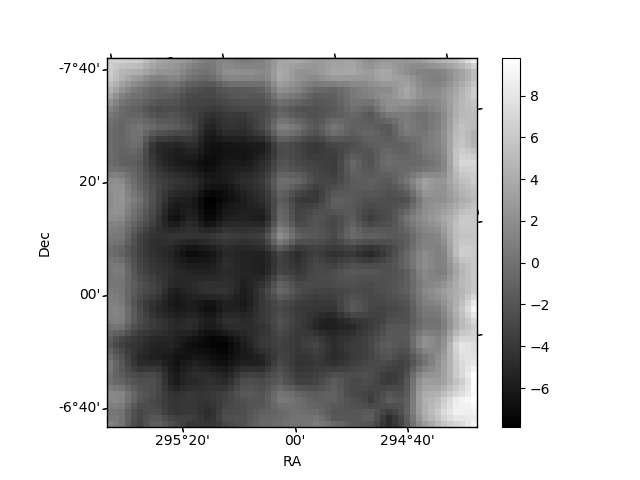
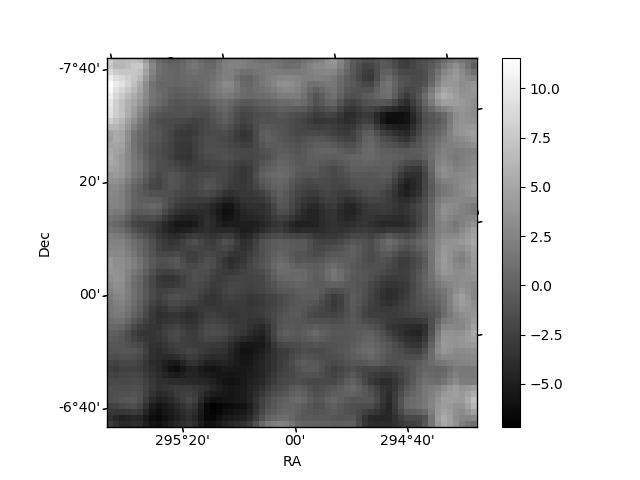
Histogram calculated using DETX and DETY for each event in the final _common_clean file
| Quadrant A | 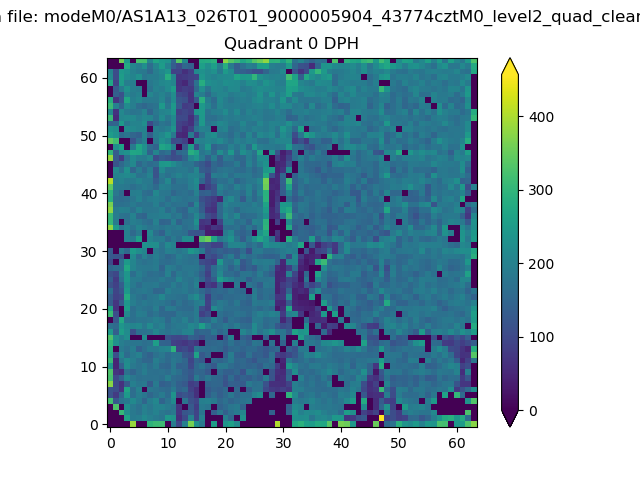 |
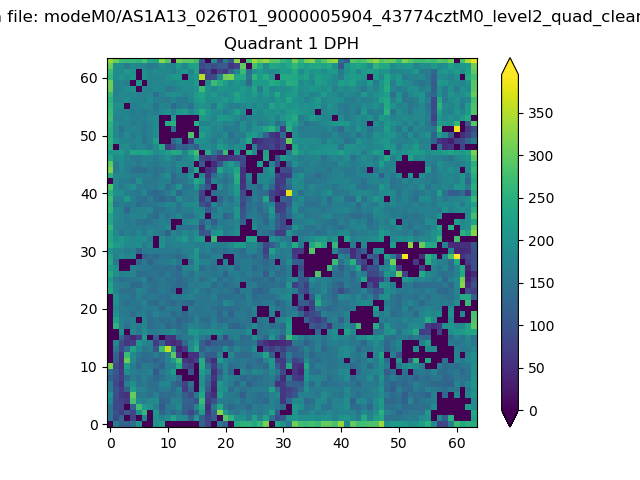 |
Quadrant B |
|---|---|---|---|
| Quadrant D | 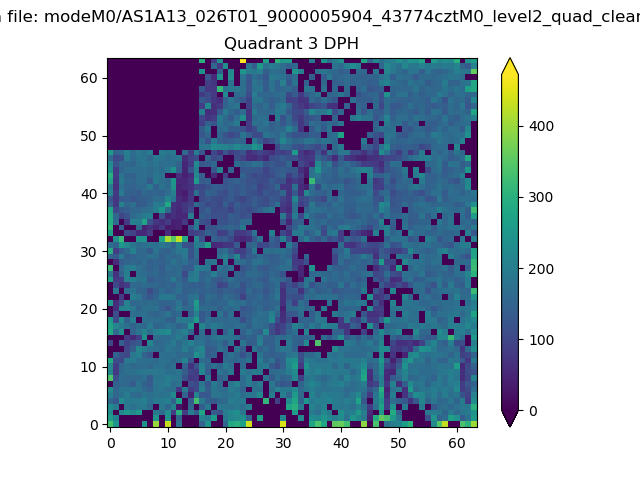 |
 |
Quadrant C |
| Plot type | Count rate plots | Images |
|---|---|---|
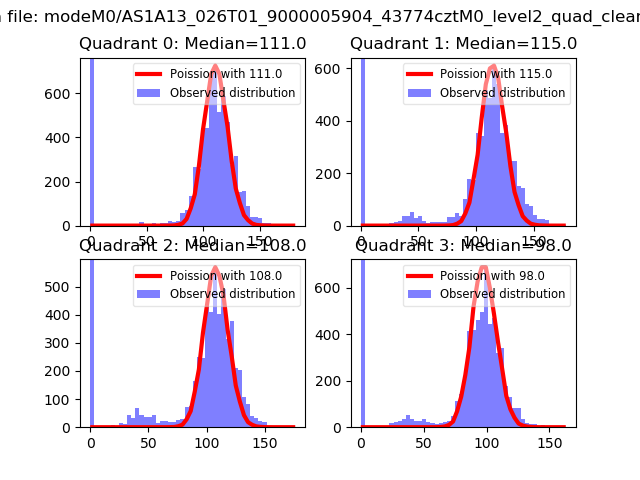
| Comparison with Poisson distribution Blue bars denote a histogram of data divided into 1 sec bins. Red curve is a Poisson curve with rate = median count rate of data. |
 |
 |
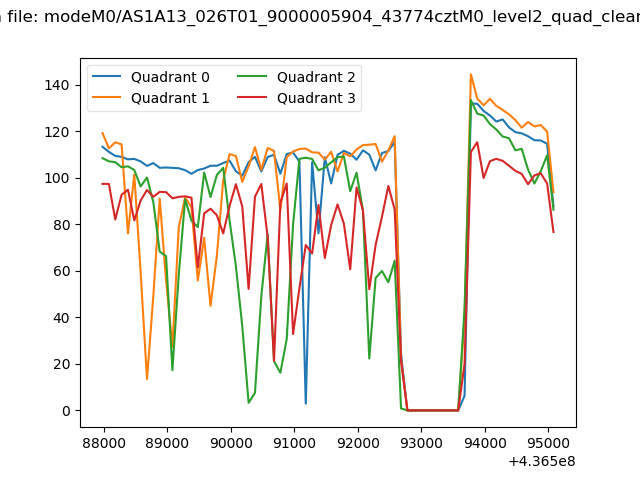
| Quadrant-wise count rates Data is divided into 100 sec bins |
 |
|
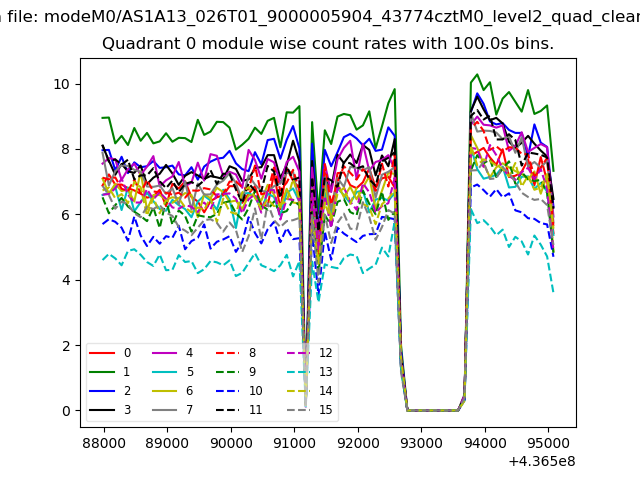
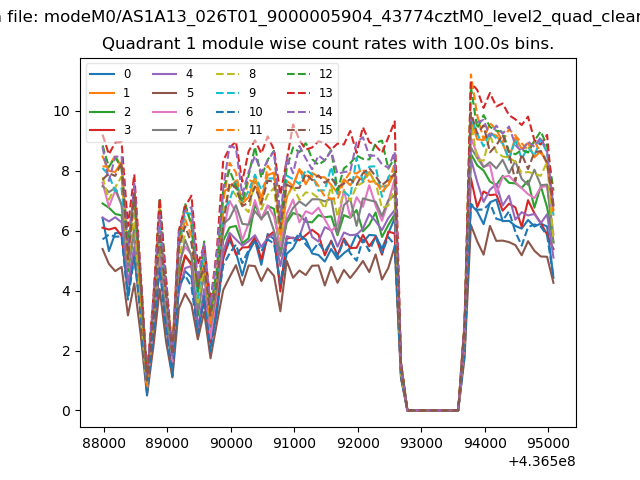
| Module-wise count rates for Quadrant A Data is divided into 100 sec bins |
 |
 |
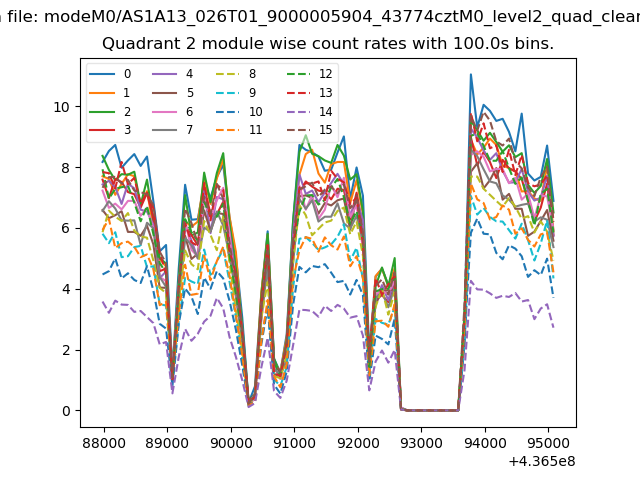
| Module-wise count rates for Quadrant B Data is divided into 100 sec bins |
 |
 |
| Module-wise count rates for Quadrant C Data is divided into 100 sec bins |
 |
 |
| Module-wise count rates for Quadrant D Data is divided into 100 sec bins |
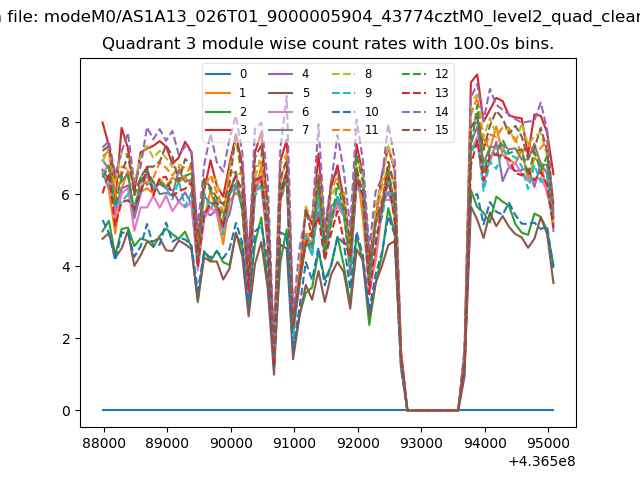 |
 |
| Parameter | Plot |
|---|---|
| CZT HV Monitor | 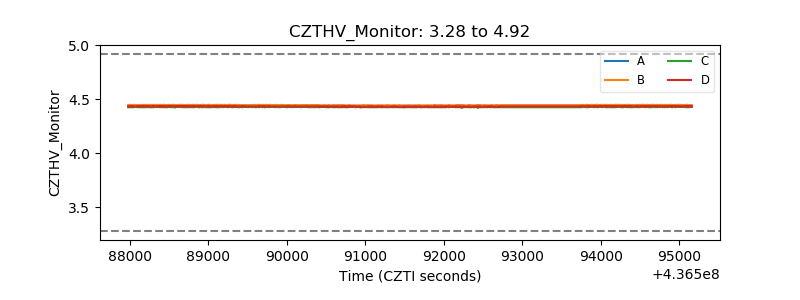 |
| D_VDD | 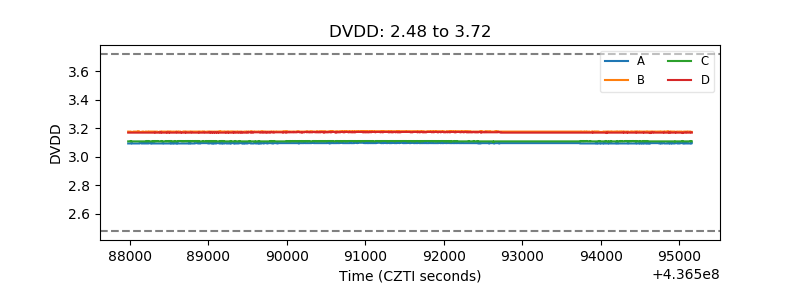 |
| Temperature 1 | 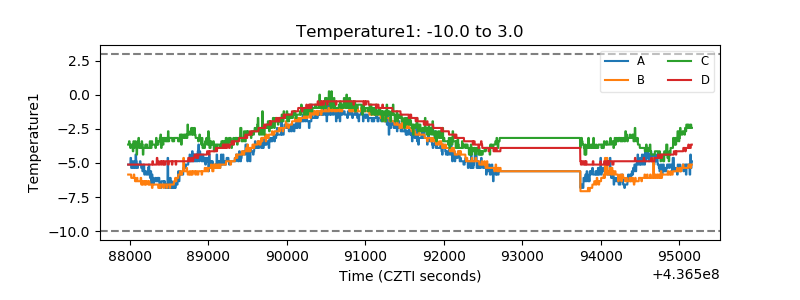 |
| Veto HV Monitor | 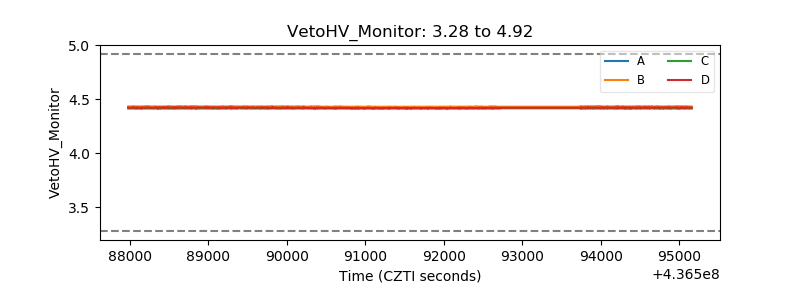 |
| Veto LLD | 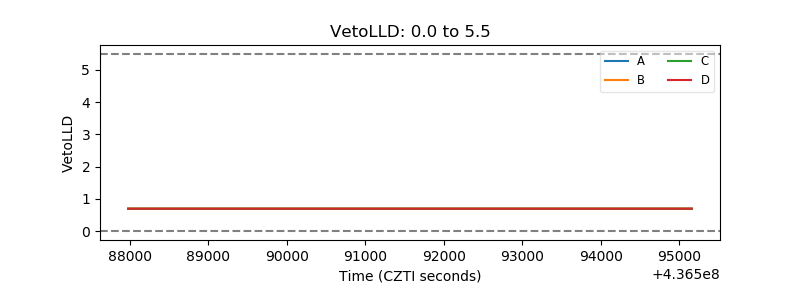 |
| Alpha Counter | 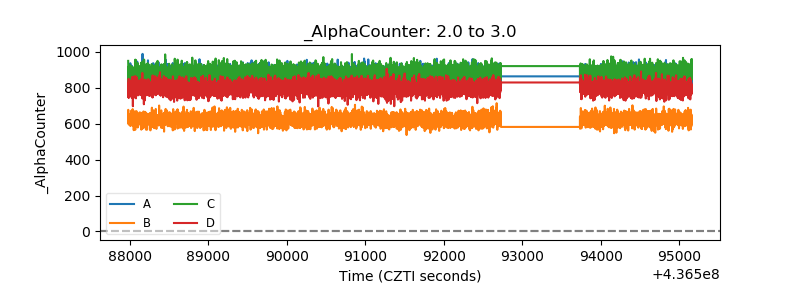 |
| _CPM_Rate | 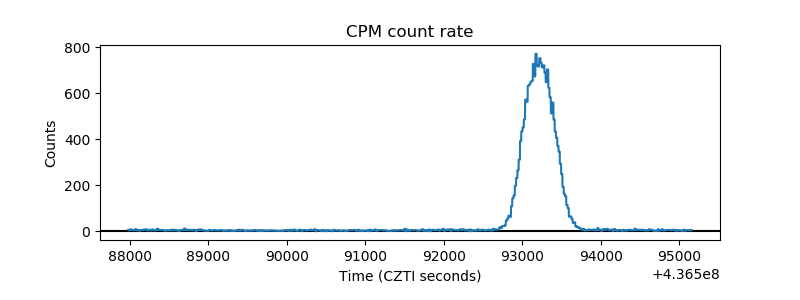 |
| CZT Counter | 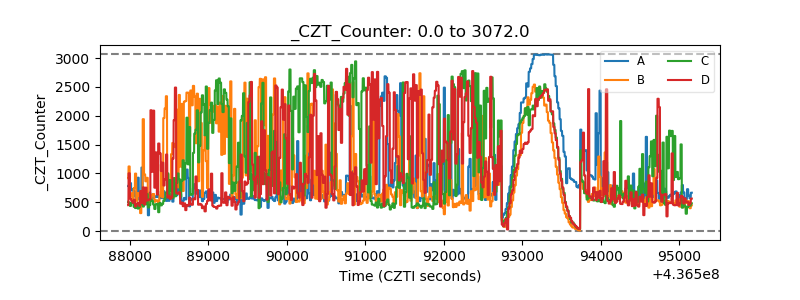 |
| +2.5 Volts monitor | 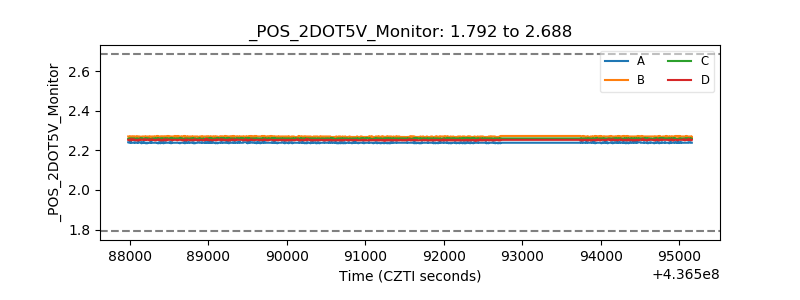 |
| +5 Volts monitor | 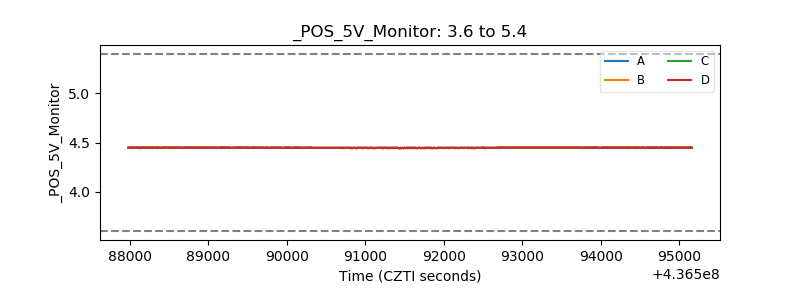 |
| _ROLL_ROT | 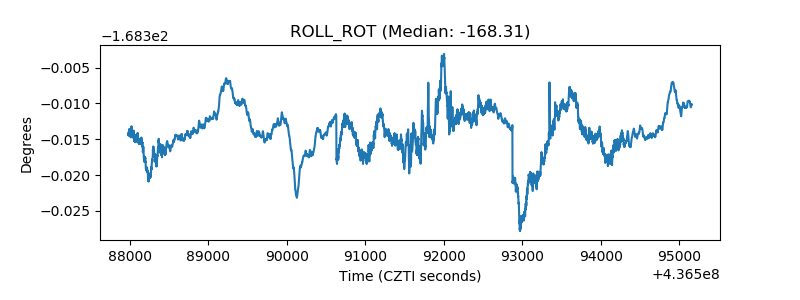 |
| _Roll_DEC | 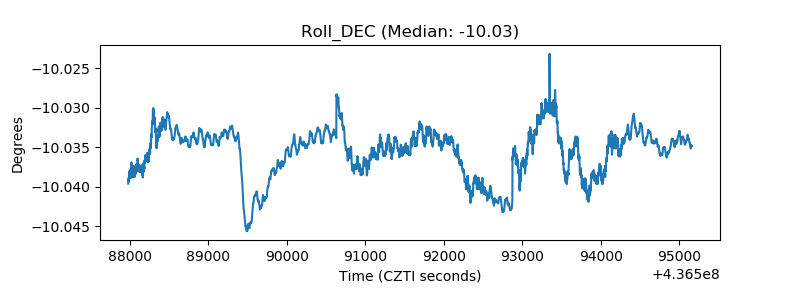 |
| _Roll_RA | 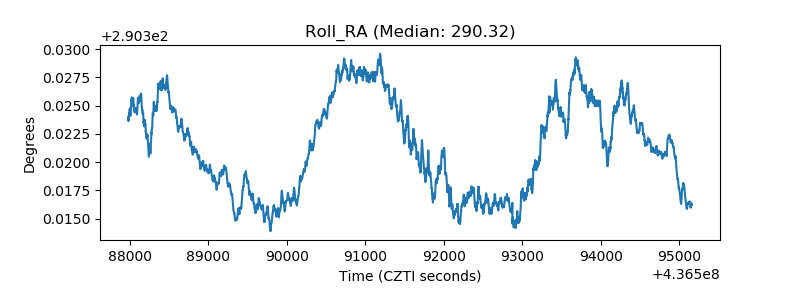 |
| Veto Counter | 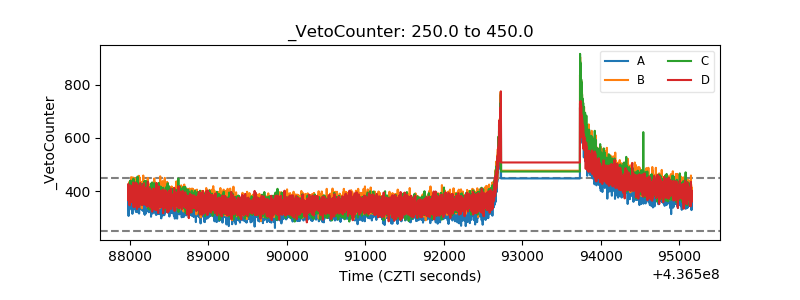 |