| Param | Original file | Final file |
|---|---|---|
| Filename | modeM0/AS1A13_026T01_9000005904_43776cztM0_level2.fits | modeM0/AS1A13_026T01_9000005904_43776cztM0_level2_quad_clean.evt |
| Size (bytes) | 614,260,800 | 103,752,000 |
| Size | 585.8 MB | 98.9 MB |
| Events in quadrant A | 5,505,775 | 703,946 |
| Events in quadrant B | 3,787,549 | 759,851 |
| Events in quadrant C | 6,293,365 | 654,351 |
| Events in quadrant D | 6,667,715 | 587,092 |
| Mode M0 | |||
|---|---|---|---|
| Quadrant | BADHDUFLAG | Total packets | Discarded packets |
| A | 0 | 21068 | 3 |
| B | 0 | 15208 | 1 |
| C | 0 | 22837 | 1 |
| D | 0 | 24076 | 1 |
| Mode SS | |||
|---|---|---|---|
| Quadrant | BADHDUFLAG | Total packets | Discarded packets |
| A | 0 | 128 | 0 |
| B | 0 | 128 | 0 |
| C | 0 | 128 | 0 |
| D | 0 | 128 | 0 |
| Mode M9 | |||
|---|---|---|---|
| Quadrant | BADHDUFLAG | Total packets | Discarded packets |
| A | 0 | 11 | 0 |
| B | 0 | 11 | 0 |
| C | 0 | 11 | 0 |
| D | 0 | 11 | 0 |
| Quadrant | Total seconds | Saturated seconds | Saturation percentage |
|---|---|---|---|
| A | 6244 | 499 | 7.991672% |
| B | 6244 | 222 | 3.555413% |
| C | 6245 | 909 | 14.555645% |
| D | 6245 | 969 | 15.516413% |
Noise dominated data is calculated using 1-second bins in cleaned event files. If a bin has >2000 counts, and if more than 50% of those come from <1% of pixels, then it is considered to be noise-dominated and hence unusable.
| Quadrant | # 1 sec bins | Bins with >0 counts | Bins with >2000 counts | High rate bins dominated by noise | Noise dominated (total time) | Noise dominated (detector-on time) | Marked lightcurve |
|---|---|---|---|---|---|---|---|
| A | 7349 | 6244 | 287 | 287 | 3.91% | 4.60% | 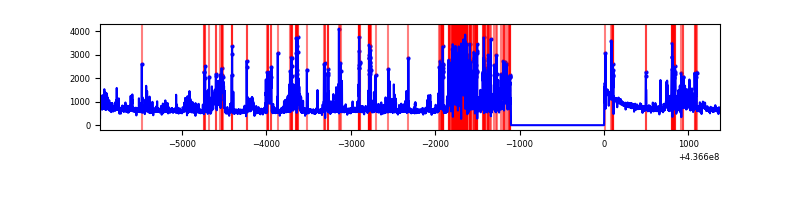 |
| B | 7349 | 6244 | 77 | 77 | 1.05% | 1.23% | 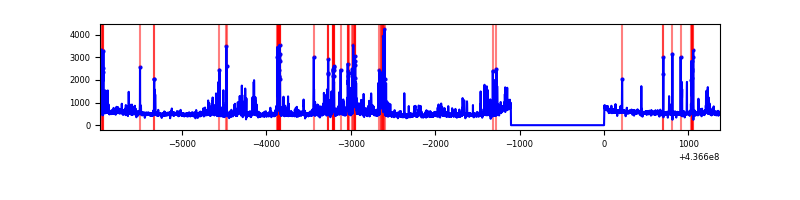 |
| C | 7350 | 6246 | 853 | 853 | 11.61% | 13.66% | 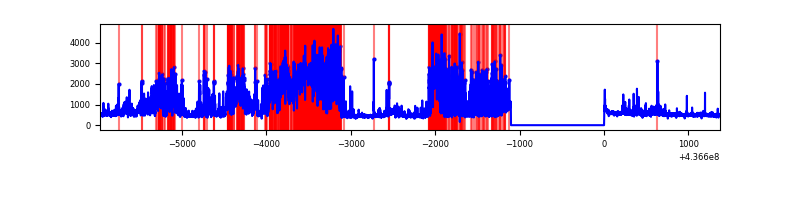 |
| D | 7350 | 6246 | 736 | 736 | 10.01% | 11.78% | 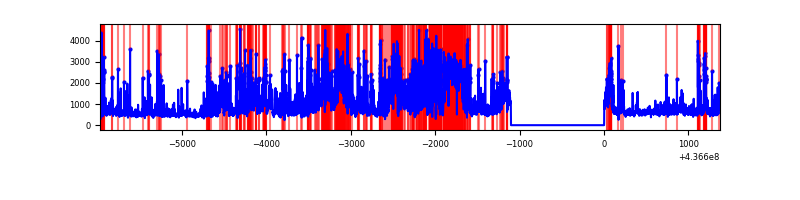 |
Top three noisy pixels from each quadrant. If the there are fewer than three noisy pixels in the level2.evt file, extra rows are filled as -1
| Pixel properties | Quadrant properties | ||||||
|---|---|---|---|---|---|---|---|
| Quadrant | DetID | PixID | Counts | Sigma | Mean | Median | Sigma |
| A | 15 | 223 | 1150906 | 7571.1 | 735 | 720 | 151.9 |
| A | 10 | 83 | 902333 | 5934.87 | 735 | 720 | 151.9 |
| A | 2 | 79 | 174960 | 1146.93 | 735 | 720 | 151.9 |
| B | 5 | 172 | 169308 | 1128.3 | 753 | 731 | 149.4 |
| B | 5 | 235 | 153100 | 1019.82 | 753 | 731 | 149.4 |
| B | 0 | 200 | 138293 | 920.71 | 753 | 731 | 149.4 |
| C | 15 | 174 | 2592743 | 15631.76 | 709 | 715 | 165.8 |
| C | 15 | 158 | 469108 | 2824.74 | 709 | 715 | 165.8 |
| C | 15 | 190 | 170265 | 1022.51 | 709 | 715 | 165.8 |
| D | 5 | 235 | 1228572 | 6867.86 | 698 | 676 | 178.8 |
| D | 12 | 33 | 1032233 | 5769.7 | 698 | 676 | 178.8 |
| D | 1 | 52 | 708286 | 3957.8 | 698 | 676 | 178.8 |
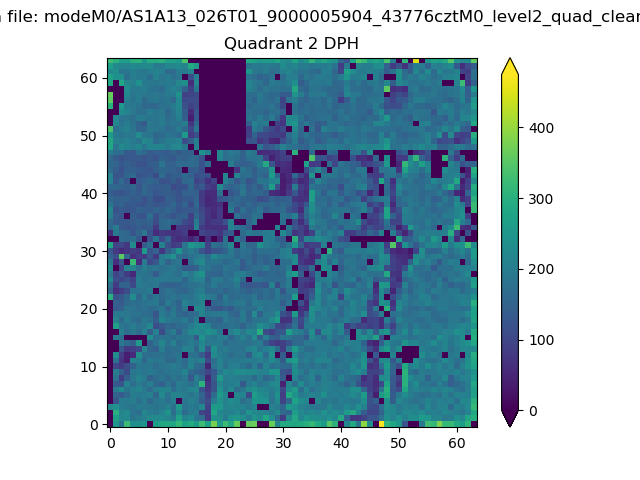
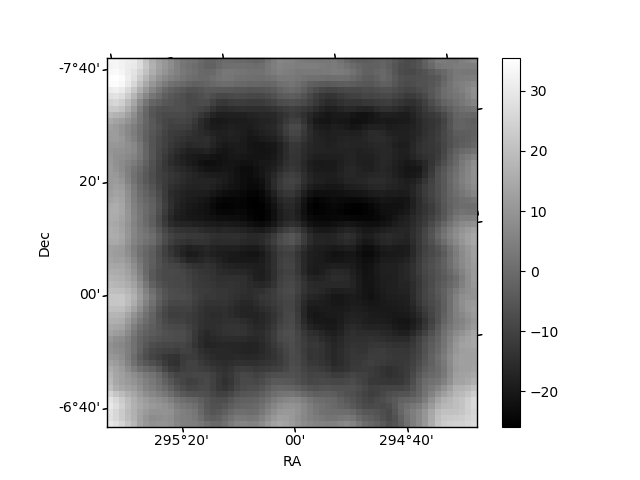
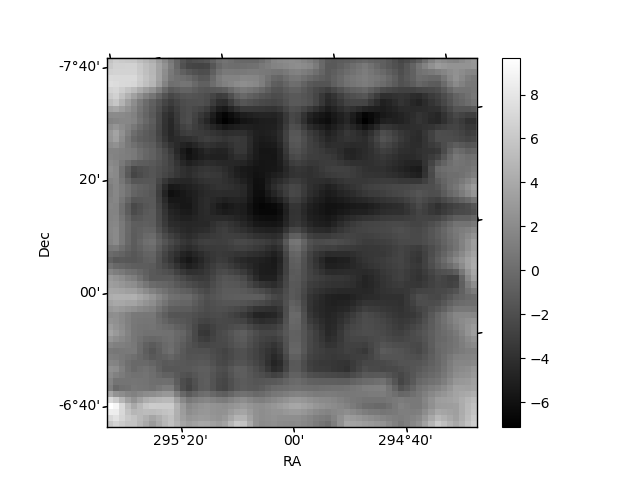
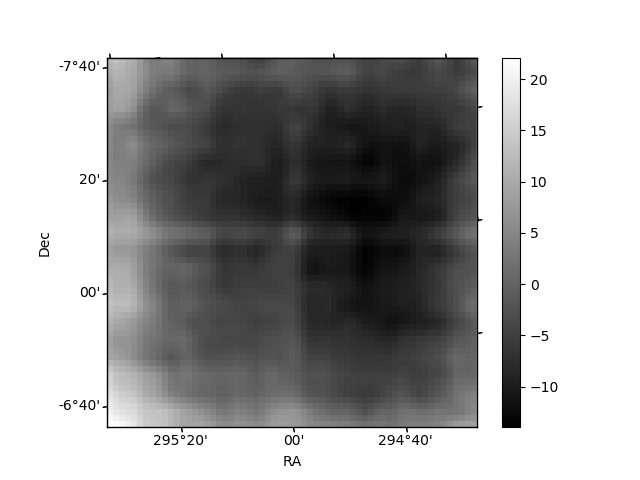
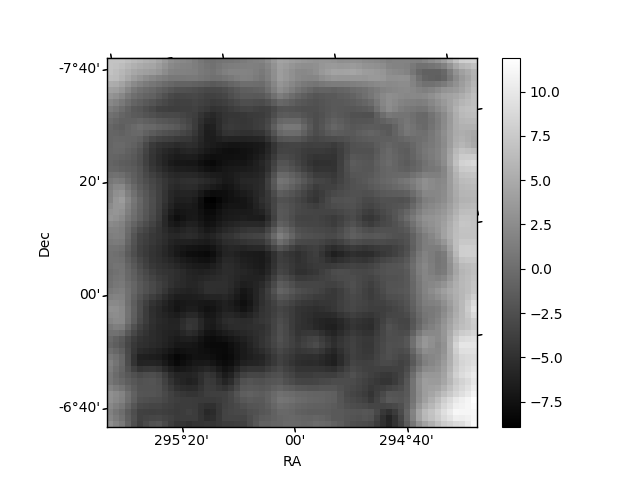
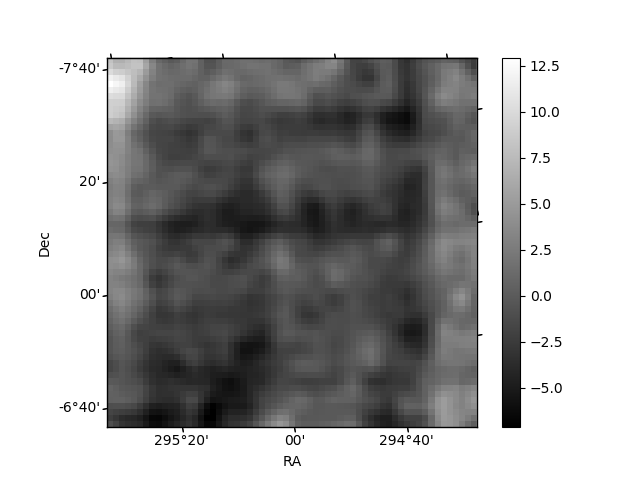
Histogram calculated using DETX and DETY for each event in the final _common_clean file
| Quadrant A | 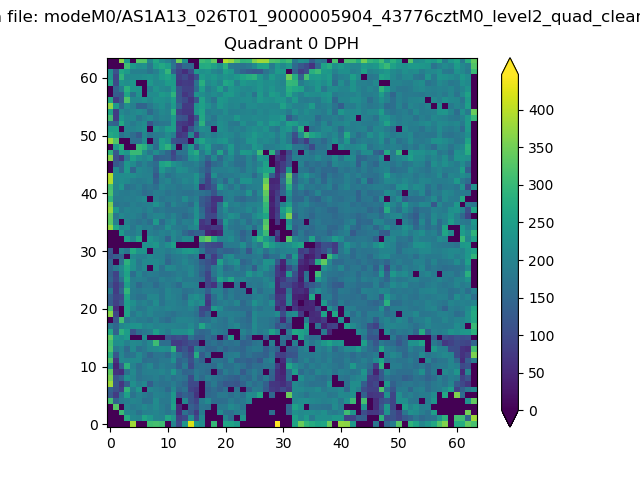 |
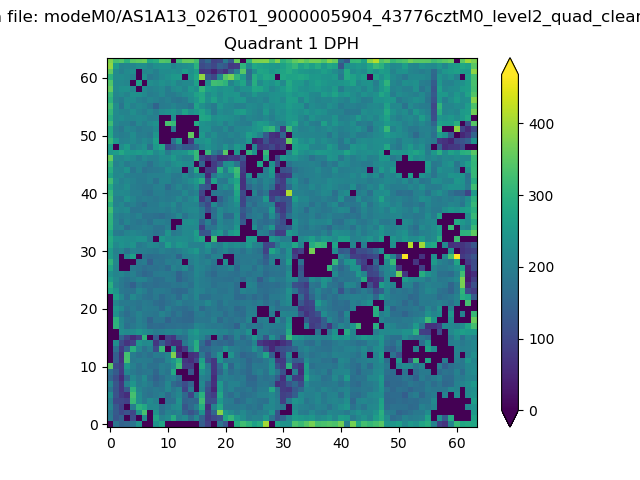 |
Quadrant B |
|---|---|---|---|
| Quadrant D | 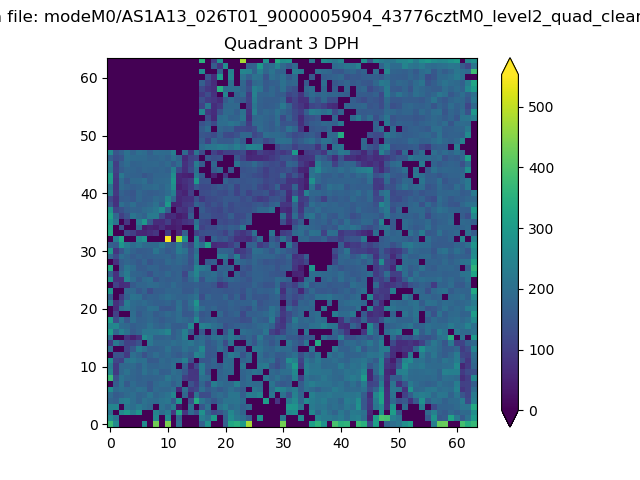 |
 |
Quadrant C |
| Plot type | Count rate plots | Images |
|---|---|---|
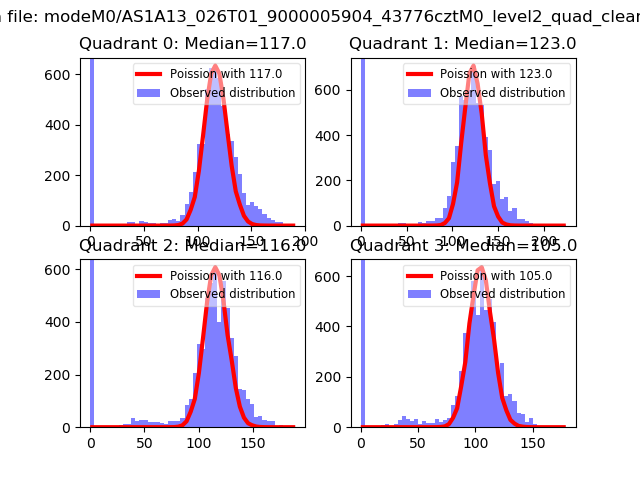
| Comparison with Poisson distribution Blue bars denote a histogram of data divided into 1 sec bins. Red curve is a Poisson curve with rate = median count rate of data. |
 |
 |
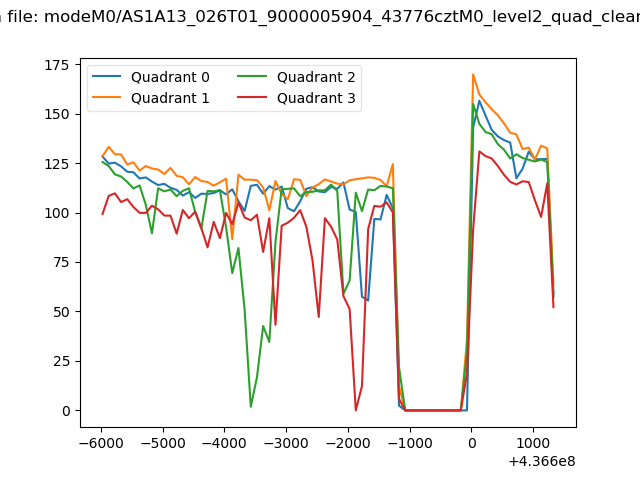
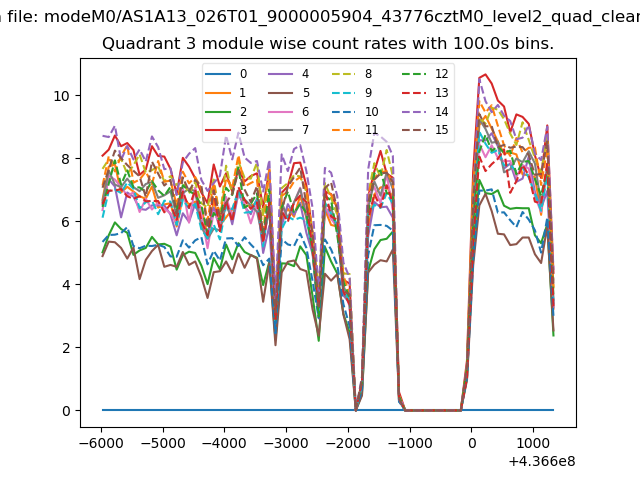
| Quadrant-wise count rates Data is divided into 100 sec bins |
 |
|
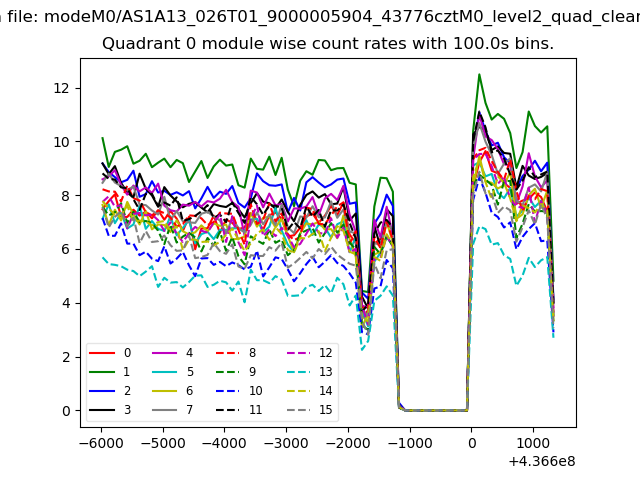
| Module-wise count rates for Quadrant A Data is divided into 100 sec bins |
 |
 |
| Module-wise count rates for Quadrant B Data is divided into 100 sec bins |
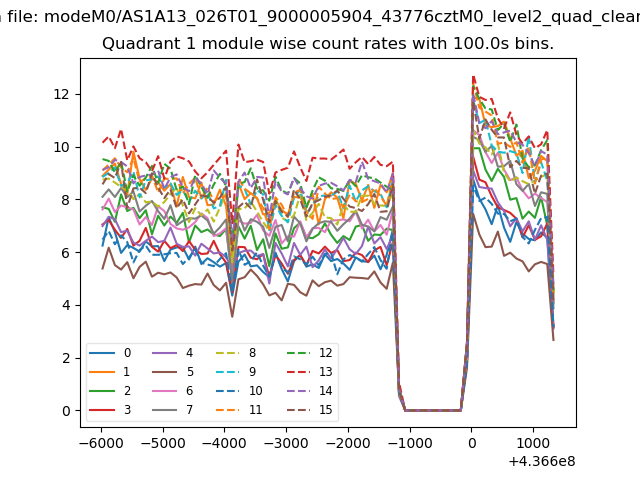 |
 |
| Module-wise count rates for Quadrant C Data is divided into 100 sec bins |
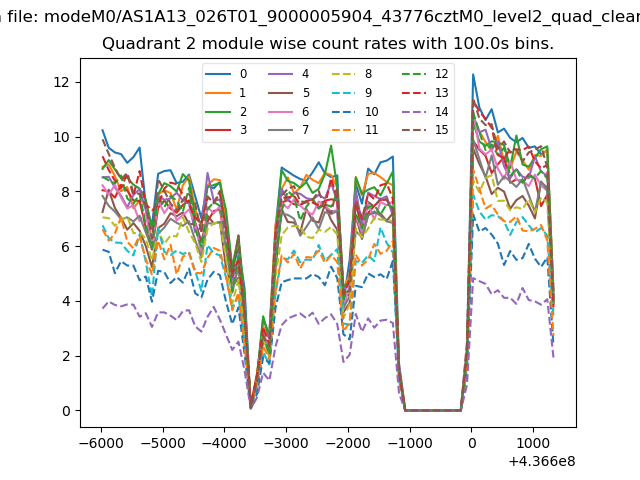 |
 |
| Module-wise count rates for Quadrant D Data is divided into 100 sec bins |
 |
 |
| Parameter | Plot |
|---|---|
| CZT HV Monitor | 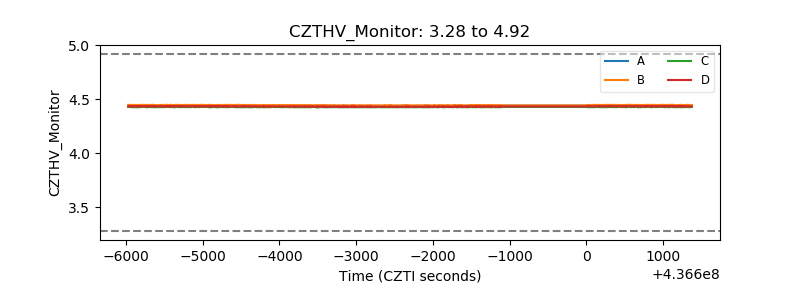 |
| D_VDD | 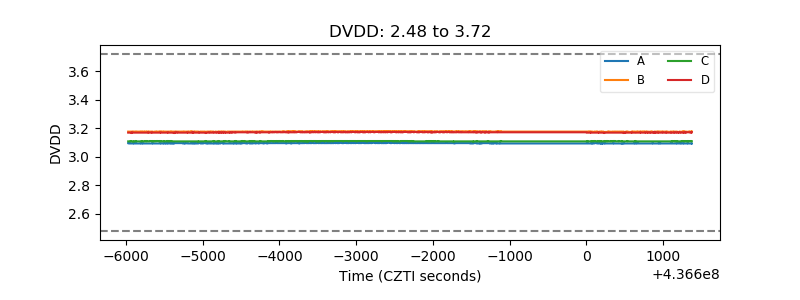 |
| Temperature 1 | 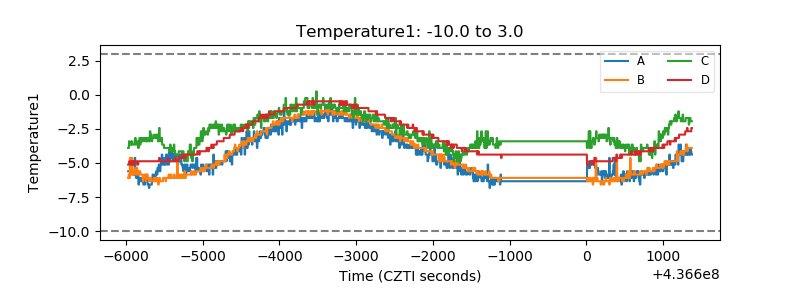 |
| Veto HV Monitor | 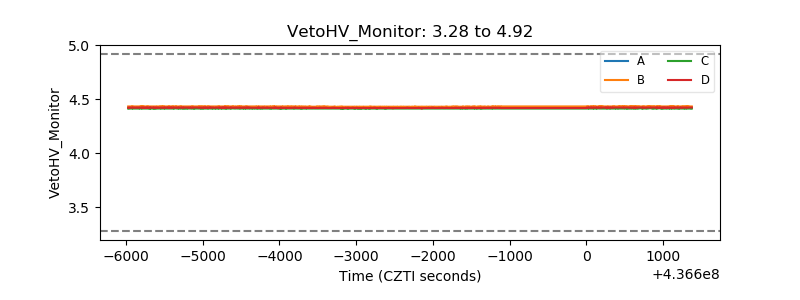 |
| Veto LLD | 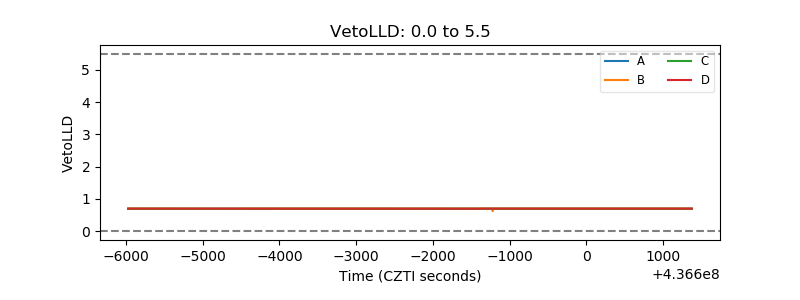 |
| Alpha Counter | 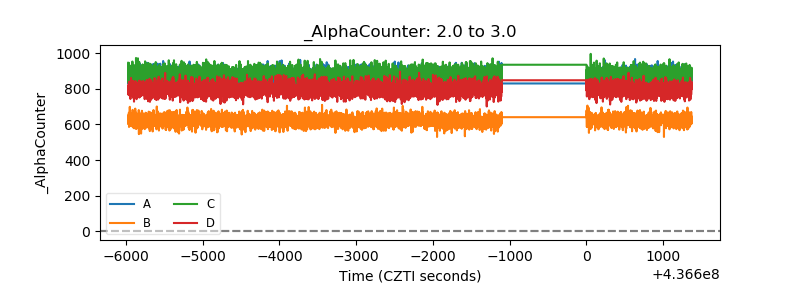 |
| _CPM_Rate | 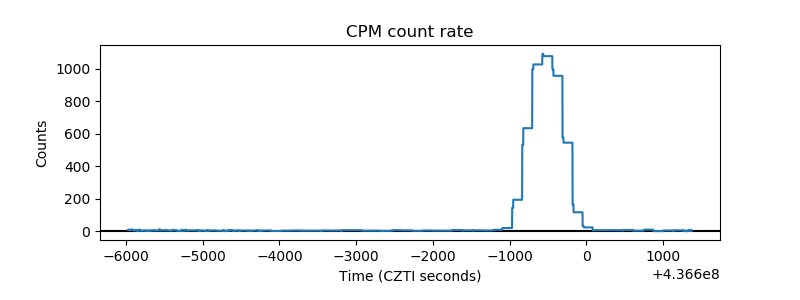 |
| CZT Counter | 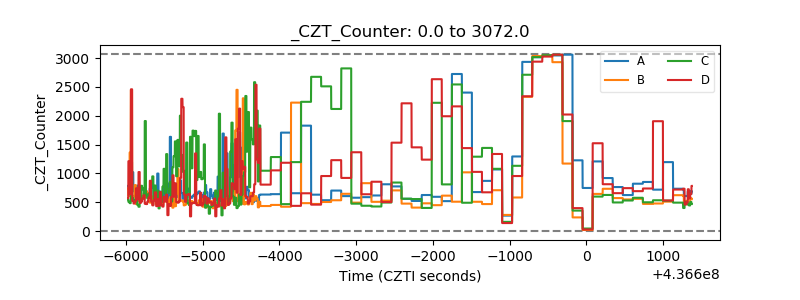 |
| +2.5 Volts monitor | 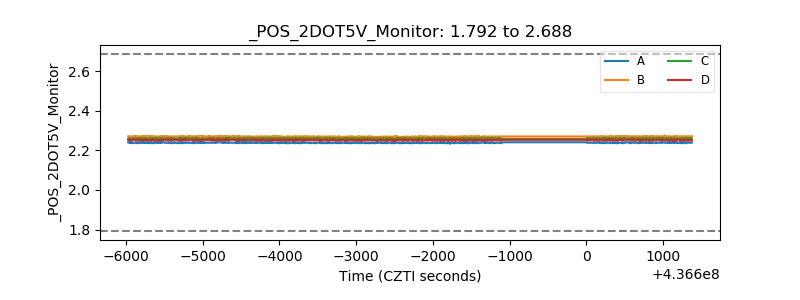 |
| +5 Volts monitor | 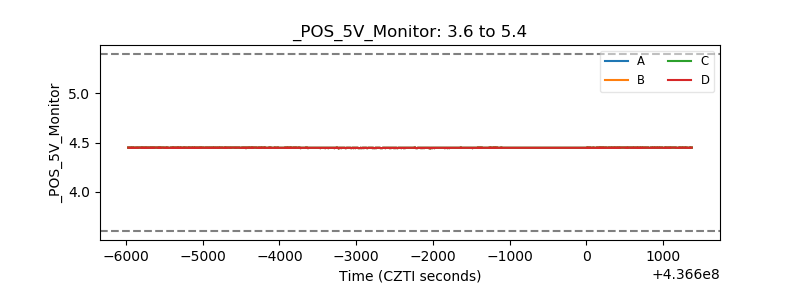 |
| _ROLL_ROT | 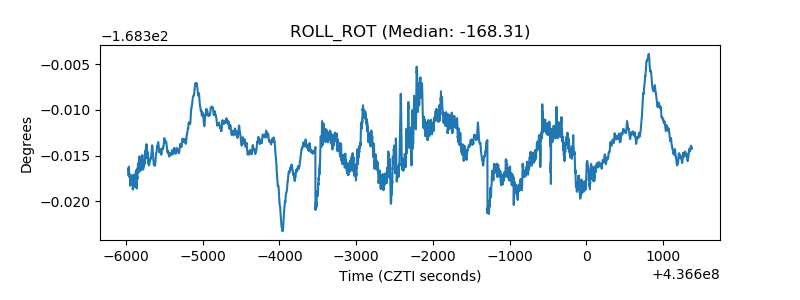 |
| _Roll_DEC | 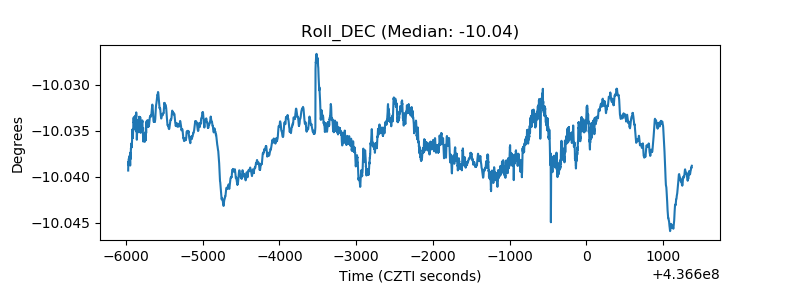 |
| _Roll_RA | 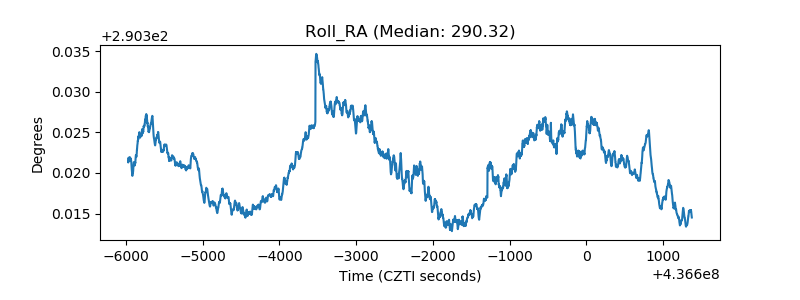 |
| Veto Counter | 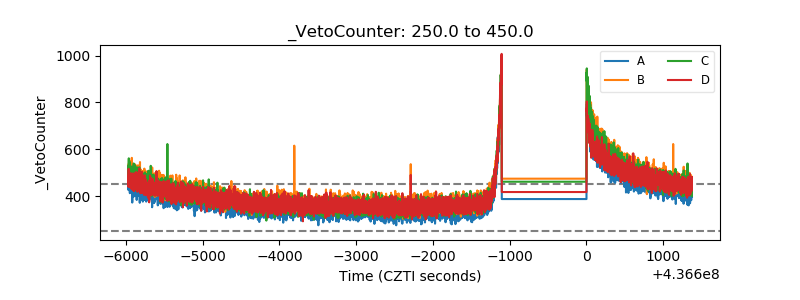 |