| Param | Original file | Final file |
|---|---|---|
| Filename | modeM0/AS1A13_026T01_9000005904_43777cztM0_level2.fits | modeM0/AS1A13_026T01_9000005904_43777cztM0_level2_quad_clean.evt |
| Size (bytes) | 735,675,840 | 105,462,720 |
| Size | 701.6 MB | 100.6 MB |
| Events in quadrant A | 7,262,363 | 658,925 |
| Events in quadrant B | 4,231,257 | 830,935 |
| Events in quadrant C | 6,423,375 | 685,203 |
| Events in quadrant D | 8,819,785 | 570,833 |
| Mode M0 | |||
|---|---|---|---|
| Quadrant | BADHDUFLAG | Total packets | Discarded packets |
| A | 0 | 26486 | 2 |
| B | 0 | 16643 | 2 |
| C | 0 | 23154 | 2 |
| D | 0 | 30637 | 6 |
| Mode SS | |||
|---|---|---|---|
| Quadrant | BADHDUFLAG | Total packets | Discarded packets |
| A | 0 | 132 | 0 |
| B | 0 | 132 | 0 |
| C | 0 | 132 | 0 |
| D | 0 | 132 | 0 |
| Mode M9 | |||
|---|---|---|---|
| Quadrant | BADHDUFLAG | Total packets | Discarded packets |
| A | 0 | 17 | 0 |
| B | 0 | 18 | 0 |
| C | 0 | 18 | 0 |
| D | 0 | 18 | 0 |
| Quadrant | Total seconds | Saturated seconds | Saturation percentage |
|---|---|---|---|
| A | 6406 | 1467 | 22.900406% |
| B | 6406 | 273 | 4.261630% |
| C | 6406 | 1183 | 18.467062% |
| D | 6405 | 1747 | 27.275566% |
Noise dominated data is calculated using 1-second bins in cleaned event files. If a bin has >2000 counts, and if more than 50% of those come from <1% of pixels, then it is considered to be noise-dominated and hence unusable.
| Quadrant | # 1 sec bins | Bins with >0 counts | Bins with >2000 counts | High rate bins dominated by noise | Noise dominated (total time) | Noise dominated (detector-on time) | Marked lightcurve |
|---|---|---|---|---|---|---|---|
| A | 7586 | 6406 | 1111 | 1111 | 14.65% | 17.34% | 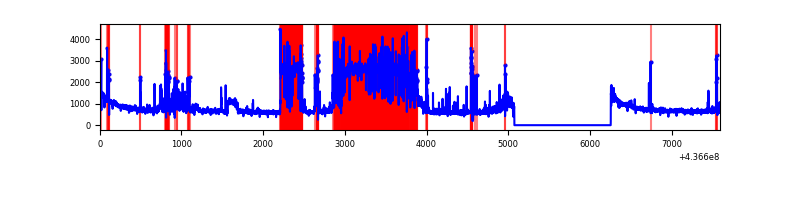 |
| B | 7586 | 6407 | 84 | 84 | 1.11% | 1.31% | 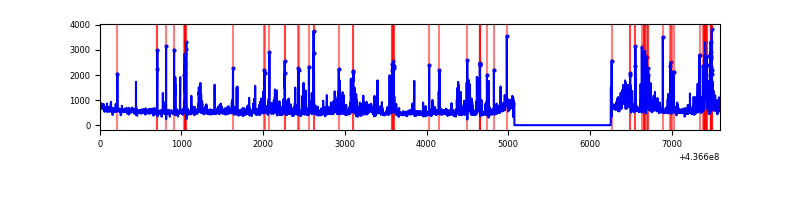 |
| C | 7586 | 6407 | 978 | 978 | 12.89% | 15.26% | 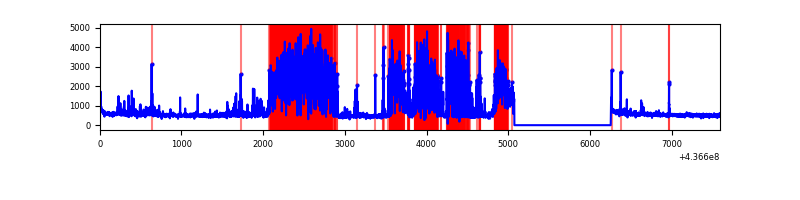 |
| D | 7584 | 6405 | 1496 | 1496 | 19.73% | 23.36% | 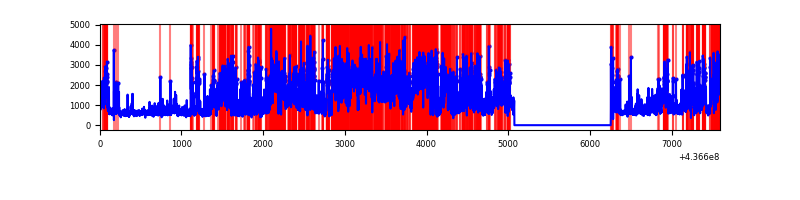 |
Top three noisy pixels from each quadrant. If the there are fewer than three noisy pixels in the level2.evt file, extra rows are filled as -1
| Pixel properties | Quadrant properties | ||||||
|---|---|---|---|---|---|---|---|
| Quadrant | DetID | PixID | Counts | Sigma | Mean | Median | Sigma |
| A | 15 | 223 | 3144780 | 21286.96 | 721 | 707 | 147.7 |
| A | 10 | 83 | 894472 | 6051.24 | 721 | 707 | 147.7 |
| A | 14 | 63 | 176267 | 1188.63 | 721 | 707 | 147.7 |
| B | 0 | 200 | 321285 | 2054.96 | 804 | 783 | 156.0 |
| B | 5 | 235 | 233912 | 1494.75 | 804 | 783 | 156.0 |
| B | 10 | 245 | 101305 | 644.52 | 804 | 783 | 156.0 |
| C | 15 | 174 | 2476594 | 14392.4 | 739 | 746 | 172.0 |
| C | 15 | 158 | 641870 | 3726.93 | 739 | 746 | 172.0 |
| C | 14 | 254 | 149672 | 865.72 | 739 | 746 | 172.0 |
| D | 12 | 33 | 2795817 | 14766.24 | 728 | 704 | 189.3 |
| D | 5 | 235 | 674273 | 3558.38 | 728 | 704 | 189.3 |
| D | 5 | 222 | 555401 | 2930.4 | 728 | 704 | 189.3 |
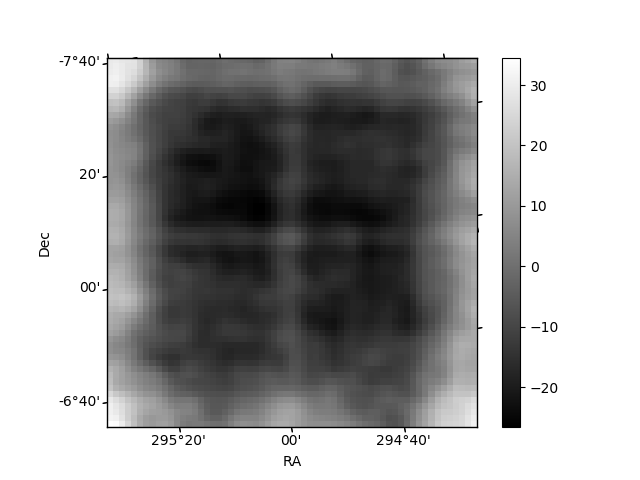
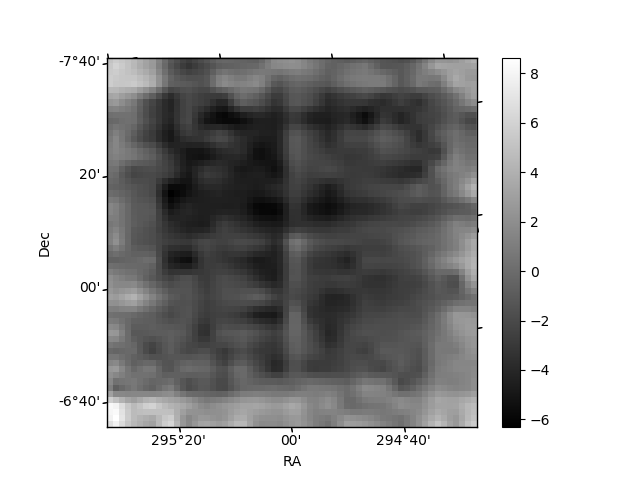
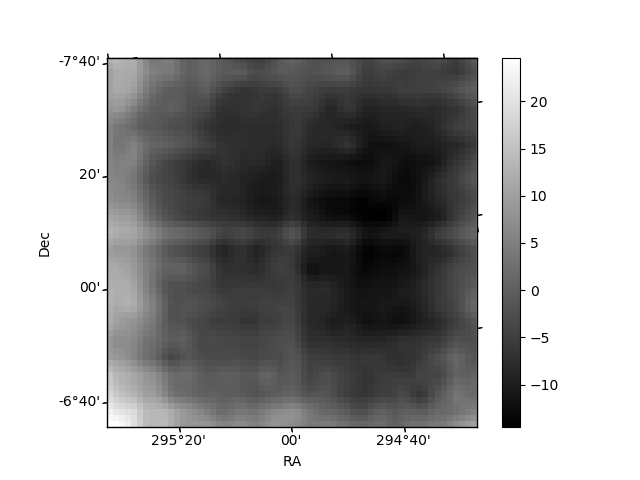
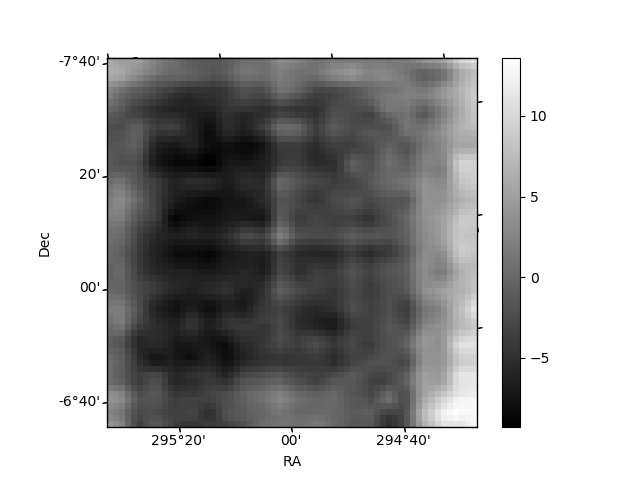
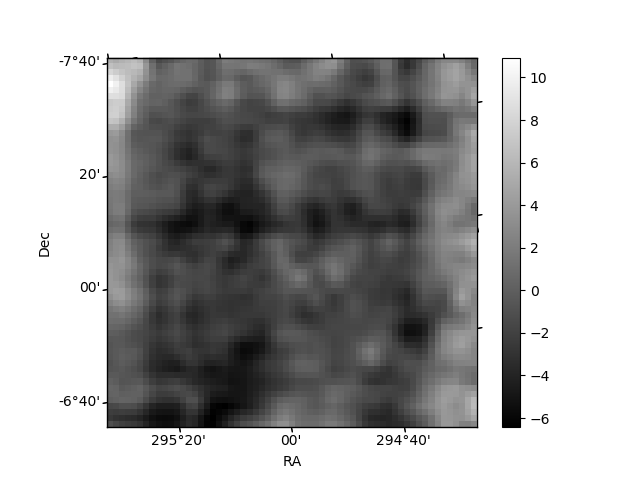
Histogram calculated using DETX and DETY for each event in the final _common_clean file
| Quadrant A | 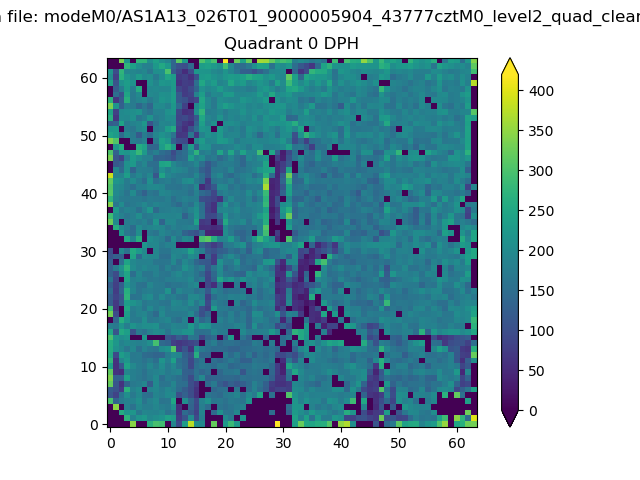 |
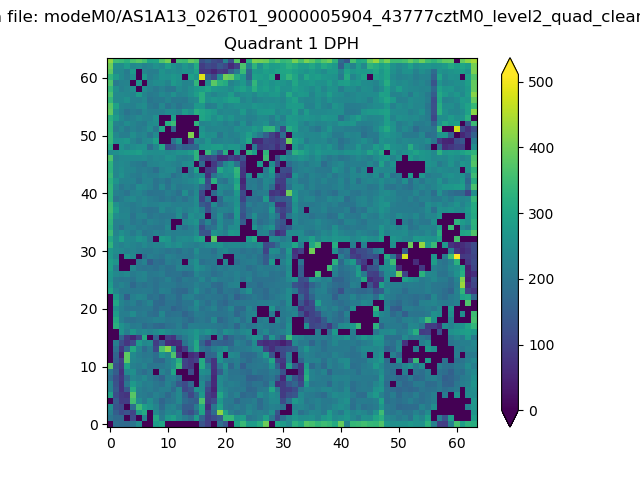 |
Quadrant B |
|---|---|---|---|
| Quadrant D | 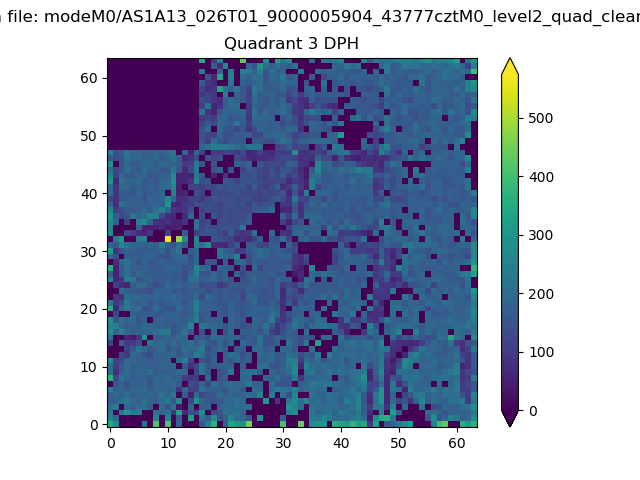 |
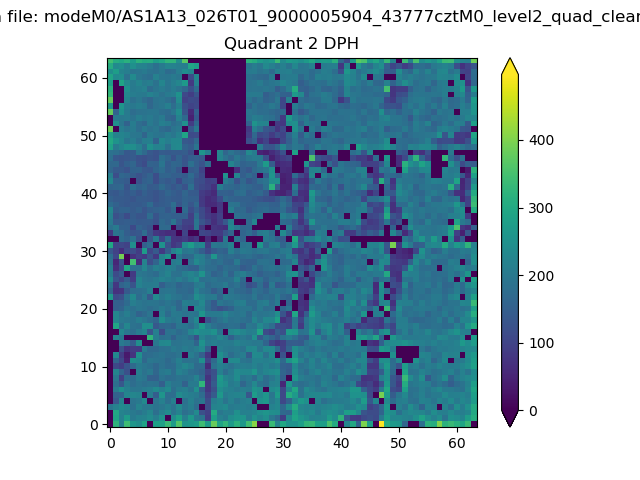 |
Quadrant C |
| Plot type | Count rate plots | Images |
|---|---|---|
| Comparison with Poisson distribution Blue bars denote a histogram of data divided into 1 sec bins. Red curve is a Poisson curve with rate = median count rate of data. |
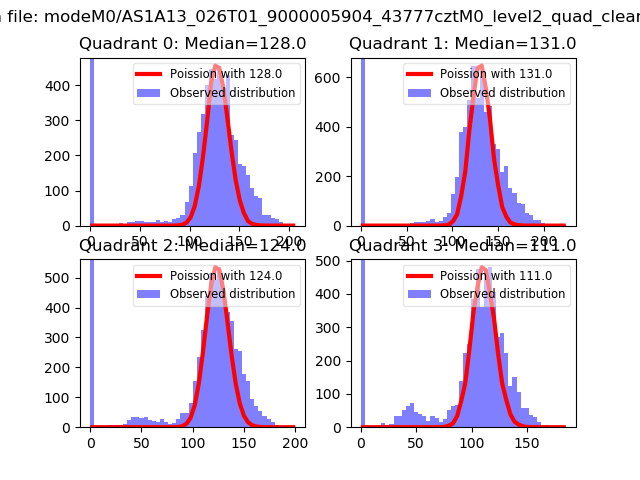 |
 |
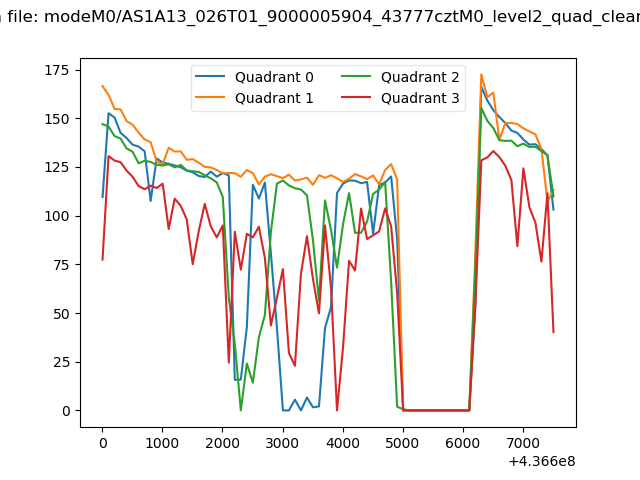
| Quadrant-wise count rates Data is divided into 100 sec bins |
 |
|
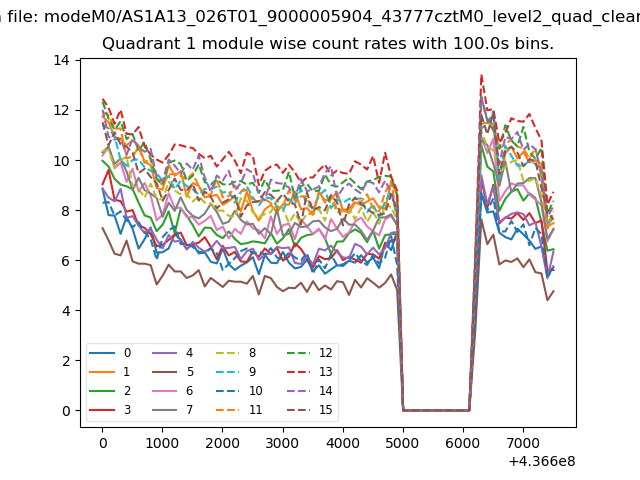
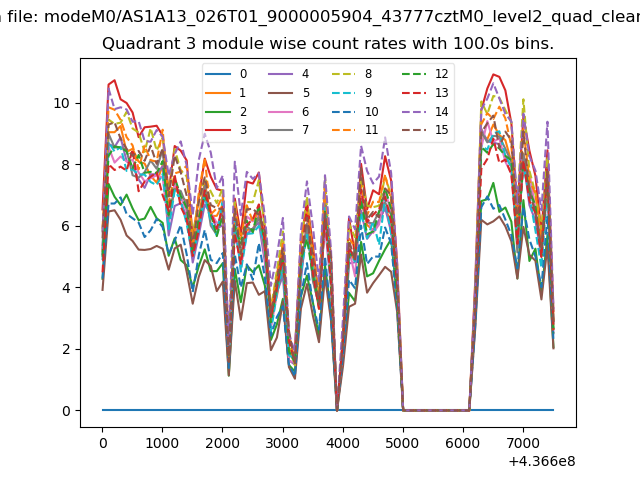
| Module-wise count rates for Quadrant A Data is divided into 100 sec bins |
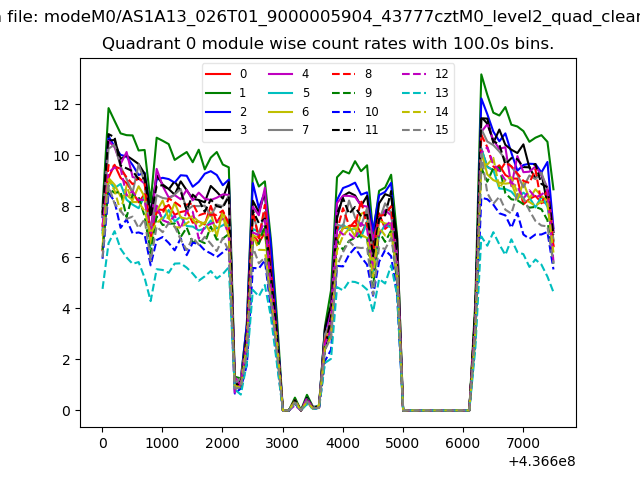 |
 |
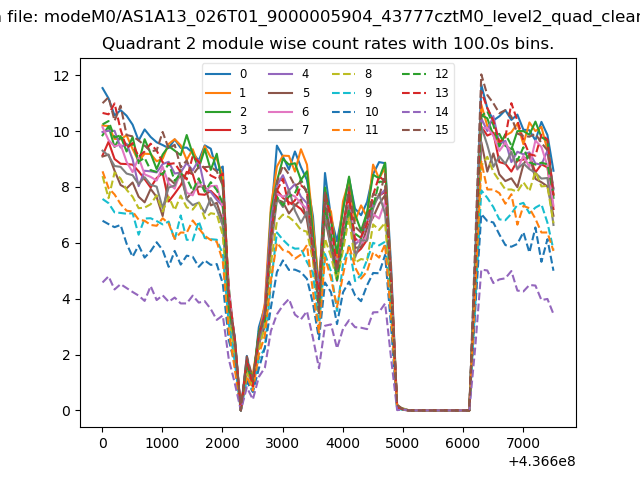
| Module-wise count rates for Quadrant B Data is divided into 100 sec bins |
 |
 |
| Module-wise count rates for Quadrant C Data is divided into 100 sec bins |
 |
 |
| Module-wise count rates for Quadrant D Data is divided into 100 sec bins |
 |
 |
| Parameter | Plot |
|---|---|
| CZT HV Monitor | 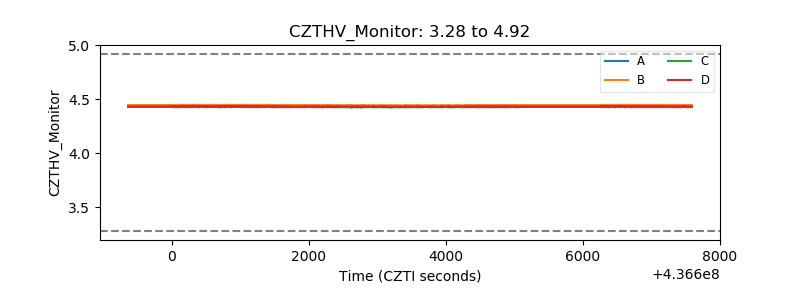 |
| D_VDD | 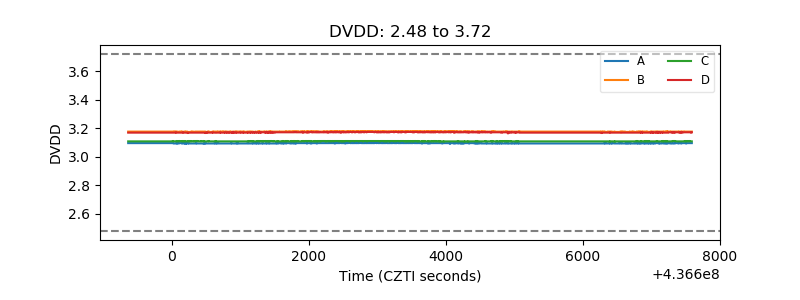 |
| Temperature 1 | 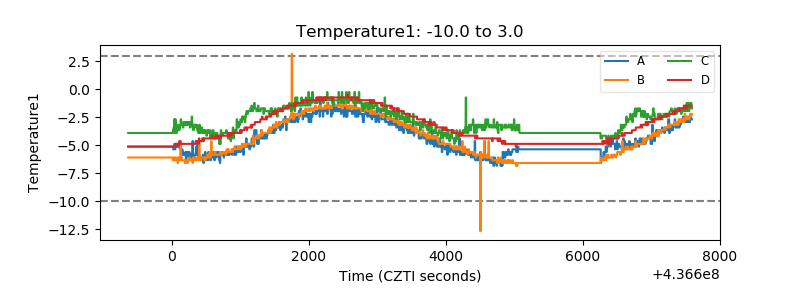 |
| Veto HV Monitor | 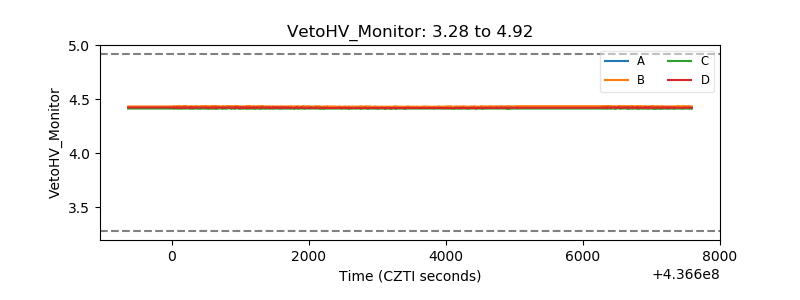 |
| Veto LLD | 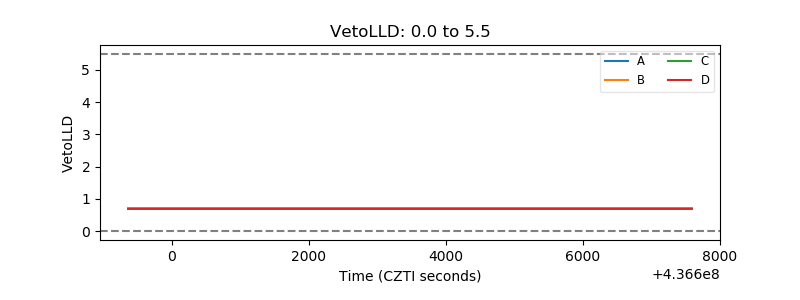 |
| Alpha Counter | 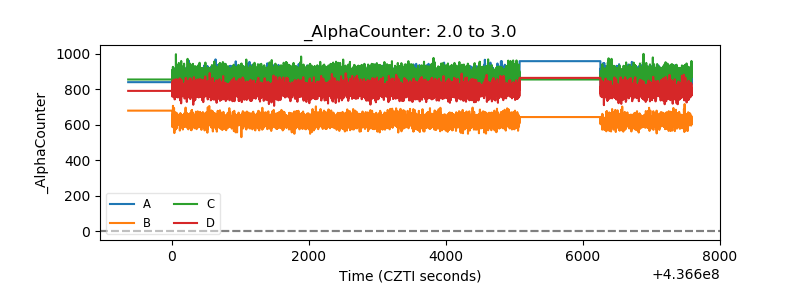 |
| _CPM_Rate | 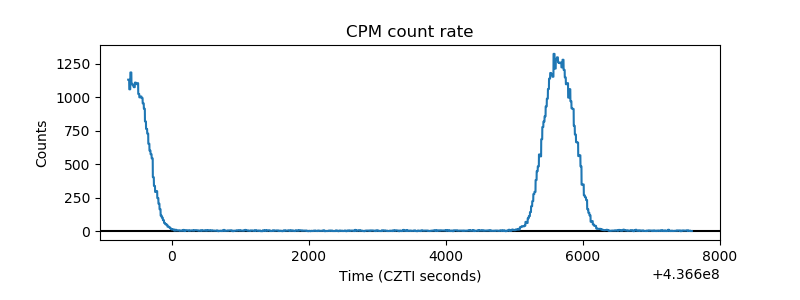 |
| CZT Counter | 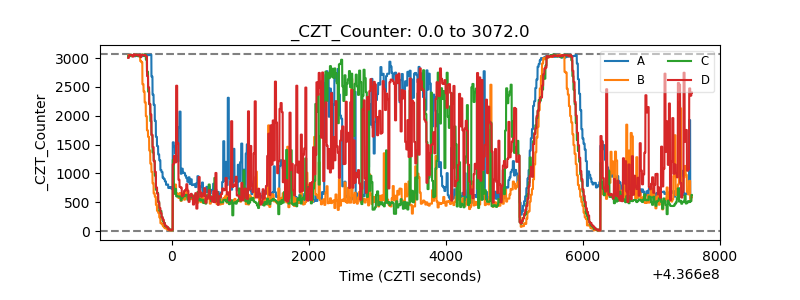 |
| +2.5 Volts monitor | 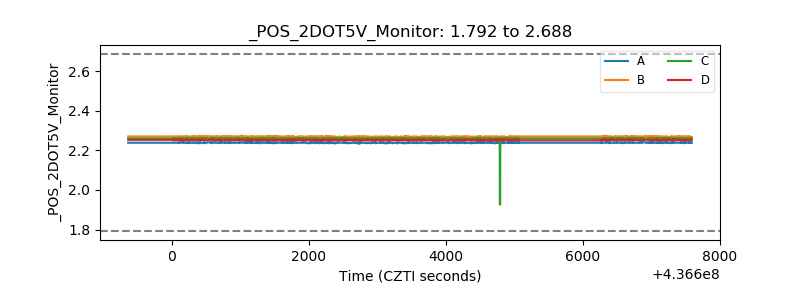 |
| +5 Volts monitor | 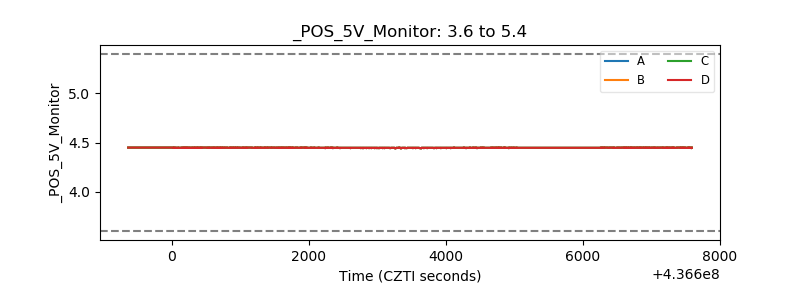 |
| _ROLL_ROT | 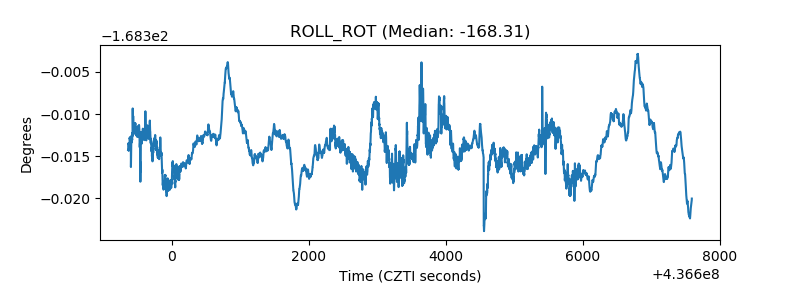 |
| _Roll_DEC | 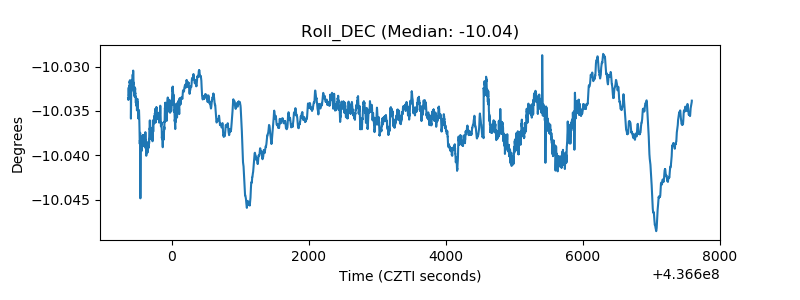 |
| _Roll_RA | 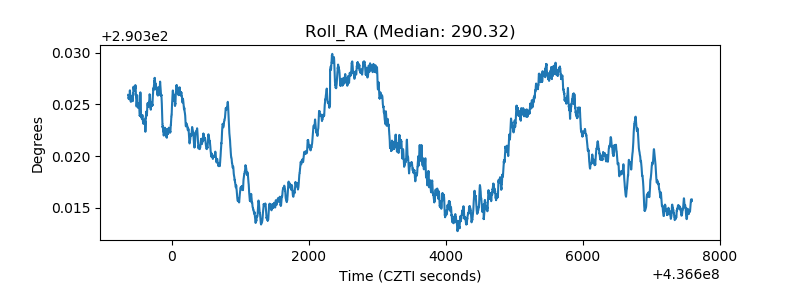 |
| Veto Counter | 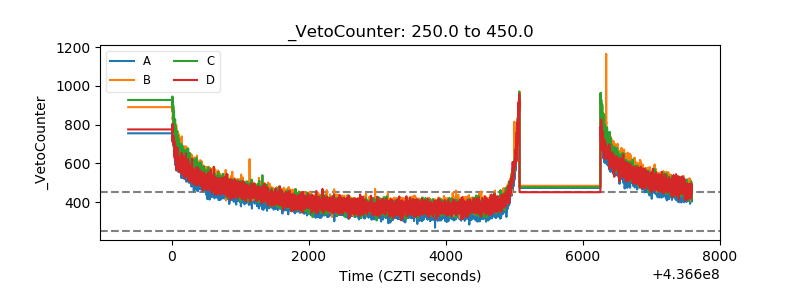 |