| Param | Original file | Final file |
|---|---|---|
| Filename | modeM0/AS1A13_026T01_9000005904_43778cztM0_level2.fits | modeM0/AS1A13_026T01_9000005904_43778cztM0_level2_quad_clean.evt |
| Size (bytes) | 653,575,680 | 97,110,720 |
| Size | 623.3 MB | 92.6 MB |
| Events in quadrant A | 4,580,843 | 706,136 |
| Events in quadrant B | 4,210,392 | 743,140 |
| Events in quadrant C | 5,757,051 | 640,888 |
| Events in quadrant D | 9,195,522 | 444,642 |
| Mode M0 | |||
|---|---|---|---|
| Quadrant | BADHDUFLAG | Total packets | Discarded packets |
| A | 0 | 18167 | 5 |
| B | 0 | 16364 | 1 |
| C | 0 | 20776 | 1 |
| D | 0 | 31384 | 1 |
| Mode SS | |||
|---|---|---|---|
| Quadrant | BADHDUFLAG | Total packets | Discarded packets |
| A | 0 | 118 | 0 |
| B | 0 | 118 | 0 |
| C | 0 | 118 | 0 |
| D | 0 | 118 | 0 |
| Mode M9 | |||
|---|---|---|---|
| Quadrant | BADHDUFLAG | Total packets | Discarded packets |
| A | 0 | 12 | 0 |
| B | 0 | 12 | 0 |
| C | 0 | 12 | 0 |
| D | 0 | 12 | 0 |
| Quadrant | Total seconds | Saturated seconds | Saturation percentage |
|---|---|---|---|
| A | 5802 | 389 | 6.704585% |
| B | 5803 | 280 | 4.825090% |
| C | 5803 | 931 | 16.043426% |
| D | 5803 | 2237 | 38.549026% |
Noise dominated data is calculated using 1-second bins in cleaned event files. If a bin has >2000 counts, and if more than 50% of those come from <1% of pixels, then it is considered to be noise-dominated and hence unusable.
| Quadrant | # 1 sec bins | Bins with >0 counts | Bins with >2000 counts | High rate bins dominated by noise | Noise dominated (total time) | Noise dominated (detector-on time) | Marked lightcurve |
|---|---|---|---|---|---|---|---|
| A | 7007 | 5803 | 151 | 151 | 2.15% | 2.60% | 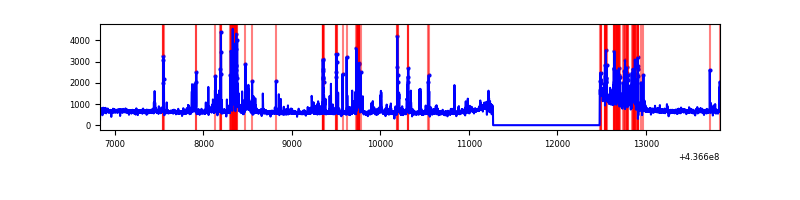 |
| B | 7008 | 5804 | 117 | 117 | 1.67% | 2.02% | 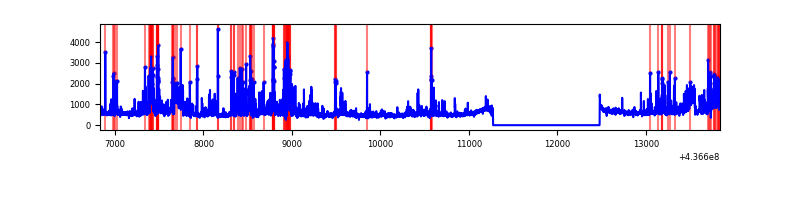 |
| C | 7008 | 5804 | 824 | 824 | 11.76% | 14.20% | 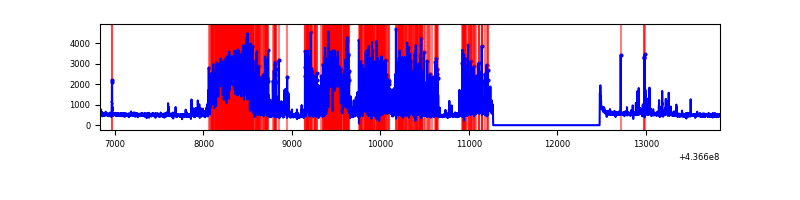 |
| D | 7008 | 5803 | 1910 | 1910 | 27.25% | 32.91% | 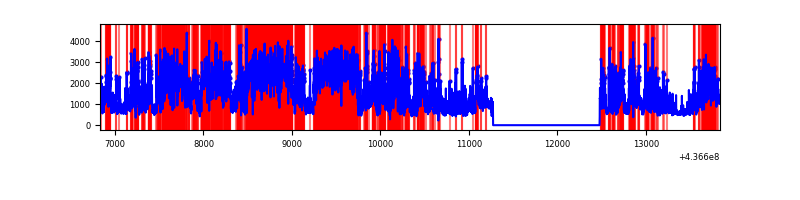 |
Top three noisy pixels from each quadrant. If the there are fewer than three noisy pixels in the level2.evt file, extra rows are filled as -1
| Pixel properties | Quadrant properties | ||||||
|---|---|---|---|---|---|---|---|
| Quadrant | DetID | PixID | Counts | Sigma | Mean | Median | Sigma |
| A | 10 | 83 | 837168 | 5611.14 | 725 | 710 | 149.1 |
| A | 15 | 223 | 584870 | 3918.67 | 725 | 710 | 149.1 |
| A | 13 | 248 | 213377 | 1426.62 | 725 | 710 | 149.1 |
| B | 0 | 200 | 421701 | 3026.43 | 719 | 699 | 139.1 |
| B | 5 | 235 | 414556 | 2975.07 | 719 | 699 | 139.1 |
| B | 5 | 172 | 121286 | 866.86 | 719 | 699 | 139.1 |
| C | 15 | 174 | 1953066 | 12508.94 | 672 | 679 | 156.1 |
| C | 15 | 158 | 784433 | 5021.51 | 672 | 679 | 156.1 |
| C | 15 | 157 | 113400 | 722.2 | 672 | 679 | 156.1 |
| D | 12 | 33 | 4666852 | 29219.58 | 623 | 603 | 159.7 |
| D | 5 | 235 | 378705 | 2367.64 | 623 | 603 | 159.7 |
| D | 12 | 128 | 377751 | 2361.66 | 623 | 603 | 159.7 |
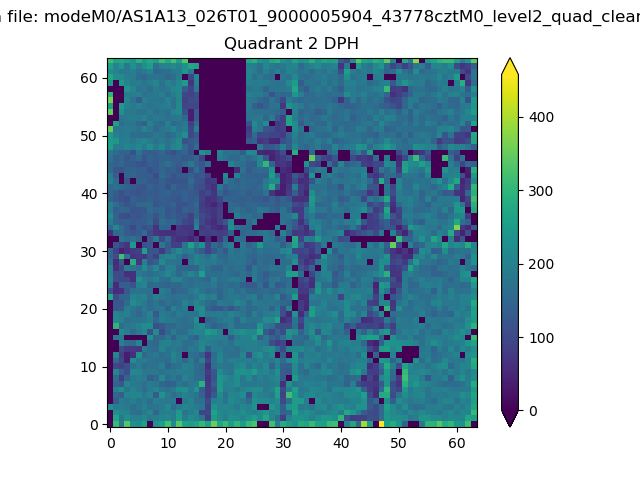
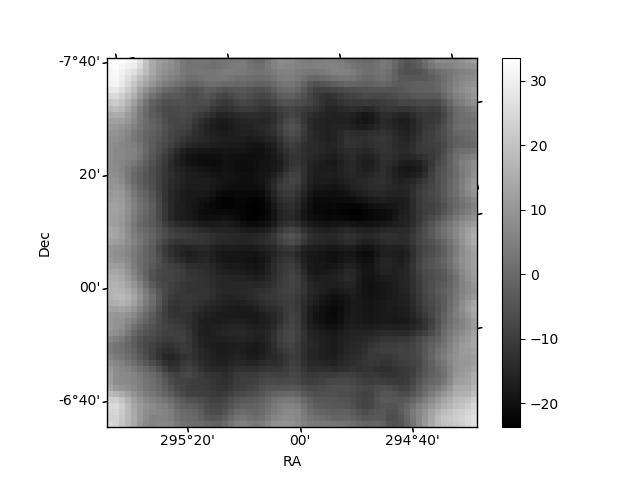
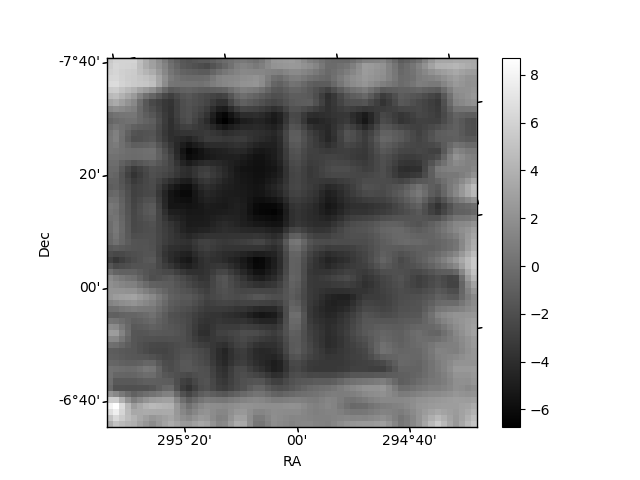
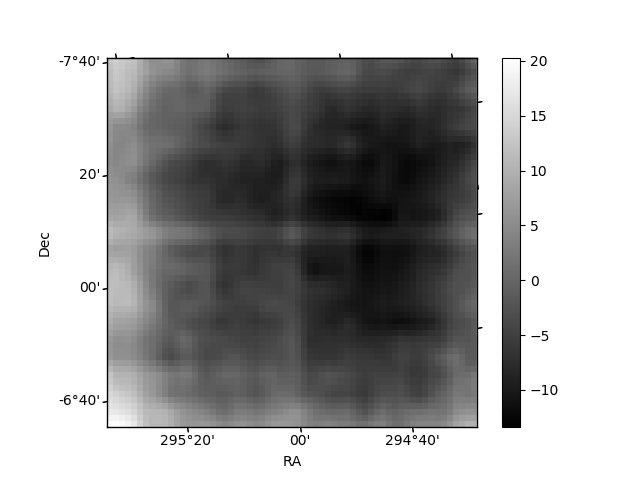
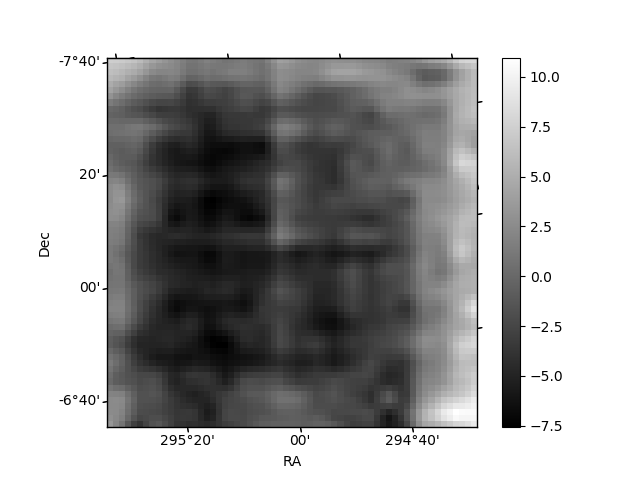
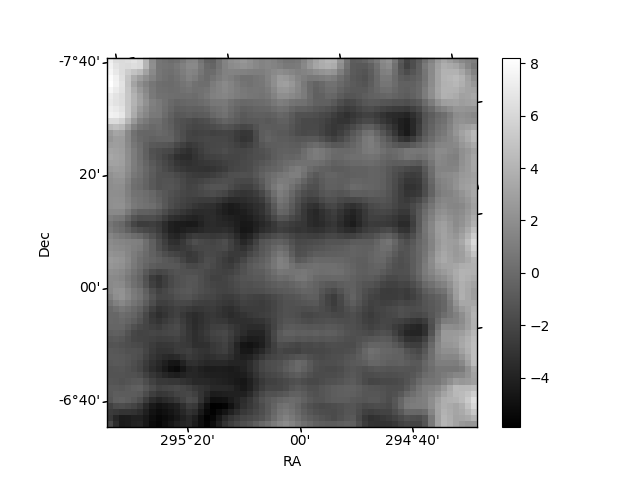
Histogram calculated using DETX and DETY for each event in the final _common_clean file
| Quadrant A | 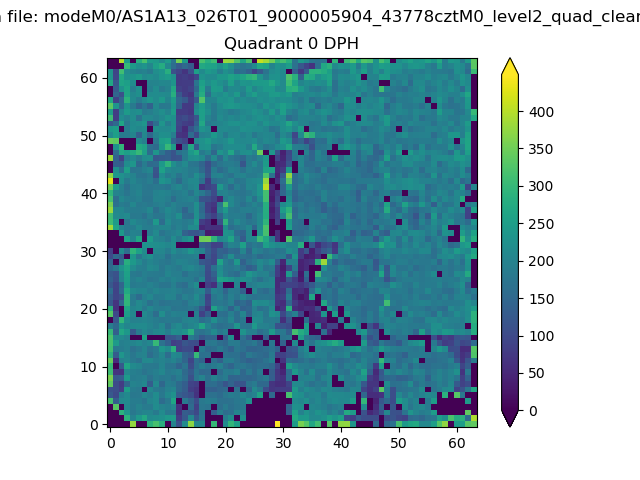 |
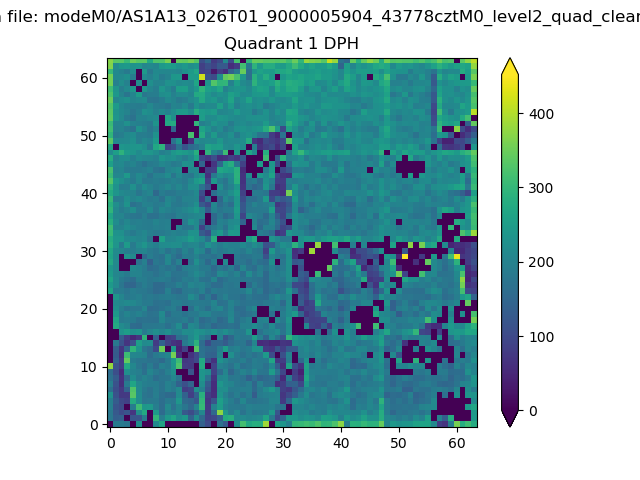 |
Quadrant B |
|---|---|---|---|
| Quadrant D | 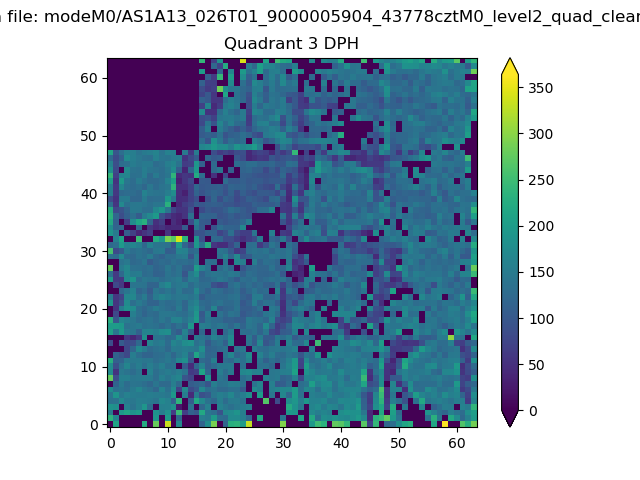 |
 |
Quadrant C |
| Plot type | Count rate plots | Images |
|---|---|---|
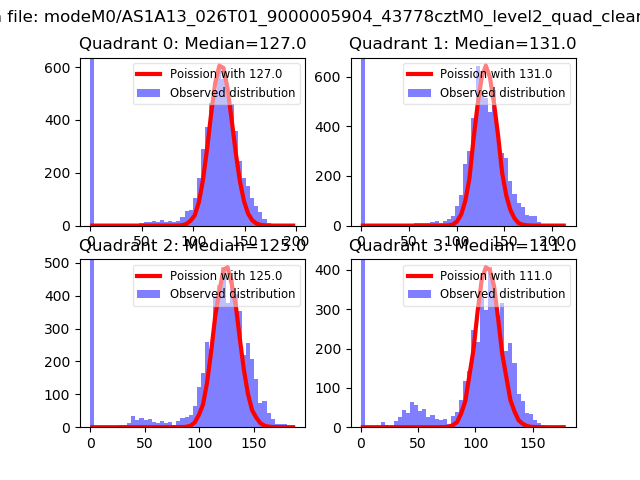
| Comparison with Poisson distribution Blue bars denote a histogram of data divided into 1 sec bins. Red curve is a Poisson curve with rate = median count rate of data. |
 |
 |
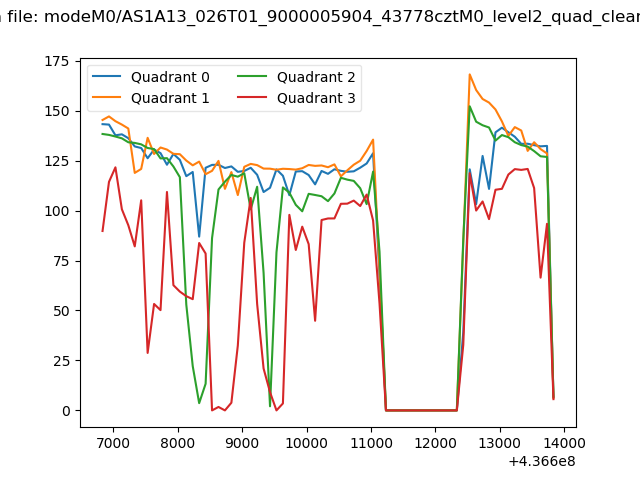
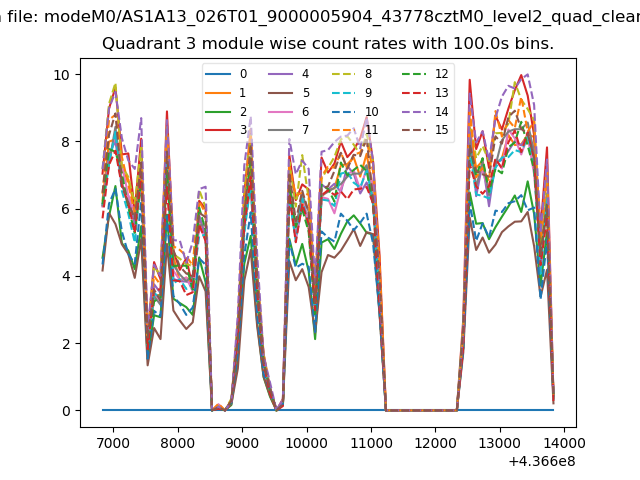
| Quadrant-wise count rates Data is divided into 100 sec bins |
 |
|
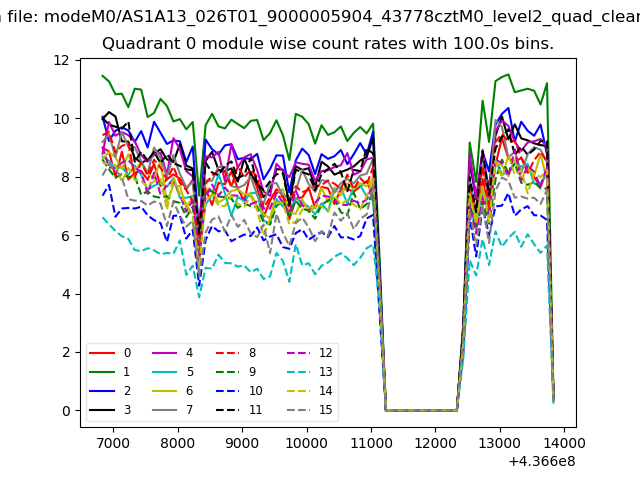
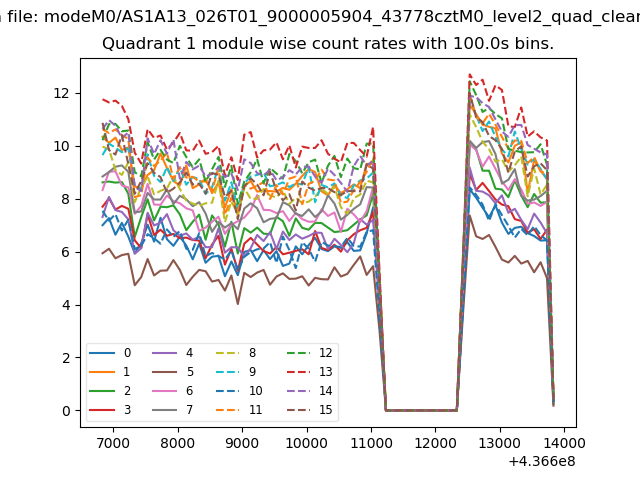
| Module-wise count rates for Quadrant A Data is divided into 100 sec bins |
 |
 |
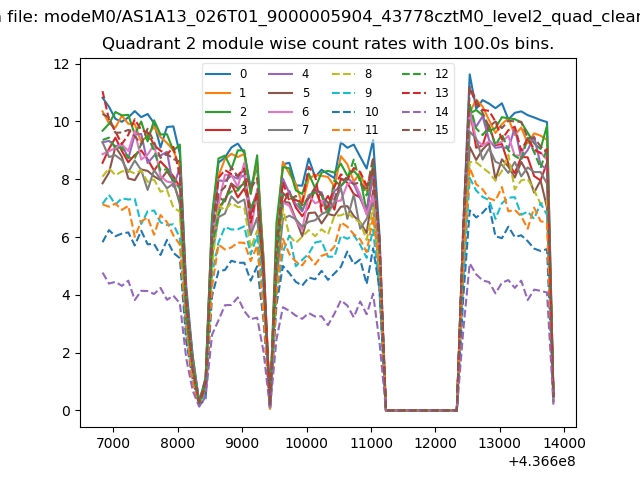
| Module-wise count rates for Quadrant B Data is divided into 100 sec bins |
 |
 |
| Module-wise count rates for Quadrant C Data is divided into 100 sec bins |
 |
 |
| Module-wise count rates for Quadrant D Data is divided into 100 sec bins |
 |
 |
| Parameter | Plot |
|---|---|
| CZT HV Monitor | 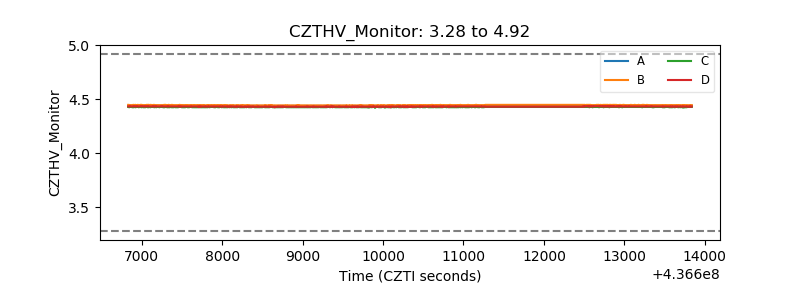 |
| D_VDD | 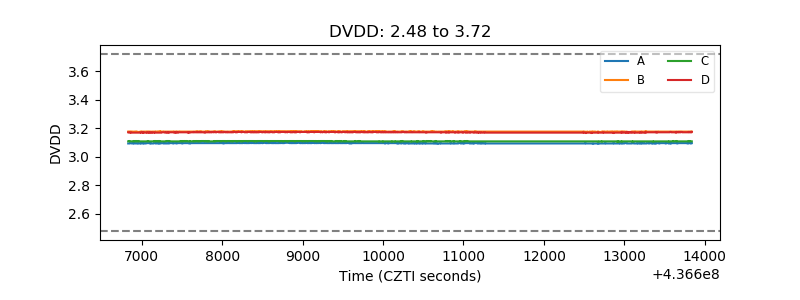 |
| Temperature 1 | 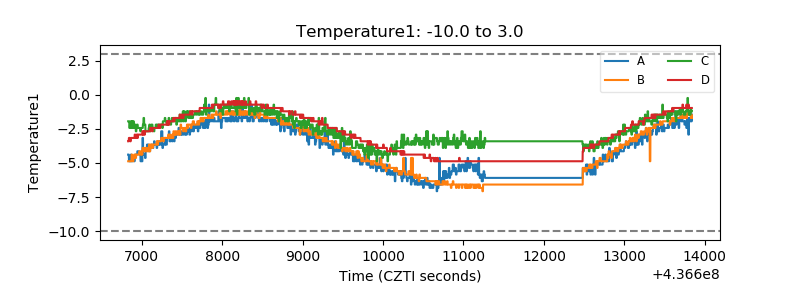 |
| Veto HV Monitor | 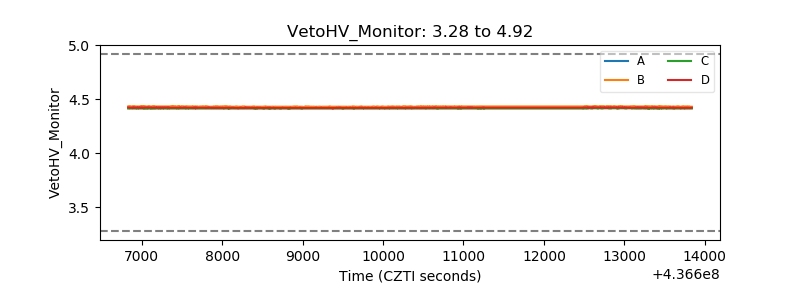 |
| Veto LLD | 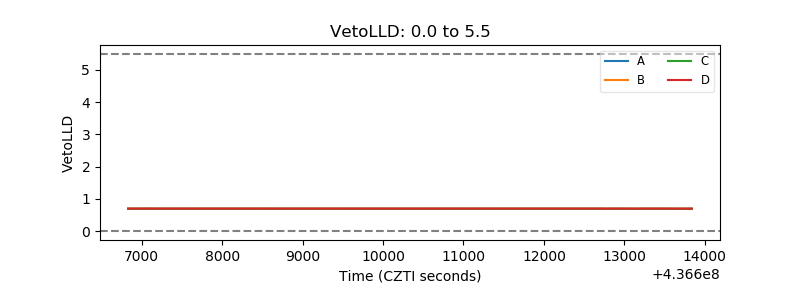 |
| Alpha Counter | 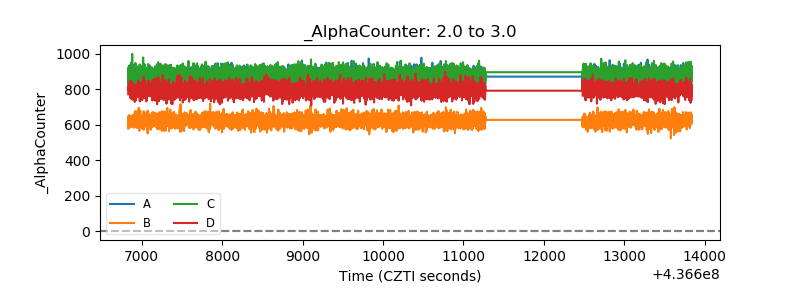 |
| _CPM_Rate | 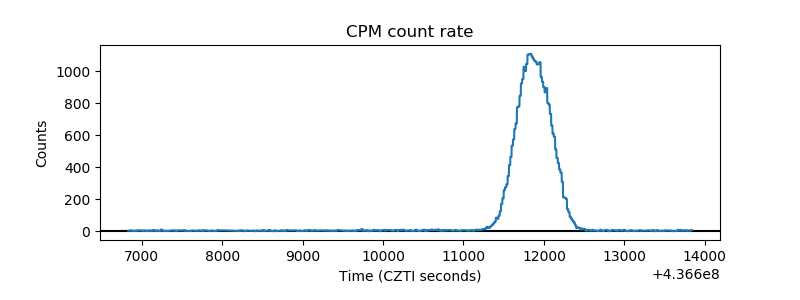 |
| CZT Counter | 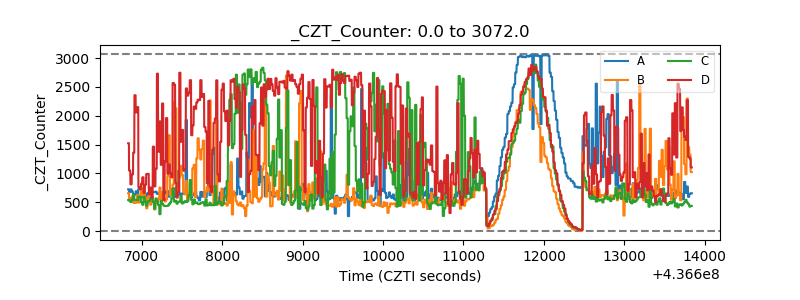 |
| +2.5 Volts monitor |  |
| +5 Volts monitor | 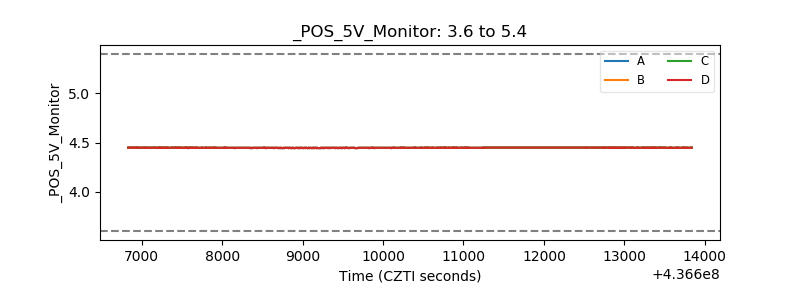 |
| _ROLL_ROT | 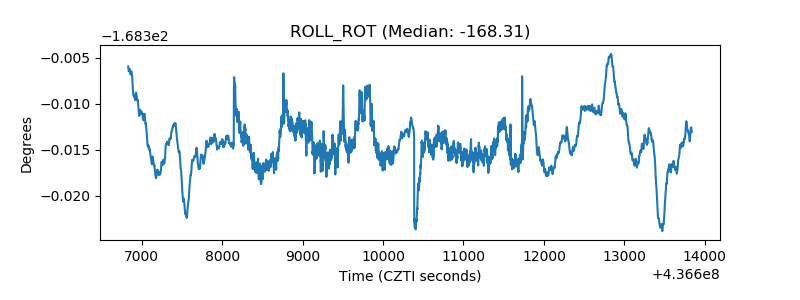 |
| _Roll_DEC | 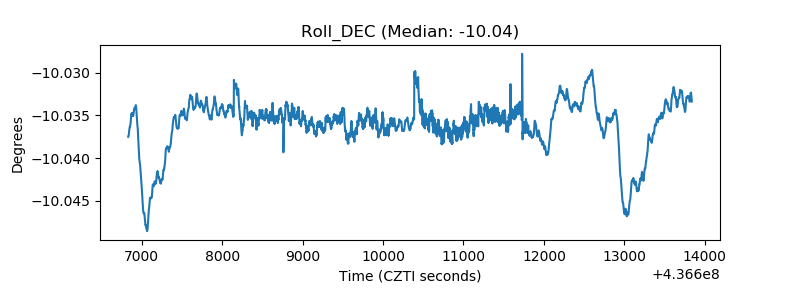 |
| _Roll_RA | 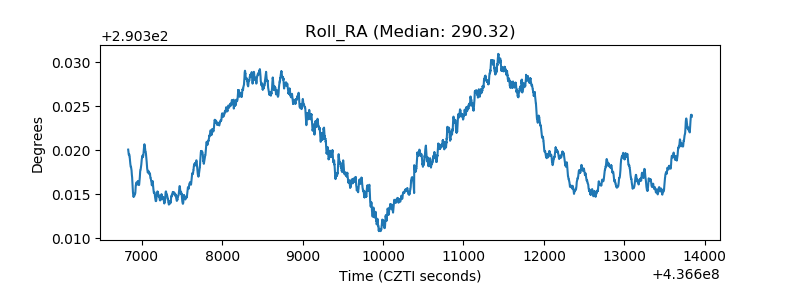 |
| Veto Counter | 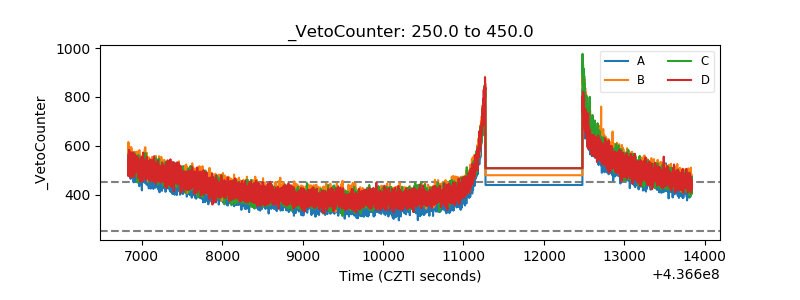 |