| Param | Original file | Final file |
|---|---|---|
| Filename | modeM0/AS1A13_026T01_9000005904_43779cztM0_level2.fits | modeM0/AS1A13_026T01_9000005904_43779cztM0_level2_quad_clean.evt |
| Size (bytes) | 732,539,520 | 105,600,960 |
| Size | 698.6 MB | 100.7 MB |
| Events in quadrant A | 5,584,076 | 754,860 |
| Events in quadrant B | 4,916,337 | 810,588 |
| Events in quadrant C | 5,431,038 | 730,299 |
| Events in quadrant D | 10,684,985 | 451,432 |
| Mode M0 | |||
|---|---|---|---|
| Quadrant | BADHDUFLAG | Total packets | Discarded packets |
| A | 0 | 21577 | 2 |
| B | 0 | 19034 | 2 |
| C | 0 | 20290 | 2 |
| D | 0 | 36188 | 2 |
| Mode SS | |||
|---|---|---|---|
| Quadrant | BADHDUFLAG | Total packets | Discarded packets |
| A | 0 | 130 | 0 |
| B | 0 | 130 | 0 |
| C | 0 | 130 | 0 |
| D | 0 | 130 | 0 |
| Mode M9 | |||
|---|---|---|---|
| Quadrant | BADHDUFLAG | Total packets | Discarded packets |
| A | 0 | 12 | 0 |
| B | 0 | 13 | 0 |
| C | 0 | 13 | 0 |
| D | 0 | 13 | 0 |
| Quadrant | Total seconds | Saturated seconds | Saturation percentage |
|---|---|---|---|
| A | 6459 | 643 | 9.955101% |
| B | 6459 | 399 | 6.177427% |
| C | 6459 | 713 | 11.038861% |
| D | 6459 | 2809 | 43.489704% |
Noise dominated data is calculated using 1-second bins in cleaned event files. If a bin has >2000 counts, and if more than 50% of those come from <1% of pixels, then it is considered to be noise-dominated and hence unusable.
| Quadrant | # 1 sec bins | Bins with >0 counts | Bins with >2000 counts | High rate bins dominated by noise | Noise dominated (total time) | Noise dominated (detector-on time) | Marked lightcurve |
|---|---|---|---|---|---|---|---|
| A | 7609 | 6460 | 265 | 265 | 3.48% | 4.10% | 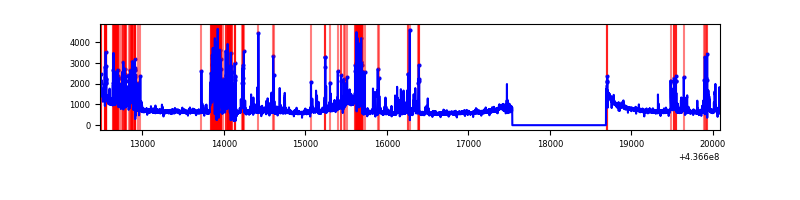 |
| B | 7609 | 6460 | 172 | 172 | 2.26% | 2.66% | 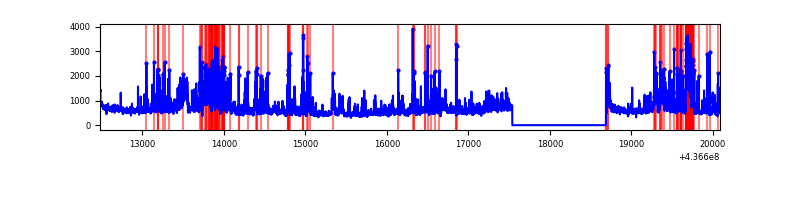 |
| C | 7609 | 6460 | 599 | 599 | 7.87% | 9.27% | 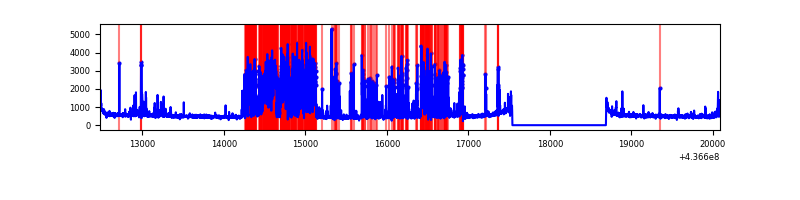 |
| D | 7609 | 6460 | 2460 | 2460 | 32.33% | 38.08% | 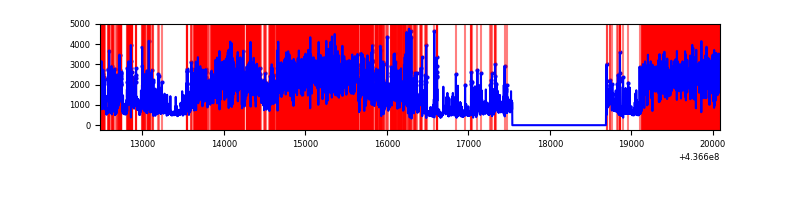 |
Top three noisy pixels from each quadrant. If the there are fewer than three noisy pixels in the level2.evt file, extra rows are filled as -1
| Pixel properties | Quadrant properties | ||||||
|---|---|---|---|---|---|---|---|
| Quadrant | DetID | PixID | Counts | Sigma | Mean | Median | Sigma |
| A | 15 | 223 | 1261876 | 7789.54 | 790 | 776 | 161.9 |
| A | 10 | 83 | 1018038 | 6283.41 | 790 | 776 | 161.9 |
| A | 13 | 248 | 154884 | 951.89 | 790 | 776 | 161.9 |
| B | 0 | 200 | 907721 | 5870.23 | 797 | 775 | 154.5 |
| B | 0 | 219 | 157995 | 1017.61 | 797 | 775 | 154.5 |
| B | 5 | 235 | 148681 | 957.33 | 797 | 775 | 154.5 |
| C | 15 | 174 | 1487969 | 8343.95 | 760 | 766 | 178.2 |
| C | 14 | 254 | 347046 | 1942.8 | 760 | 766 | 178.2 |
| C | 15 | 158 | 325877 | 1824.04 | 760 | 766 | 178.2 |
| D | 12 | 33 | 4637902 | 27207.01 | 675 | 655 | 170.4 |
| D | 10 | 102 | 1641747 | 9628.39 | 675 | 655 | 170.4 |
| D | 5 | 235 | 436069 | 2554.6 | 675 | 655 | 170.4 |
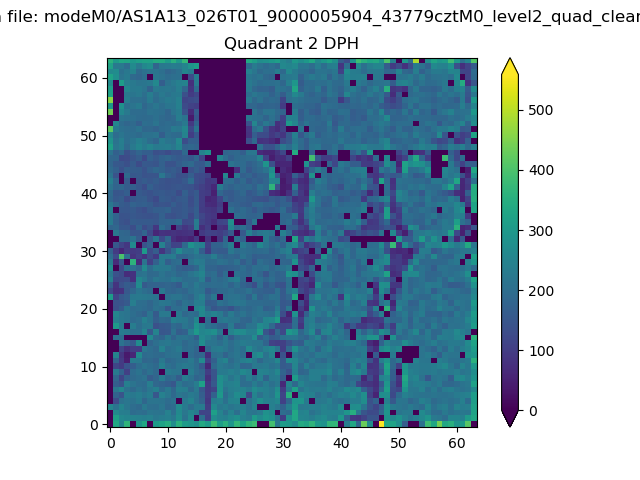
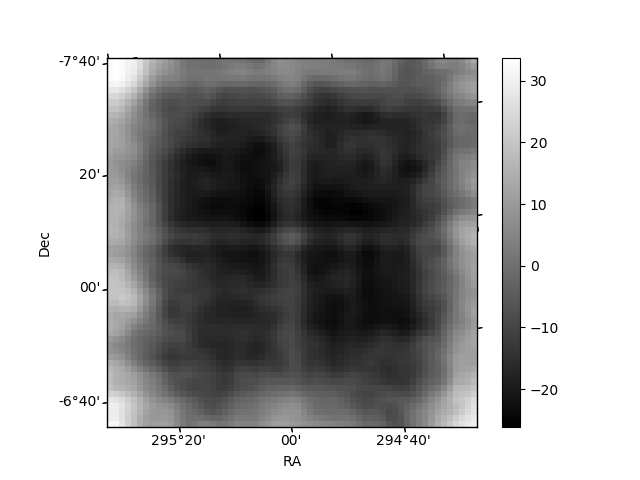
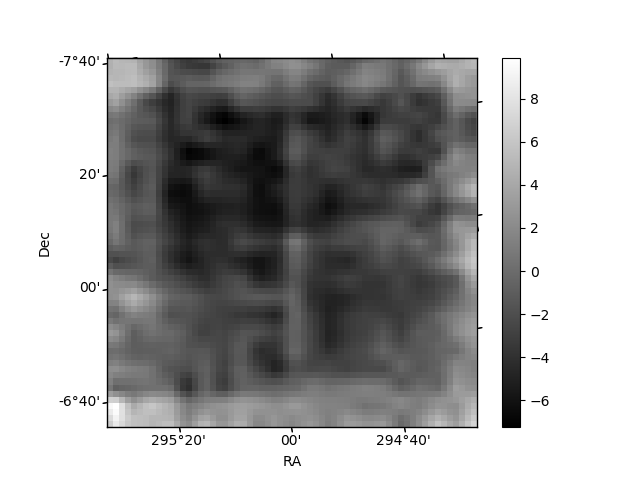
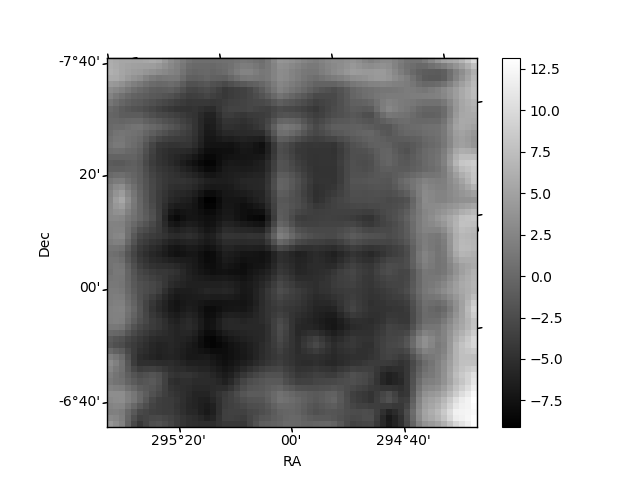
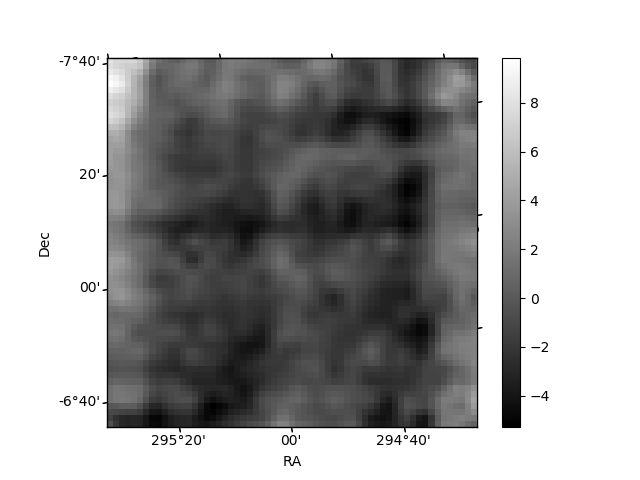
Histogram calculated using DETX and DETY for each event in the final _common_clean file
| Quadrant A | 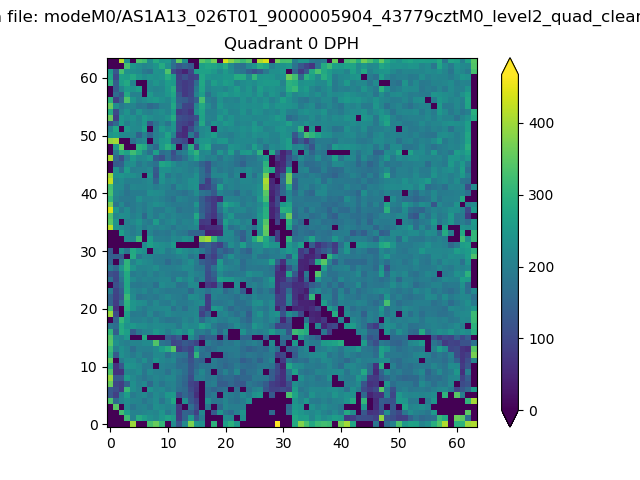 |
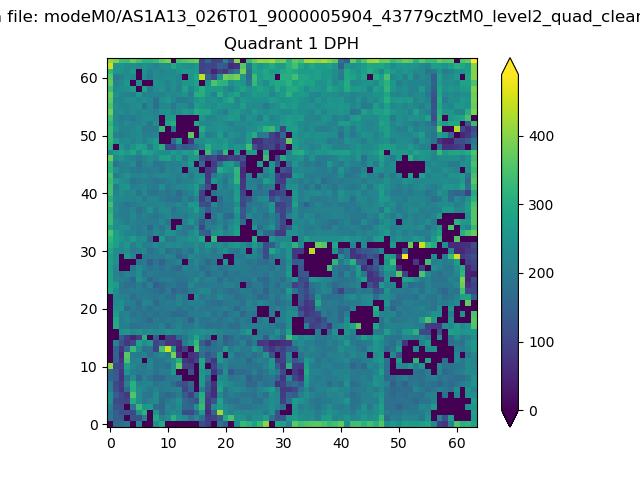 |
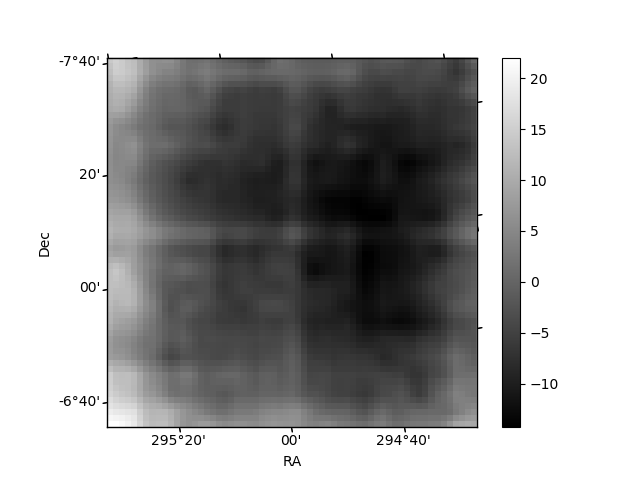
Quadrant B |
|---|---|---|---|
| Quadrant D | 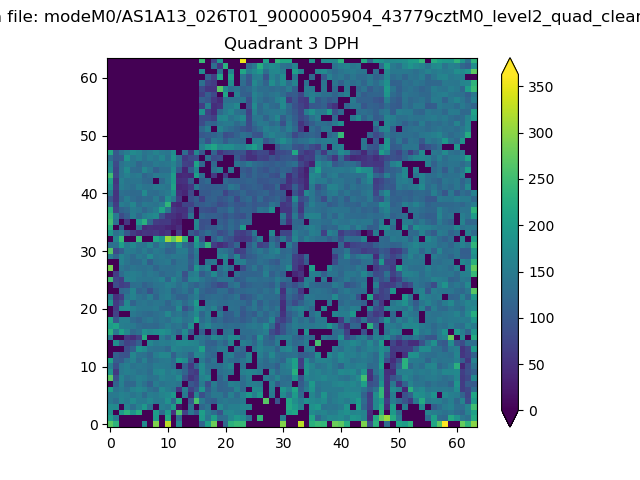 |
 |
Quadrant C |
| Plot type | Count rate plots | Images |
|---|---|---|
| Comparison with Poisson distribution Blue bars denote a histogram of data divided into 1 sec bins. Red curve is a Poisson curve with rate = median count rate of data. |
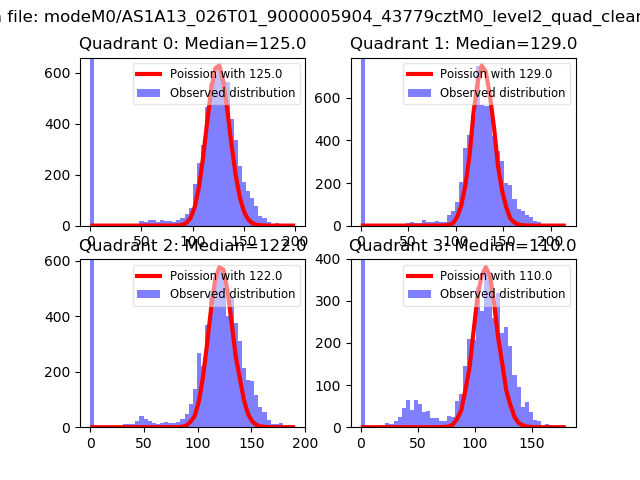 |
 |
| Quadrant-wise count rates Data is divided into 100 sec bins |
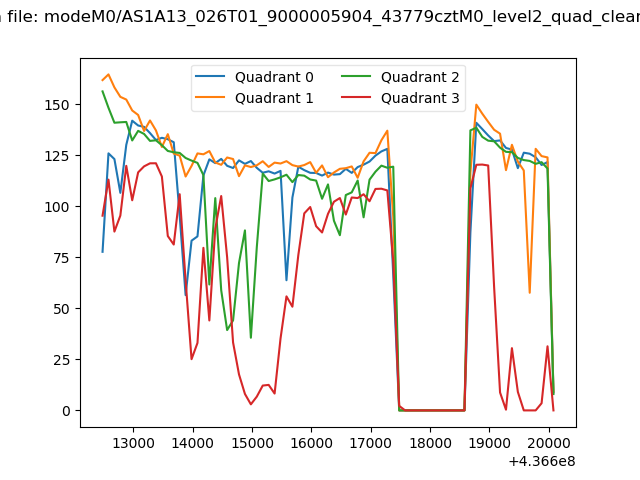 |
|
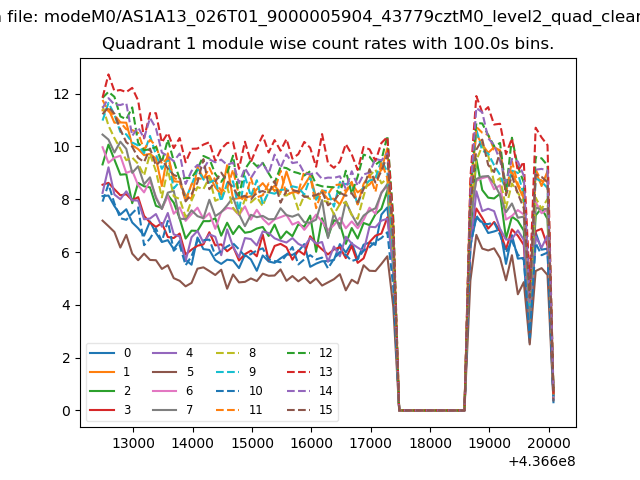
| Module-wise count rates for Quadrant A Data is divided into 100 sec bins |
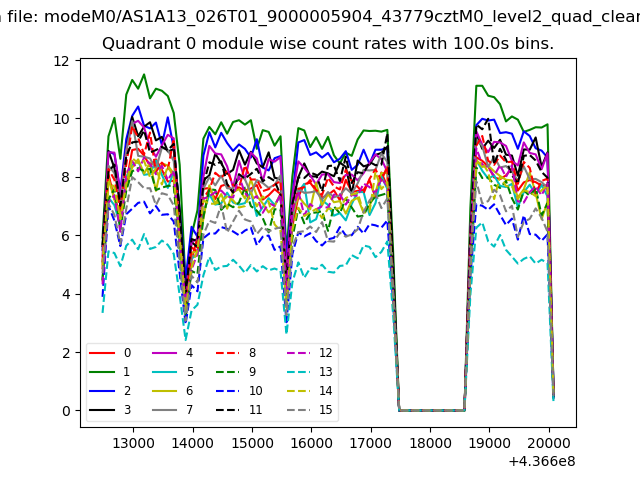 |
 |
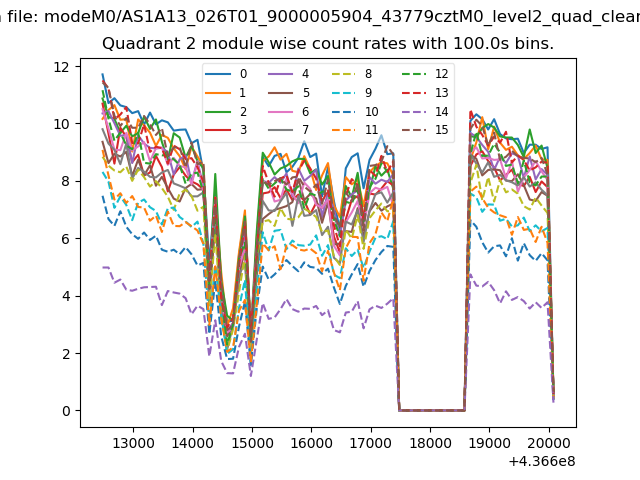
| Module-wise count rates for Quadrant B Data is divided into 100 sec bins |
 |
 |
| Module-wise count rates for Quadrant C Data is divided into 100 sec bins |
 |
 |
| Module-wise count rates for Quadrant D Data is divided into 100 sec bins |
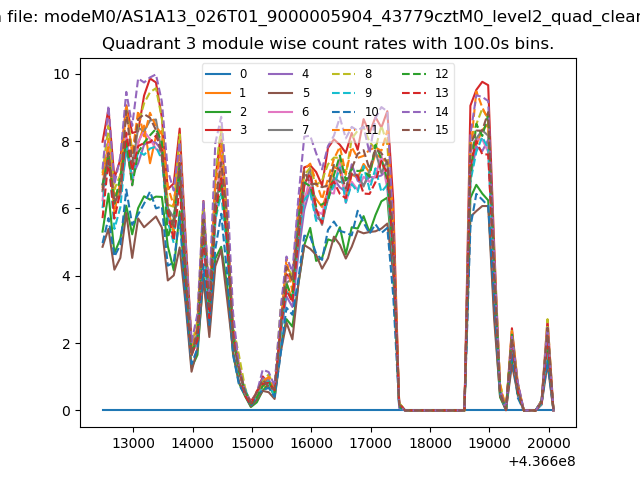 |
 |
| Parameter | Plot |
|---|---|
| CZT HV Monitor | 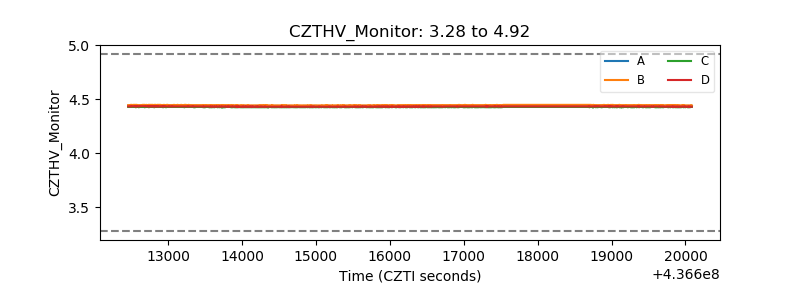 |
| D_VDD | 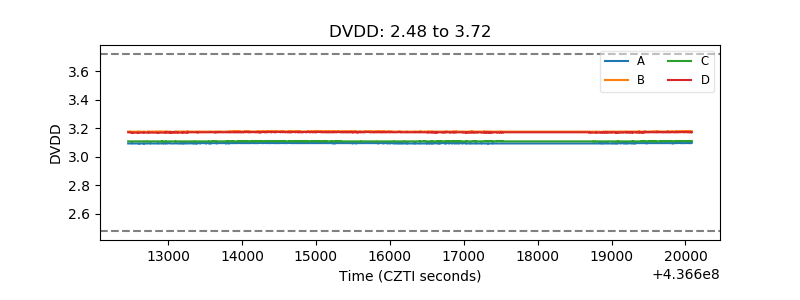 |
| Temperature 1 | 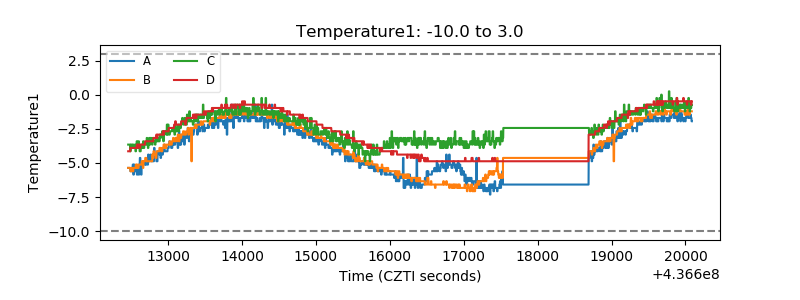 |
| Veto HV Monitor | 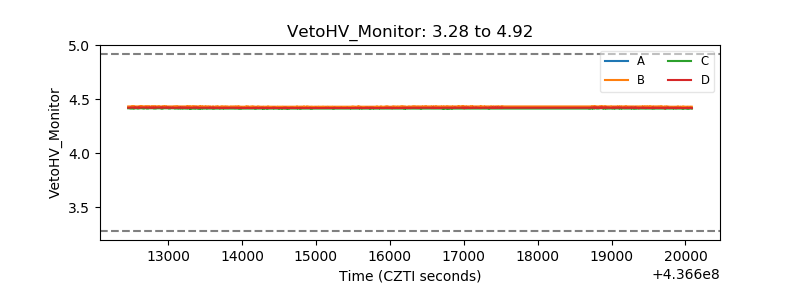 |
| Veto LLD | 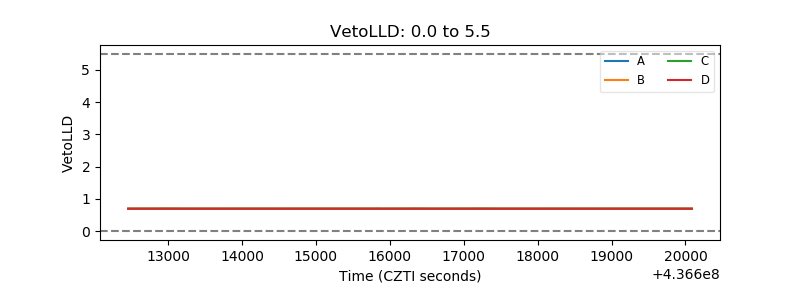 |
| Alpha Counter | 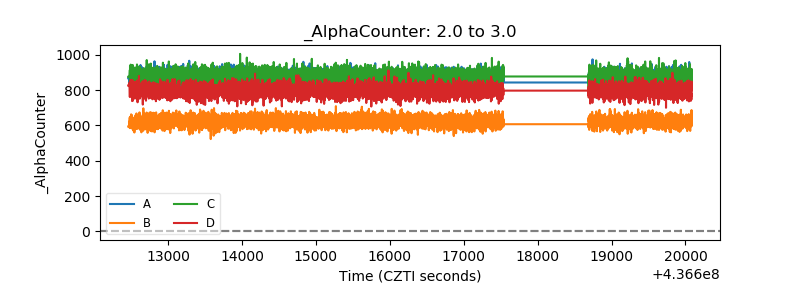 |
| _CPM_Rate | 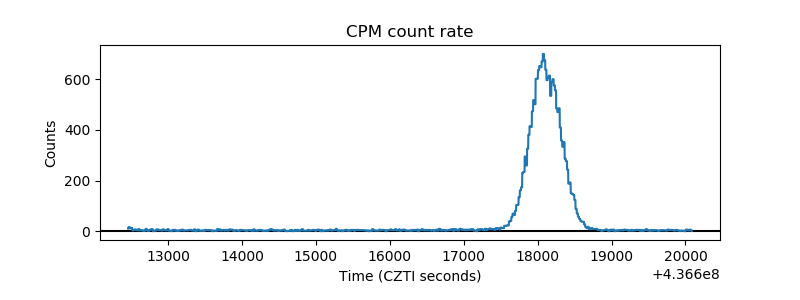 |
| CZT Counter | 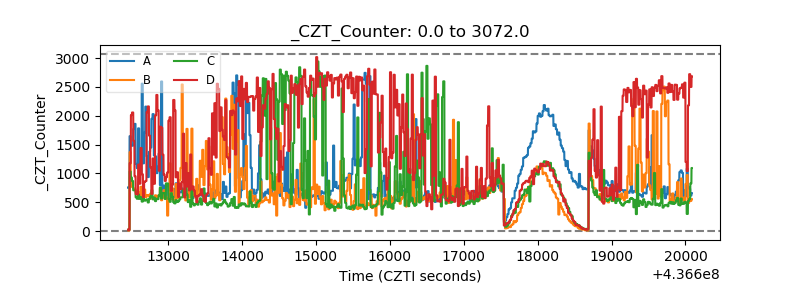 |
| +2.5 Volts monitor | 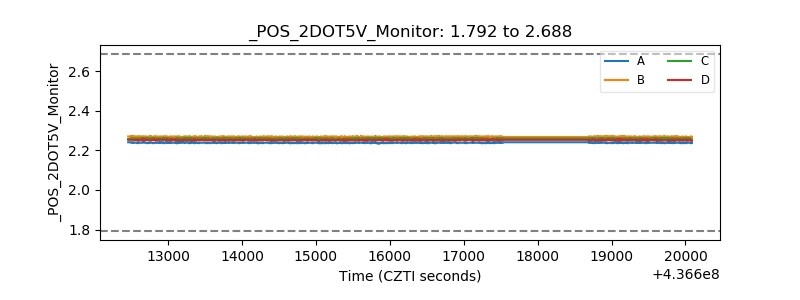 |
| +5 Volts monitor | 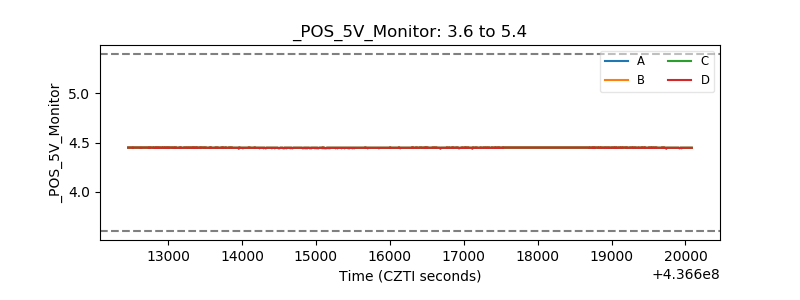 |
| _ROLL_ROT | 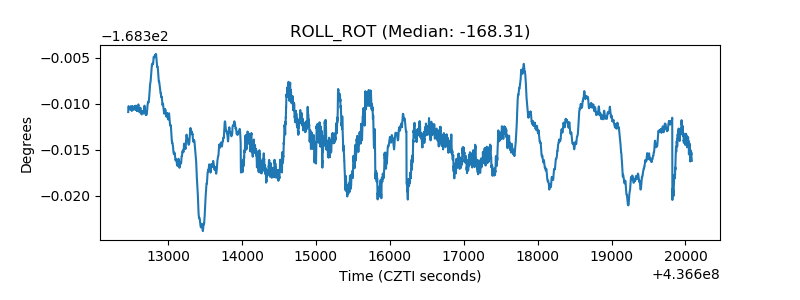 |
| _Roll_DEC |  |
| _Roll_RA | 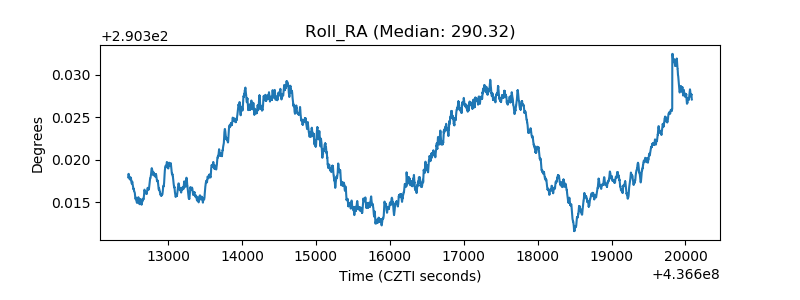 |
| Veto Counter | 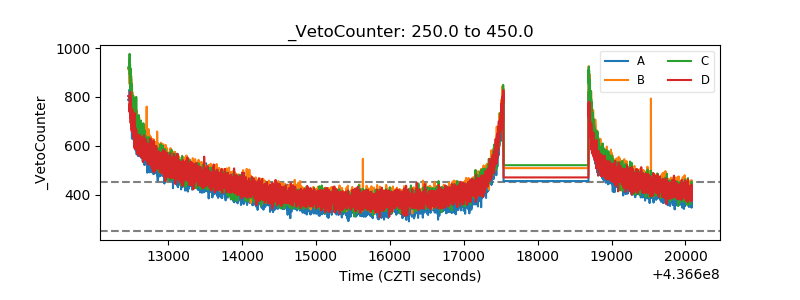 |