| Param | Original file | Final file |
|---|---|---|
| Filename | modeM0/AS1A13_026T01_9000005904_43780cztM0_level2.fits | modeM0/AS1A13_026T01_9000005904_43780cztM0_level2_quad_clean.evt |
| Size (bytes) | 782,645,760 | 92,620,800 |
| Size | 746.4 MB | 88.3 MB |
| Events in quadrant A | 4,997,915 | 743,154 |
| Events in quadrant B | 4,755,881 | 753,306 |
| Events in quadrant C | 4,036,716 | 737,789 |
| Events in quadrant D | 14,676,022 | 116,800 |
| Mode M0 | |||
|---|---|---|---|
| Quadrant | BADHDUFLAG | Total packets | Discarded packets |
| A | 0 | 19720 | 1 |
| B | 0 | 18554 | 1 |
| C | 0 | 16228 | 1 |
| D | 0 | 47934 | 1 |
| Mode SS | |||
|---|---|---|---|
| Quadrant | BADHDUFLAG | Total packets | Discarded packets |
| A | 0 | 132 | 0 |
| B | 0 | 132 | 0 |
| C | 0 | 132 | 0 |
| D | 0 | 132 | 0 |
| Mode M9 | |||
|---|---|---|---|
| Quadrant | BADHDUFLAG | Total packets | Discarded packets |
| A | 0 | 11 | 0 |
| B | 0 | 11 | 0 |
| C | 0 | 11 | 0 |
| D | 0 | 11 | 0 |
| Quadrant | Total seconds | Saturated seconds | Saturation percentage |
|---|---|---|---|
| A | 6498 | 304 | 4.678363% |
| B | 6499 | 428 | 6.585629% |
| C | 6499 | 249 | 3.831359% |
| D | 6499 | 5564 | 85.613171% |
Noise dominated data is calculated using 1-second bins in cleaned event files. If a bin has >2000 counts, and if more than 50% of those come from <1% of pixels, then it is considered to be noise-dominated and hence unusable.
| Quadrant | # 1 sec bins | Bins with >0 counts | Bins with >2000 counts | High rate bins dominated by noise | Noise dominated (total time) | Noise dominated (detector-on time) | Marked lightcurve |
|---|---|---|---|---|---|---|---|
| A | 7568 | 6499 | 185 | 185 | 2.44% | 2.85% | 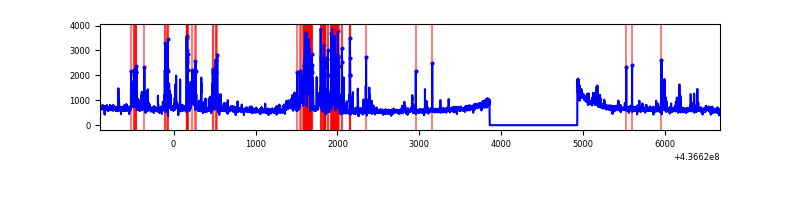 |
| B | 7569 | 6500 | 250 | 250 | 3.30% | 3.85% | 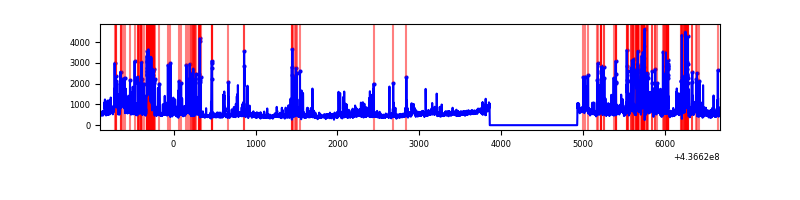 |
| C | 7569 | 6500 | 174 | 174 | 2.30% | 2.68% | 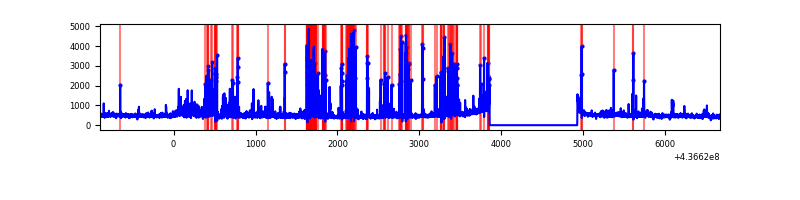 |
| D | 7569 | 6500 | 4794 | 4794 | 63.34% | 73.75% | 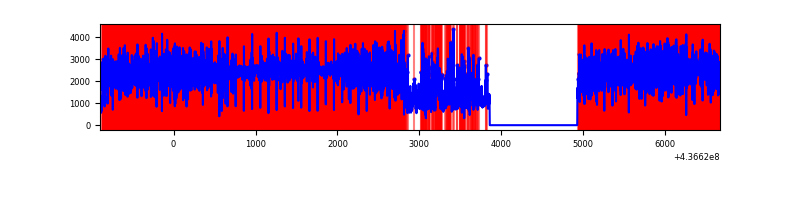 |
Top three noisy pixels from each quadrant. If the there are fewer than three noisy pixels in the level2.evt file, extra rows are filled as -1
| Pixel properties | Quadrant properties | ||||||
|---|---|---|---|---|---|---|---|
| Quadrant | DetID | PixID | Counts | Sigma | Mean | Median | Sigma |
| A | 10 | 83 | 992883 | 6295.94 | 762 | 748 | 157.6 |
| A | 15 | 223 | 863347 | 5473.93 | 762 | 748 | 157.6 |
| A | 13 | 248 | 142946 | 902.37 | 762 | 748 | 157.6 |
| B | 0 | 200 | 725318 | 4954.13 | 751 | 731 | 146.3 |
| B | 5 | 235 | 383172 | 2614.82 | 751 | 731 | 146.3 |
| B | 5 | 172 | 216752 | 1476.97 | 751 | 731 | 146.3 |
| C | 15 | 158 | 456937 | 2632.95 | 736 | 742 | 173.3 |
| C | 14 | 254 | 197014 | 1132.79 | 736 | 742 | 173.3 |
| C | 3 | 233 | 155589 | 893.71 | 736 | 742 | 173.3 |
| D | 12 | 33 | 11081754 | 96846.33 | 438 | 423 | 114.4 |
| D | 5 | 235 | 635477 | 5550.11 | 438 | 423 | 114.4 |
| D | 5 | 222 | 240082 | 2094.52 | 438 | 423 | 114.4 |
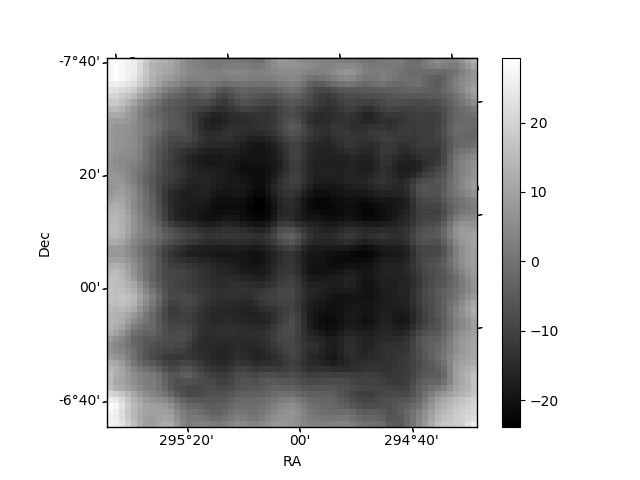
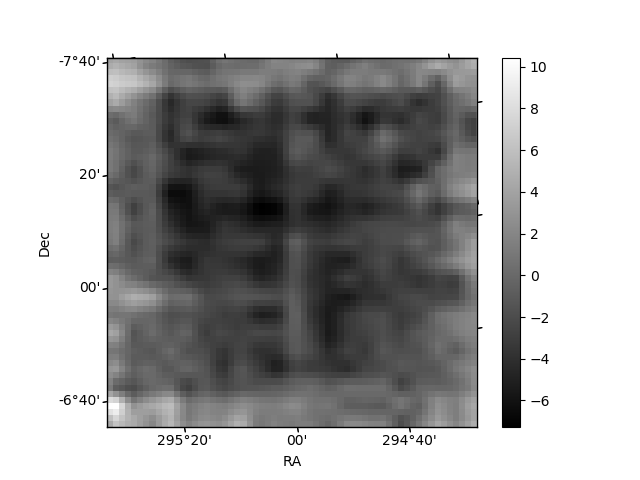
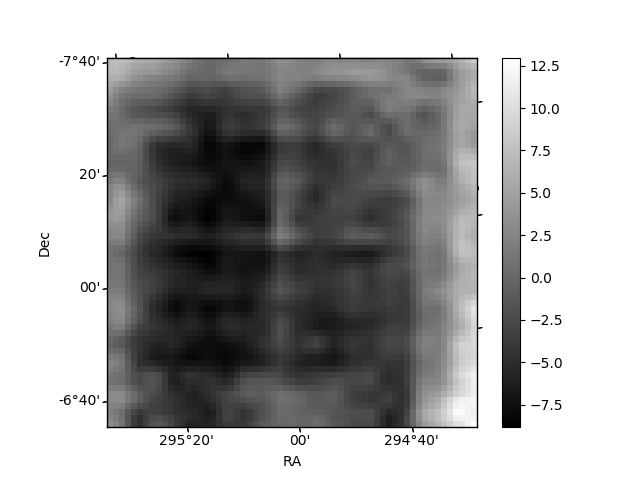
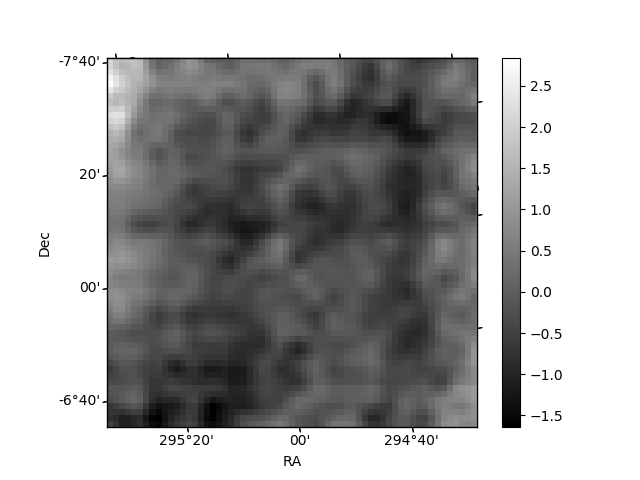
Histogram calculated using DETX and DETY for each event in the final _common_clean file
| Quadrant A | 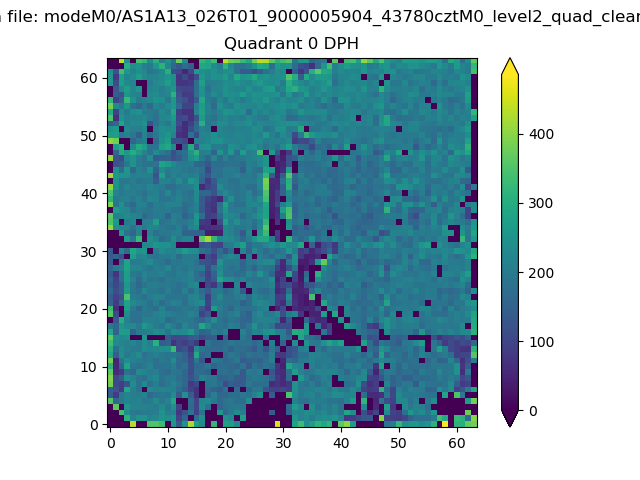 |
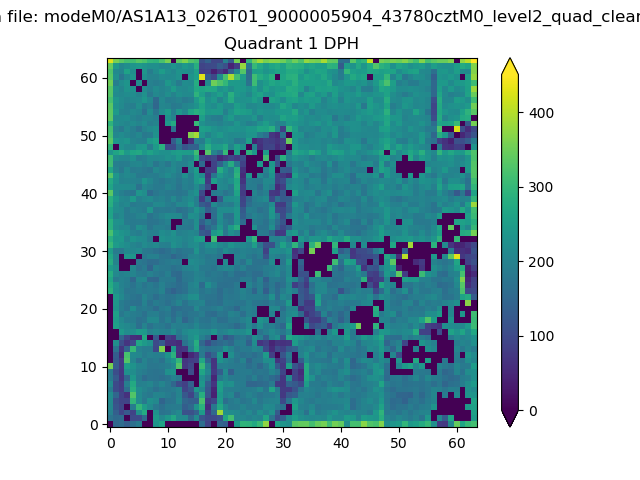 |
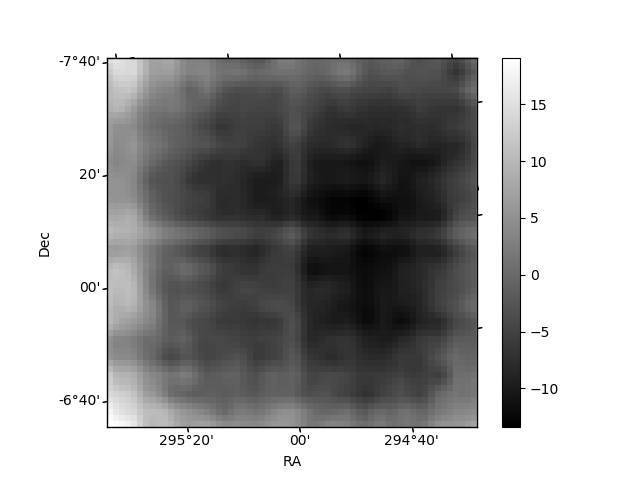
Quadrant B |
|---|---|---|---|
| Quadrant D | 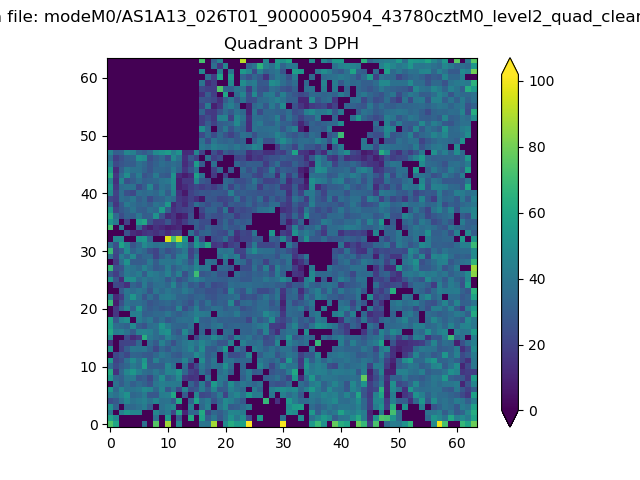 |
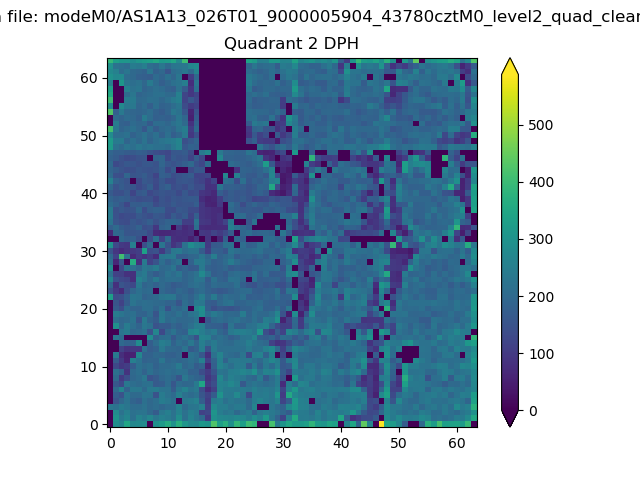 |
Quadrant C |
| Plot type | Count rate plots | Images |
|---|---|---|
| Comparison with Poisson distribution Blue bars denote a histogram of data divided into 1 sec bins. Red curve is a Poisson curve with rate = median count rate of data. |
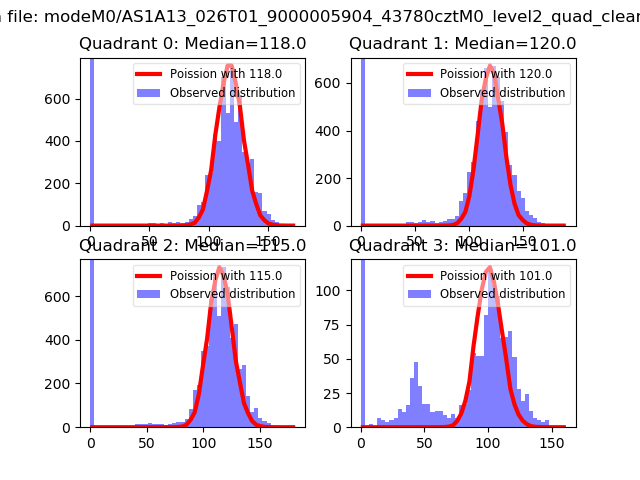 |
 |
| Quadrant-wise count rates Data is divided into 100 sec bins |
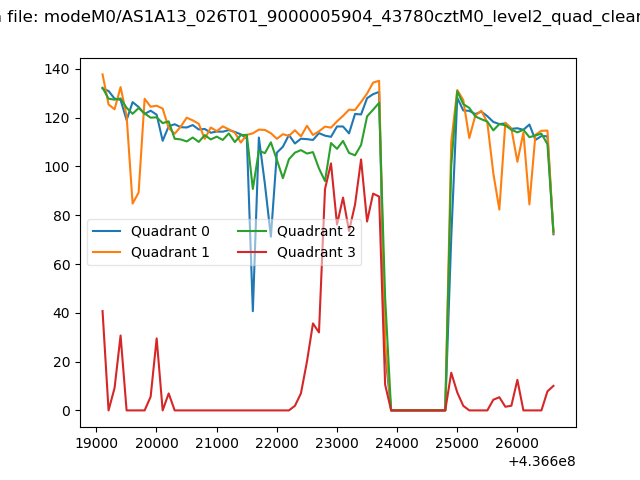 |
|
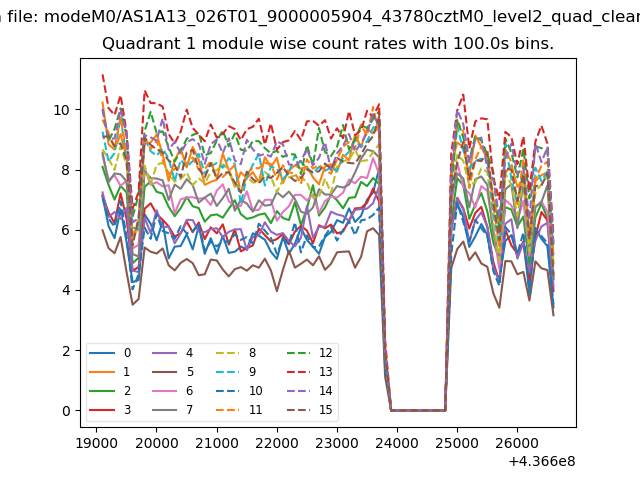
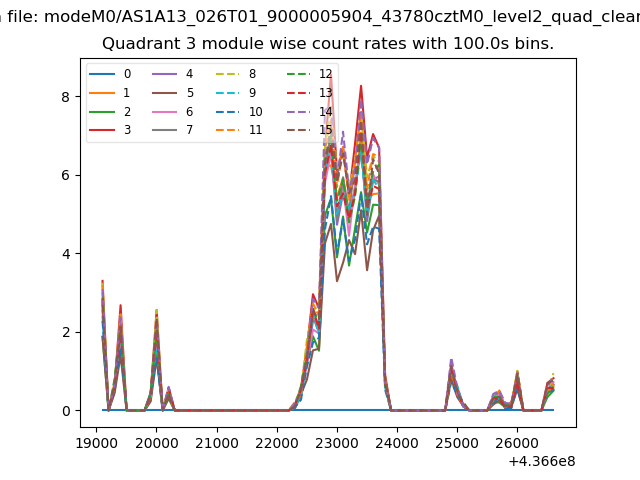
| Module-wise count rates for Quadrant A Data is divided into 100 sec bins |
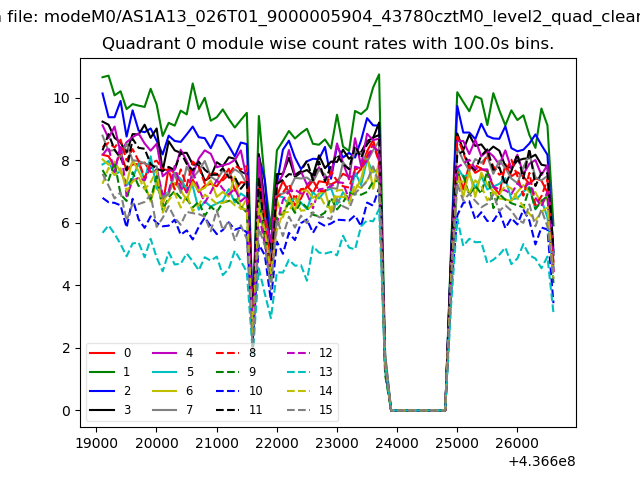 |
 |
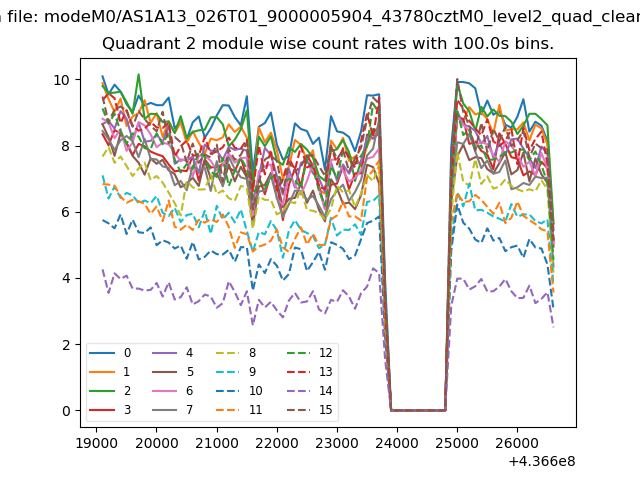
| Module-wise count rates for Quadrant B Data is divided into 100 sec bins |
 |
 |
| Module-wise count rates for Quadrant C Data is divided into 100 sec bins |
 |
 |
| Module-wise count rates for Quadrant D Data is divided into 100 sec bins |
 |
 |
| Parameter | Plot |
|---|---|
| CZT HV Monitor | 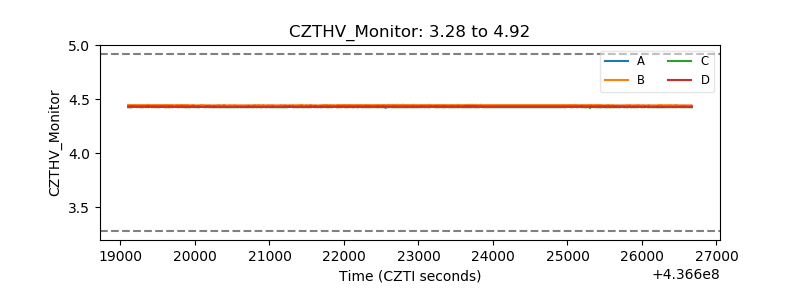 |
| D_VDD | 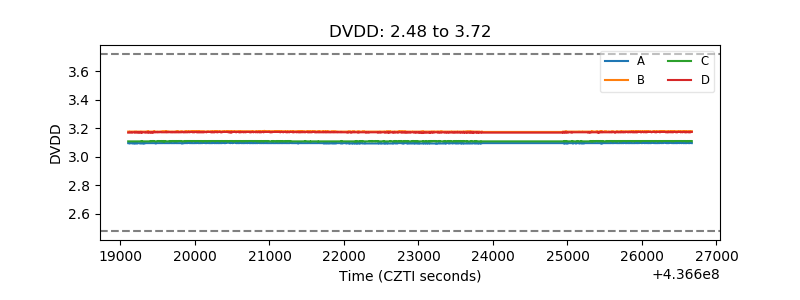 |
| Temperature 1 | 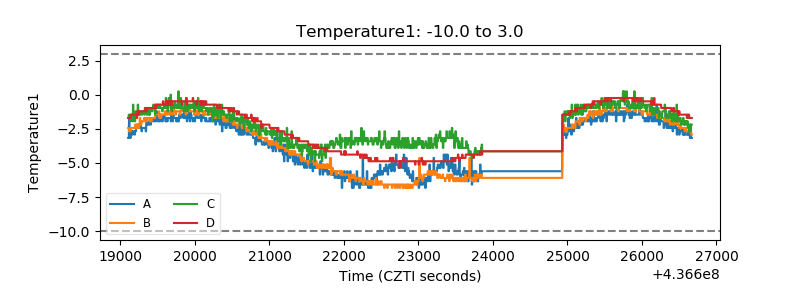 |
| Veto HV Monitor |  |
| Veto LLD | 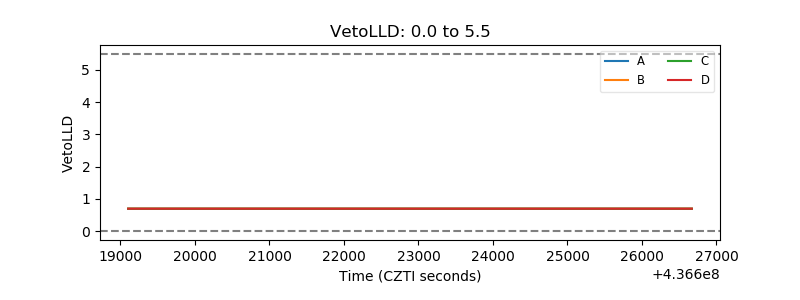 |
| Alpha Counter | 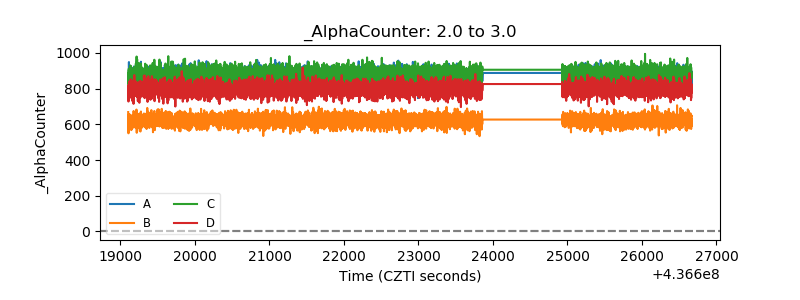 |
| _CPM_Rate | 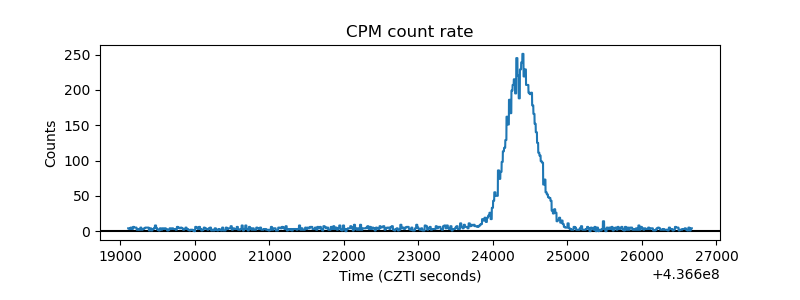 |
| CZT Counter | 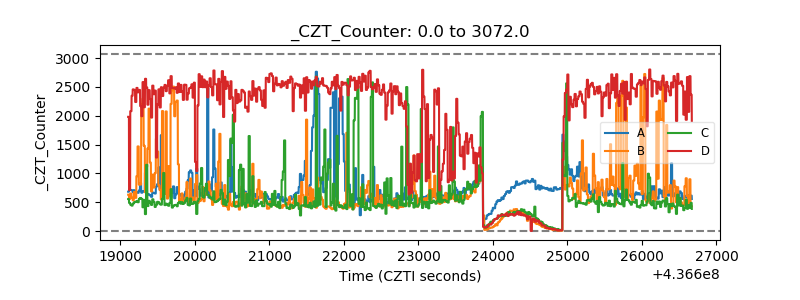 |
| +2.5 Volts monitor | 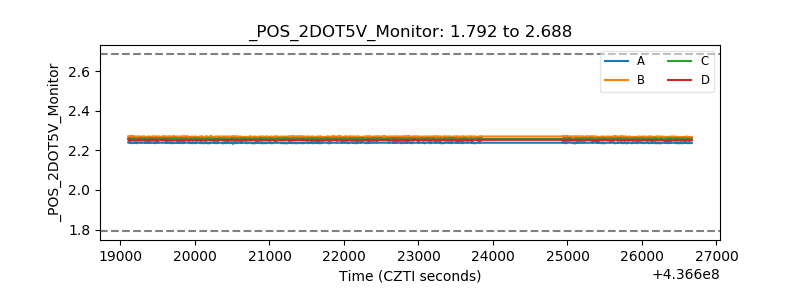 |
| +5 Volts monitor | 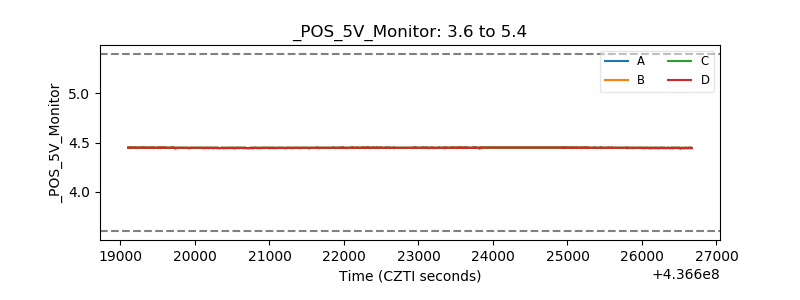 |
| _ROLL_ROT | 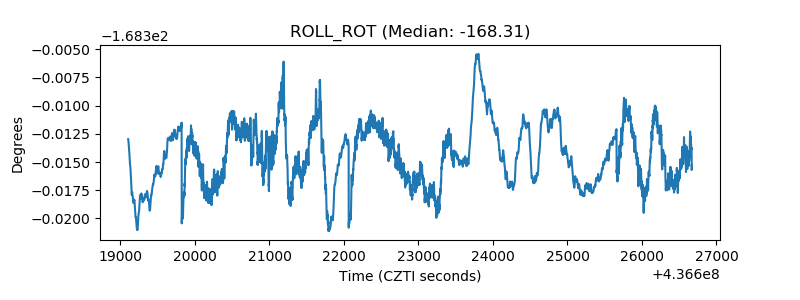 |
| _Roll_DEC | 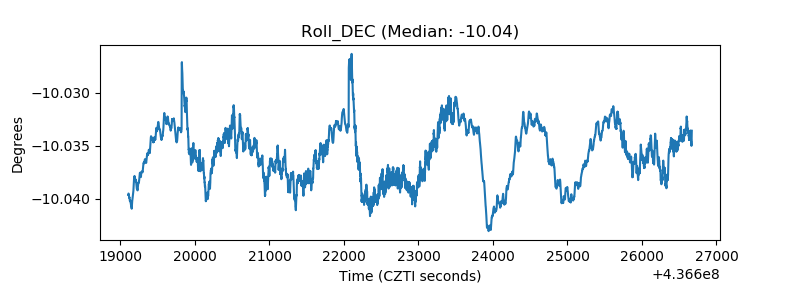 |
| _Roll_RA | 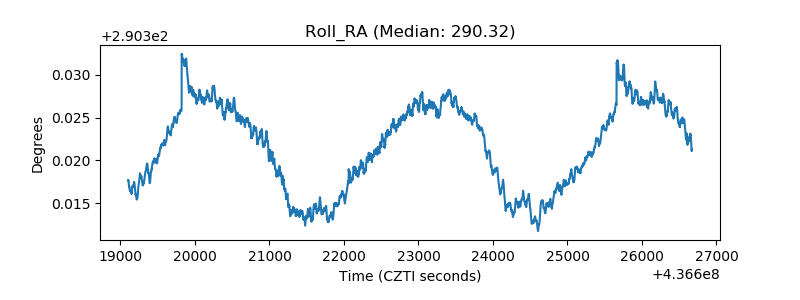 |
| Veto Counter | 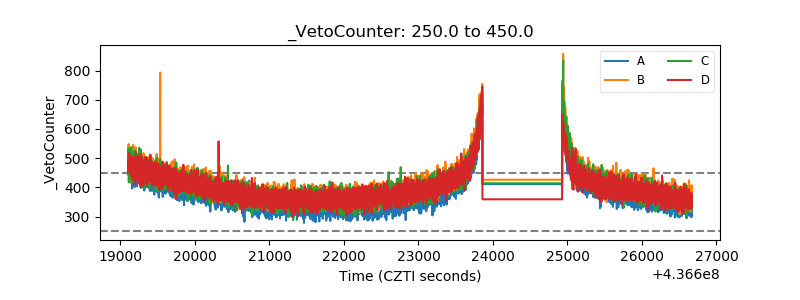 |