| Param | Original file | Final file |
|---|---|---|
| Filename | modeM0/AS1A13_026T01_9000005904_43781cztM0_level2.fits | modeM0/AS1A13_026T01_9000005904_43781cztM0_level2_quad_clean.evt |
| Size (bytes) | 760,481,280 | 96,572,160 |
| Size | 725.3 MB | 92.1 MB |
| Events in quadrant A | 5,838,403 | 684,644 |
| Events in quadrant B | 4,984,143 | 718,399 |
| Events in quadrant C | 4,253,861 | 723,896 |
| Events in quadrant D | 12,561,721 | 335,299 |
| Mode M0 | |||
|---|---|---|---|
| Quadrant | BADHDUFLAG | Total packets | Discarded packets |
| A | 0 | 22090 | 2 |
| B | 0 | 19243 | 2 |
| C | 0 | 17174 | 2 |
| D | 0 | 41828 | 2 |
| Mode SS | |||
|---|---|---|---|
| Quadrant | BADHDUFLAG | Total packets | Discarded packets |
| A | 0 | 136 | 0 |
| B | 0 | 136 | 0 |
| C | 0 | 136 | 0 |
| D | 0 | 136 | 0 |
| Mode M9 | |||
|---|---|---|---|
| Quadrant | BADHDUFLAG | Total packets | Discarded packets |
| A | 0 | 6 | 0 |
| B | 0 | 6 | 0 |
| C | 0 | 6 | 0 |
| D | 0 | 6 | 0 |
| Quadrant | Total seconds | Saturated seconds | Saturation percentage |
|---|---|---|---|
| A | 6613 | 706 | 10.675941% |
| B | 6614 | 548 | 8.285455% |
| C | 6614 | 252 | 3.810100% |
| D | 6614 | 3572 | 54.006653% |
Noise dominated data is calculated using 1-second bins in cleaned event files. If a bin has >2000 counts, and if more than 50% of those come from <1% of pixels, then it is considered to be noise-dominated and hence unusable.
| Quadrant | # 1 sec bins | Bins with >0 counts | Bins with >2000 counts | High rate bins dominated by noise | Noise dominated (total time) | Noise dominated (detector-on time) | Marked lightcurve |
|---|---|---|---|---|---|---|---|
| A | 7308 | 6615 | 410 | 410 | 5.61% | 6.20% | 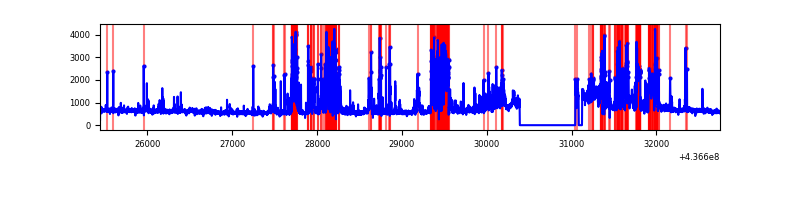 |
| B | 7309 | 6616 | 325 | 325 | 4.45% | 4.91% | 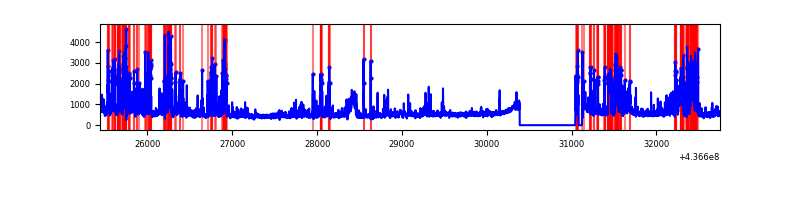 |
| C | 7309 | 6616 | 192 | 192 | 2.63% | 2.90% | 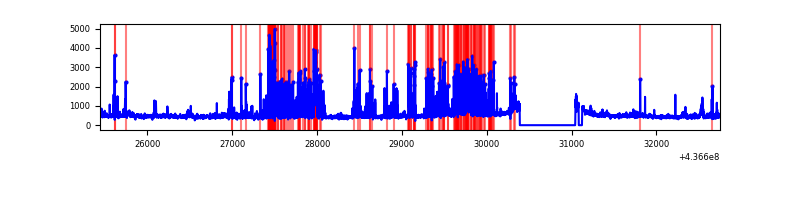 |
| D | 7309 | 6615 | 3263 | 3263 | 44.64% | 49.33% | 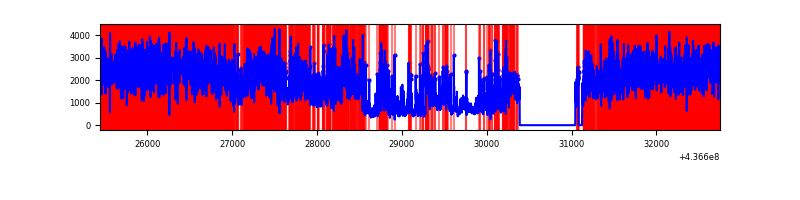 |
Top three noisy pixels from each quadrant. If the there are fewer than three noisy pixels in the level2.evt file, extra rows are filled as -1
| Pixel properties | Quadrant properties | ||||||
|---|---|---|---|---|---|---|---|
| Quadrant | DetID | PixID | Counts | Sigma | Mean | Median | Sigma |
| A | 15 | 223 | 1651788 | 10604.45 | 742 | 726 | 155.7 |
| A | 10 | 83 | 987807 | 6339.83 | 742 | 726 | 155.7 |
| A | 13 | 248 | 242856 | 1555.15 | 742 | 726 | 155.7 |
| B | 5 | 235 | 828030 | 5639.14 | 751 | 730 | 146.7 |
| B | 0 | 200 | 325726 | 2215.28 | 751 | 730 | 146.7 |
| B | 5 | 172 | 304357 | 2069.62 | 751 | 730 | 146.7 |
| C | 15 | 158 | 763616 | 4300.02 | 744 | 748 | 177.4 |
| C | 14 | 254 | 163955 | 919.94 | 744 | 748 | 177.4 |
| C | 3 | 233 | 162568 | 912.12 | 744 | 748 | 177.4 |
| D | 12 | 33 | 7422938 | 47288.53 | 595 | 576 | 157.0 |
| D | 5 | 235 | 1091576 | 6950.86 | 595 | 576 | 157.0 |
| D | 1 | 52 | 422039 | 2685.18 | 595 | 576 | 157.0 |
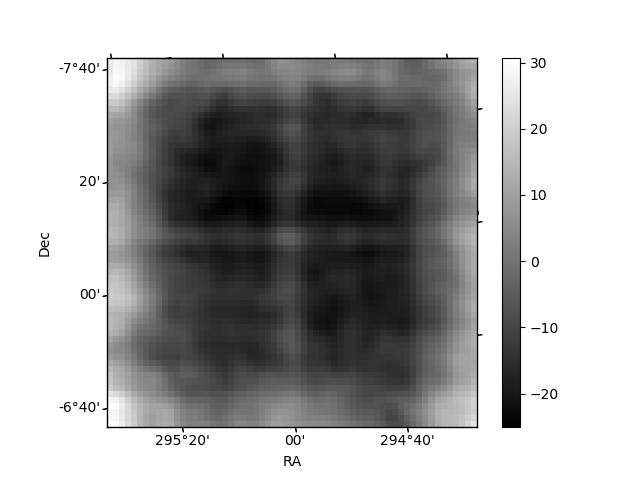
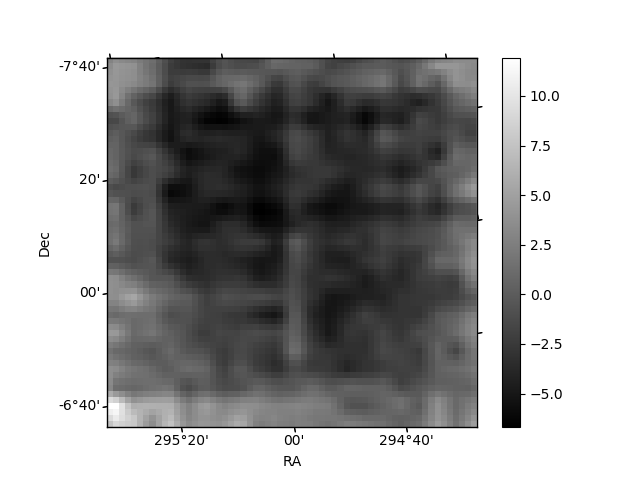
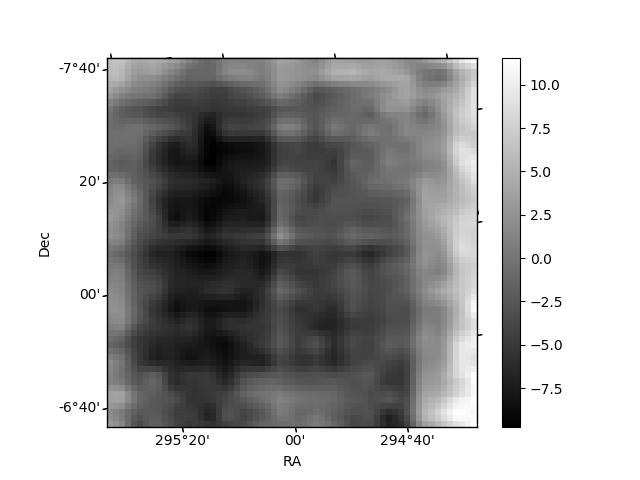
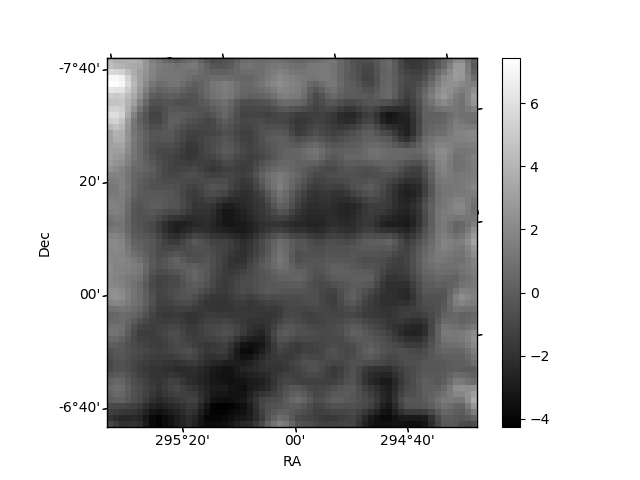
Histogram calculated using DETX and DETY for each event in the final _common_clean file
| Quadrant A | 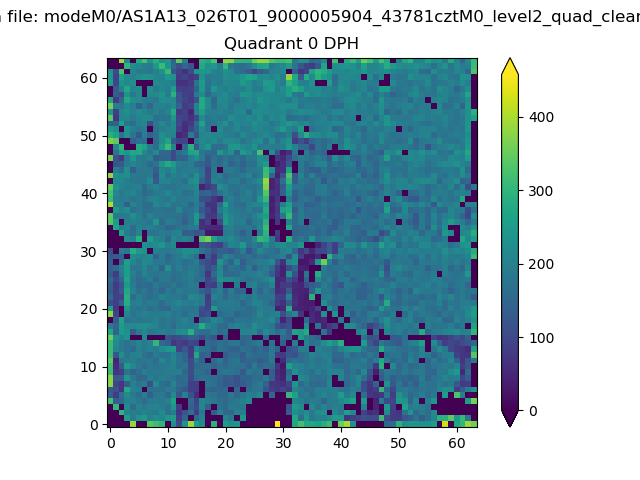 |
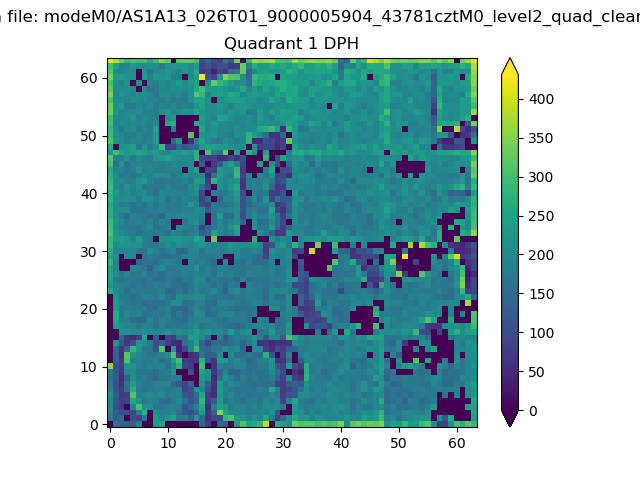 |
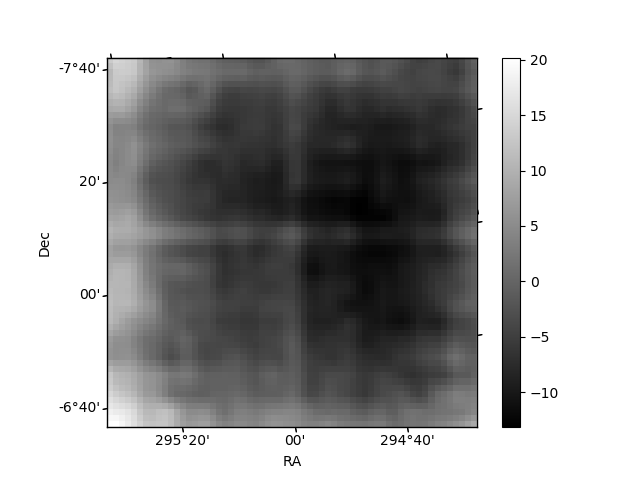
Quadrant B |
|---|---|---|---|
| Quadrant D | 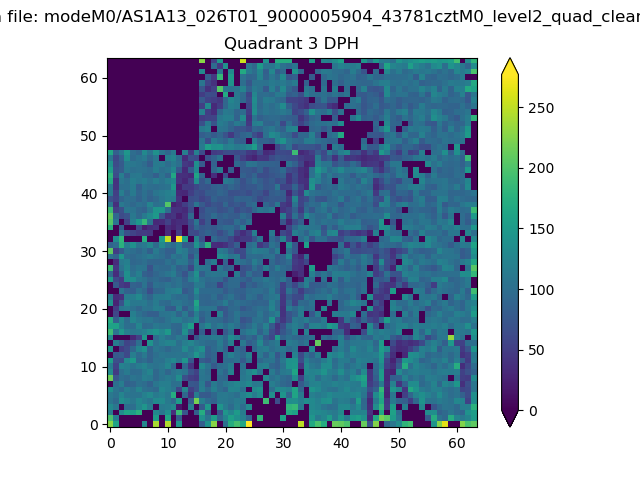 |
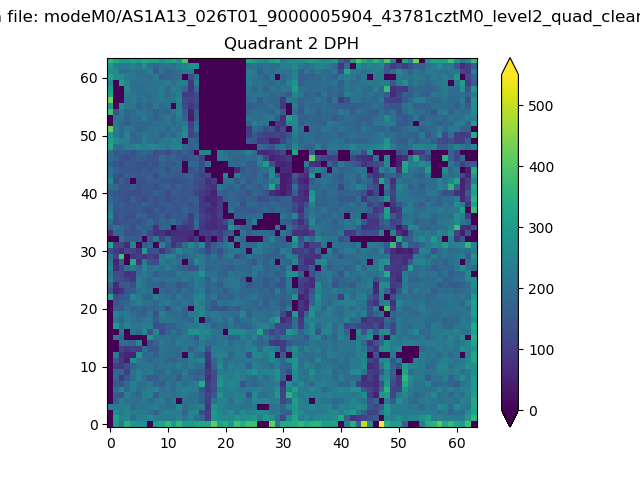 |
Quadrant C |
| Plot type | Count rate plots | Images |
|---|---|---|
| Comparison with Poisson distribution Blue bars denote a histogram of data divided into 1 sec bins. Red curve is a Poisson curve with rate = median count rate of data. |
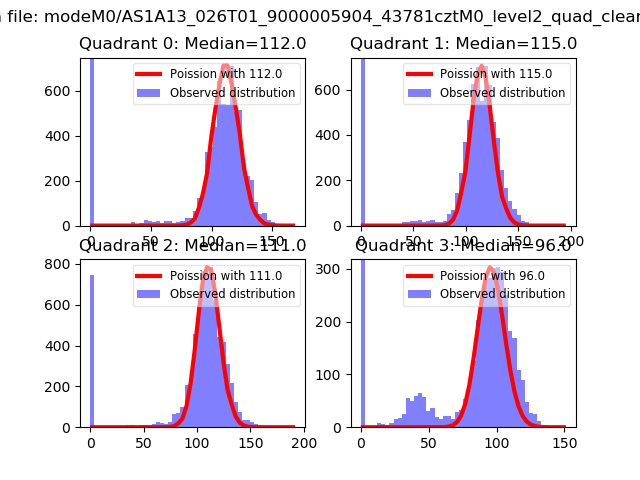 |
 |
| Quadrant-wise count rates Data is divided into 100 sec bins |
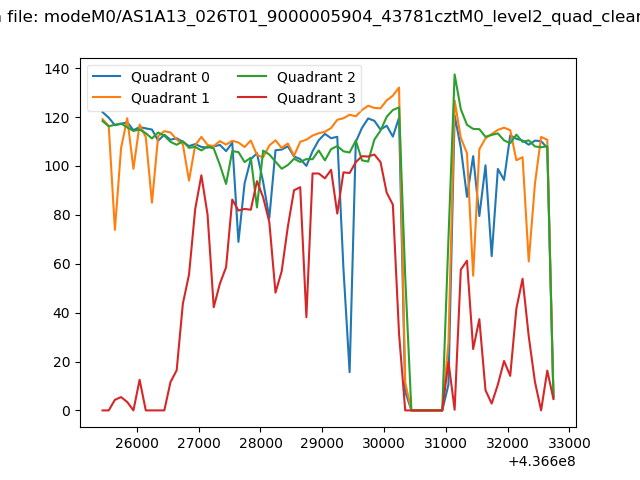 |
|
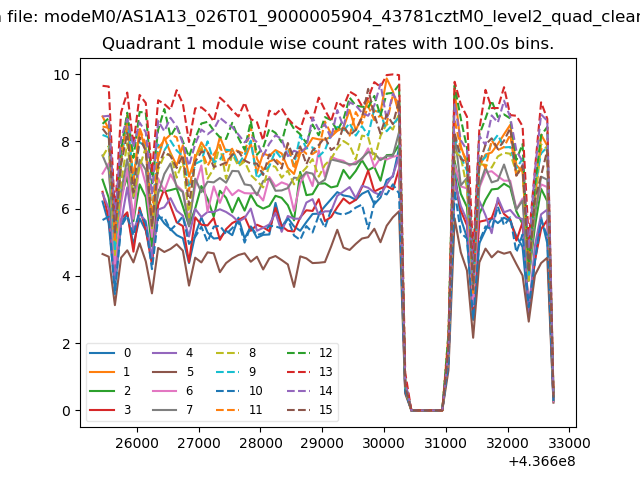
| Module-wise count rates for Quadrant A Data is divided into 100 sec bins |
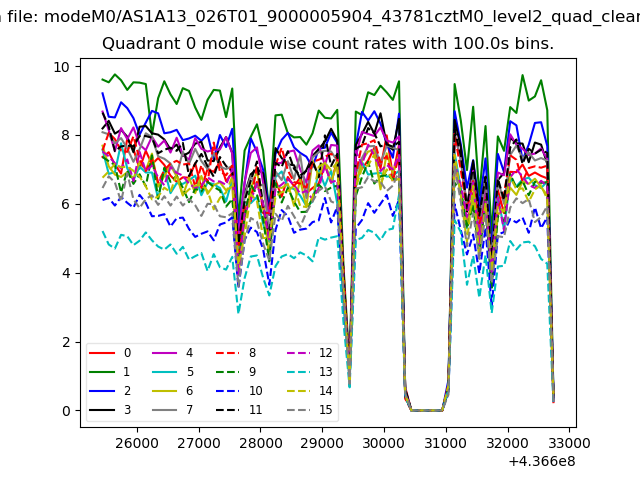 |
 |
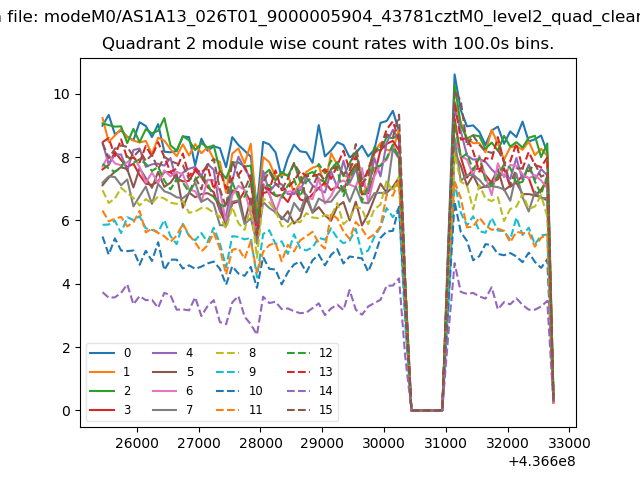
| Module-wise count rates for Quadrant B Data is divided into 100 sec bins |
 |
 |
| Module-wise count rates for Quadrant C Data is divided into 100 sec bins |
 |
 |
| Module-wise count rates for Quadrant D Data is divided into 100 sec bins |
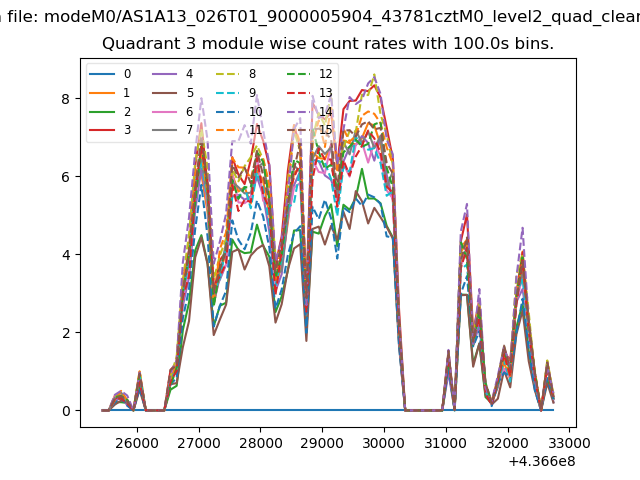 |
 |
| Parameter | Plot |
|---|---|
| CZT HV Monitor | 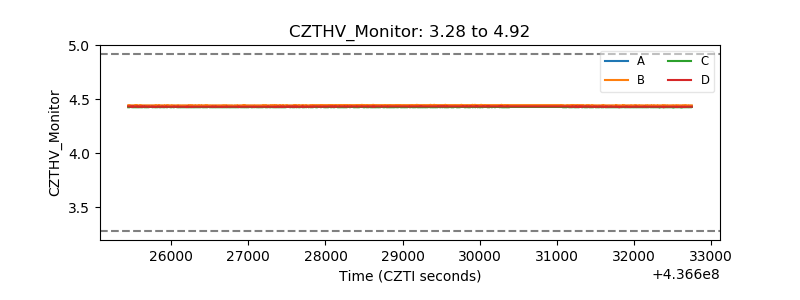 |
| D_VDD | 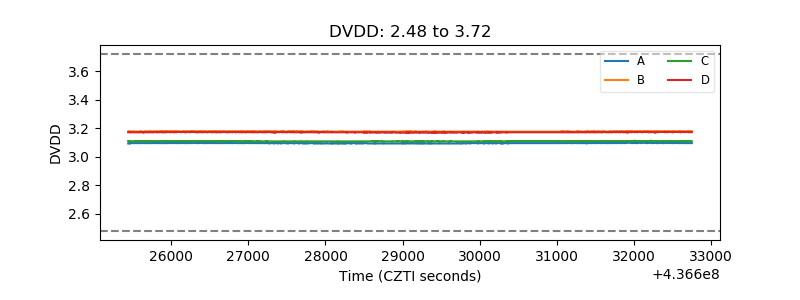 |
| Temperature 1 | 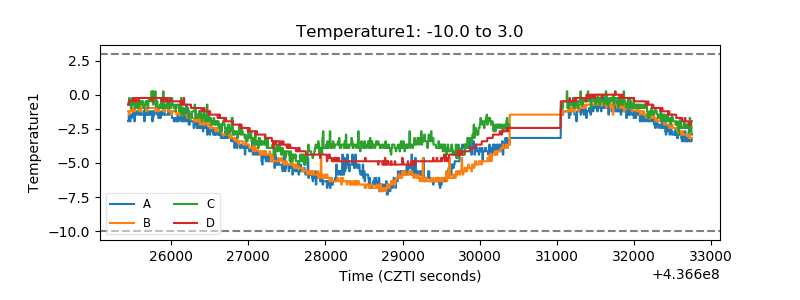 |
| Veto HV Monitor | 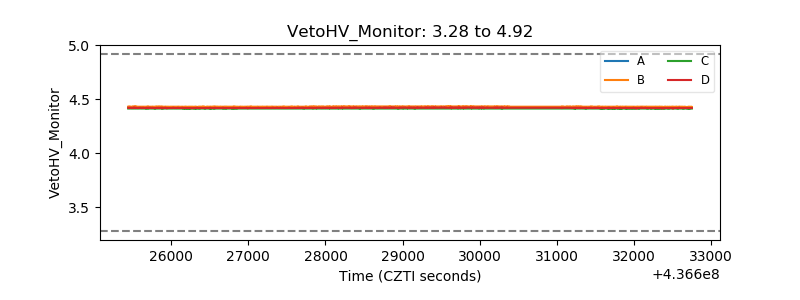 |
| Veto LLD | 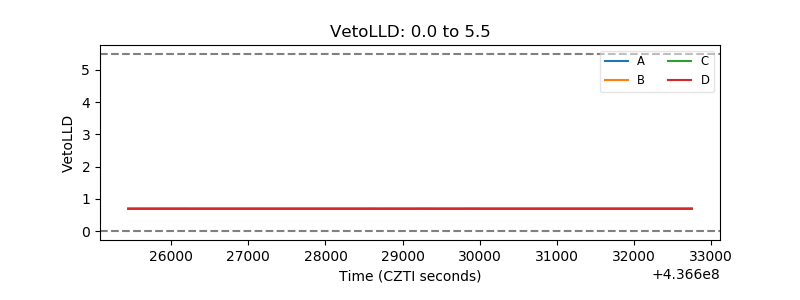 |
| Alpha Counter | 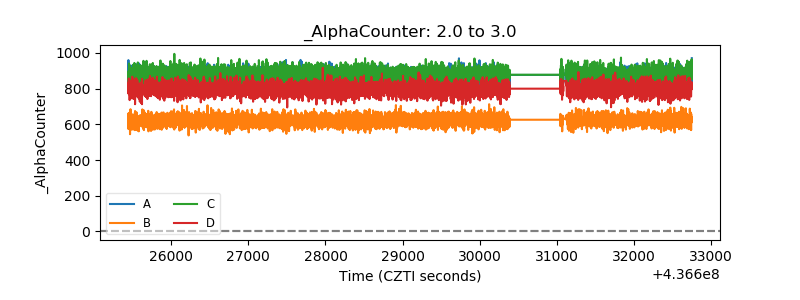 |
| _CPM_Rate | 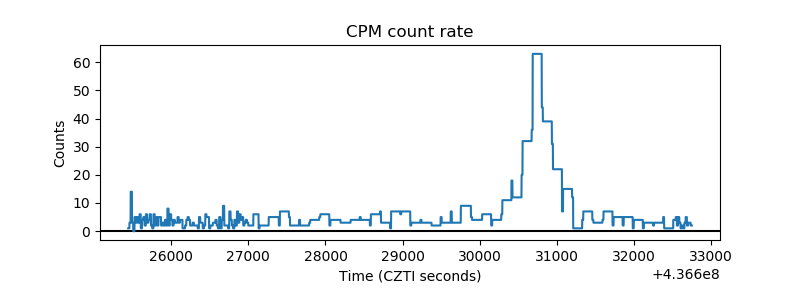 |
| CZT Counter | 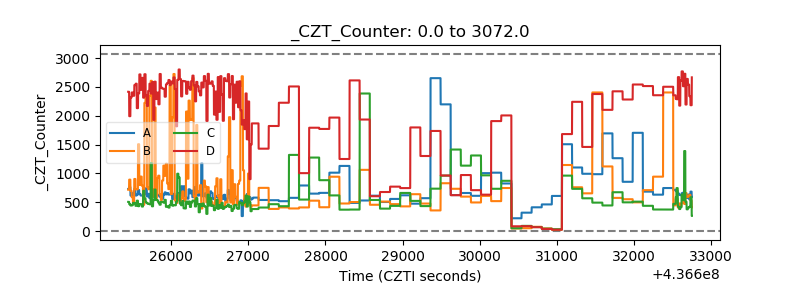 |
| +2.5 Volts monitor | 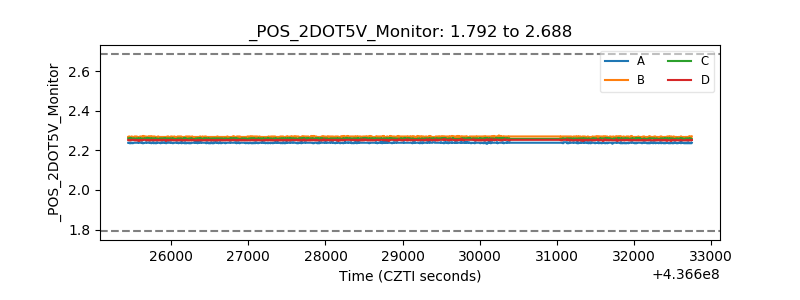 |
| +5 Volts monitor | 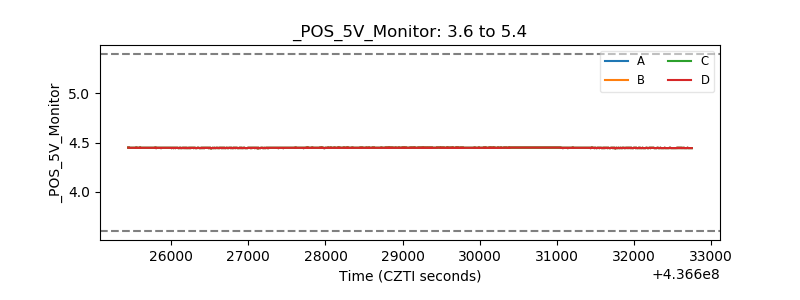 |
| _ROLL_ROT | 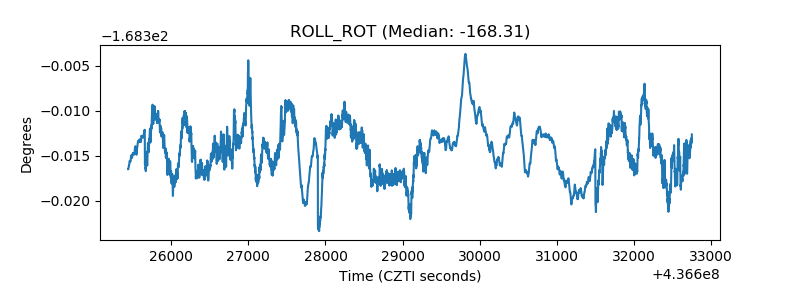 |
| _Roll_DEC | 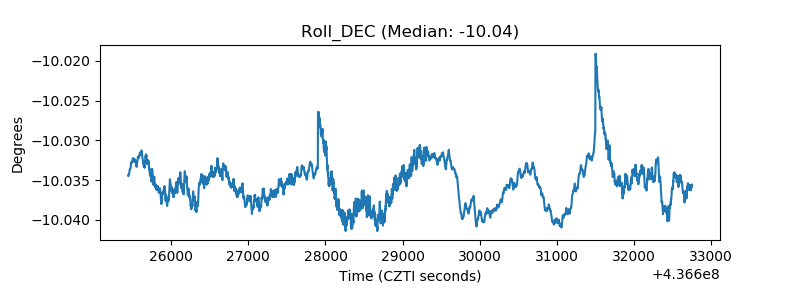 |
| _Roll_RA | 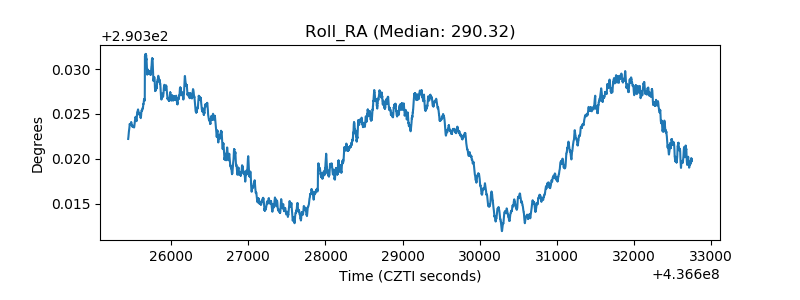 |
| Veto Counter | 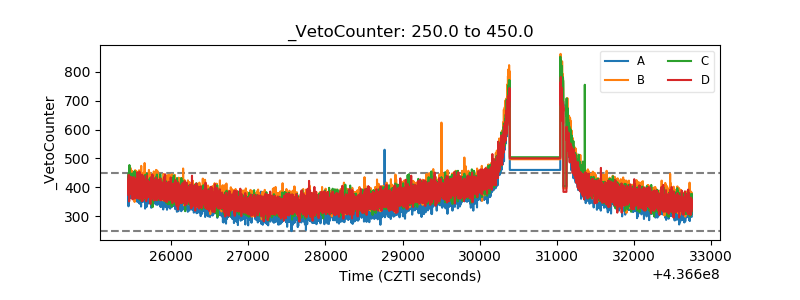 |