| Param | Original file | Final file |
|---|---|---|
| Filename | modeM0/AS1A13_026T01_9000005904_43782cztM0_level2.fits | modeM0/AS1A13_026T01_9000005904_43782cztM0_level2_quad_clean.evt |
| Size (bytes) | 829,365,120 | 104,088,960 |
| Size | 790.9 MB | 99.3 MB |
| Events in quadrant A | 6,231,302 | 734,432 |
| Events in quadrant B | 6,505,777 | 708,455 |
| Events in quadrant C | 4,765,255 | 769,829 |
| Events in quadrant D | 12,643,355 | 439,098 |
| Mode M0 | |||
|---|---|---|---|
| Quadrant | BADHDUFLAG | Total packets | Discarded packets |
| A | 0 | 23658 | 6 |
| B | 0 | 24188 | 1 |
| C | 0 | 19103 | 1 |
| D | 0 | 42540 | 21 |
| Mode SS | |||
|---|---|---|---|
| Quadrant | BADHDUFLAG | Total packets | Discarded packets |
| A | 0 | 144 | 0 |
| B | 0 | 144 | 0 |
| C | 0 | 144 | 0 |
| D | 0 | 144 | 0 |
| Quadrant | Total seconds | Saturated seconds | Saturation percentage |
|---|---|---|---|
| A | 7169 | 724 | 10.099038% |
| B | 7171 | 1139 | 15.883419% |
| C | 7171 | 340 | 4.741319% |
| D | 7167 | 3199 | 44.635133% |
Noise dominated data is calculated using 1-second bins in cleaned event files. If a bin has >2000 counts, and if more than 50% of those come from <1% of pixels, then it is considered to be noise-dominated and hence unusable.
| Quadrant | # 1 sec bins | Bins with >0 counts | Bins with >2000 counts | High rate bins dominated by noise | Noise dominated (total time) | Noise dominated (detector-on time) | Marked lightcurve |
|---|---|---|---|---|---|---|---|
| A | 7211 | 7170 | 497 | 497 | 6.89% | 6.93% | 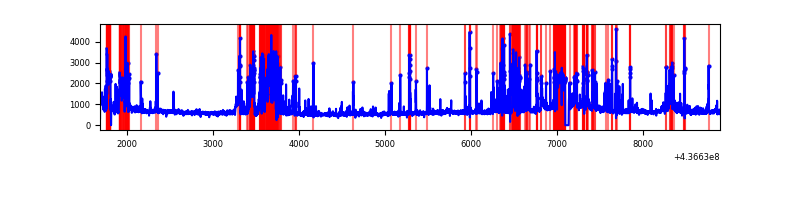 |
| B | 7211 | 7172 | 562 | 562 | 7.79% | 7.84% | 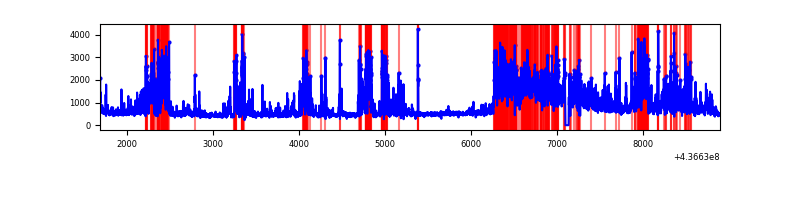 |
| C | 7211 | 7172 | 230 | 230 | 3.19% | 3.21% | 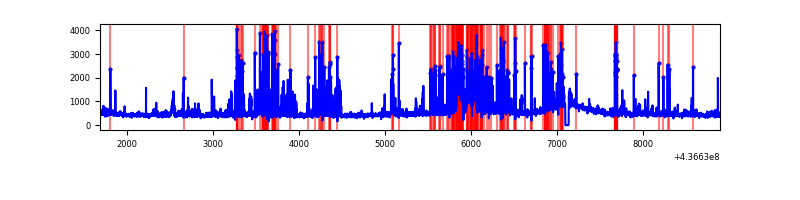 |
| D | 7211 | 7171 | 2852 | 2852 | 39.55% | 39.77% | 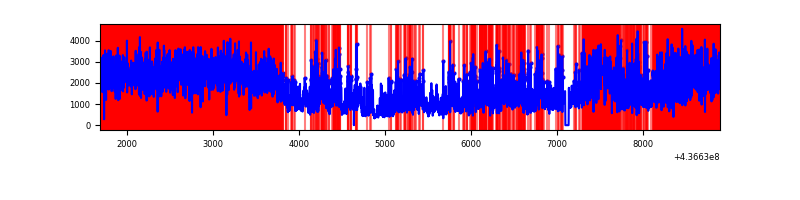 |
Top three noisy pixels from each quadrant. If the there are fewer than three noisy pixels in the level2.evt file, extra rows are filled as -1
| Pixel properties | Quadrant properties | ||||||
|---|---|---|---|---|---|---|---|
| Quadrant | DetID | PixID | Counts | Sigma | Mean | Median | Sigma |
| A | 15 | 223 | 1712993 | 10248.99 | 798 | 782 | 167.1 |
| A | 10 | 83 | 993956 | 5944.96 | 798 | 782 | 167.1 |
| A | 13 | 248 | 278837 | 1664.39 | 798 | 782 | 167.1 |
| B | 0 | 200 | 1405667 | 8848.45 | 799 | 776 | 158.8 |
| B | 5 | 235 | 916613 | 5768.23 | 799 | 776 | 158.8 |
| B | 5 | 172 | 221283 | 1388.82 | 799 | 776 | 158.8 |
| C | 15 | 158 | 701253 | 3661.73 | 810 | 814 | 191.3 |
| C | 14 | 254 | 279949 | 1459.25 | 810 | 814 | 191.3 |
| C | 15 | 174 | 231285 | 1204.85 | 810 | 814 | 191.3 |
| D | 12 | 33 | 5724045 | 31852.73 | 692 | 668 | 179.7 |
| D | 5 | 235 | 1577973 | 8778.29 | 692 | 668 | 179.7 |
| D | 1 | 52 | 836824 | 4653.52 | 692 | 668 | 179.7 |
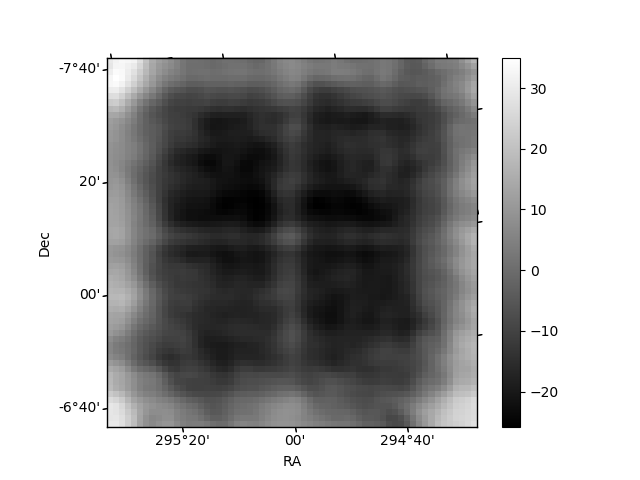
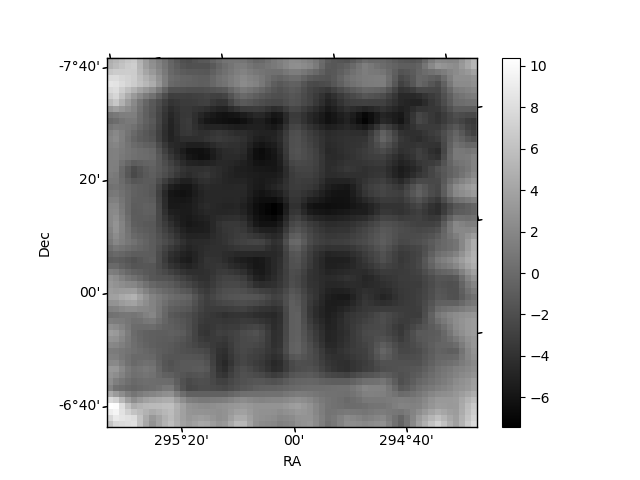
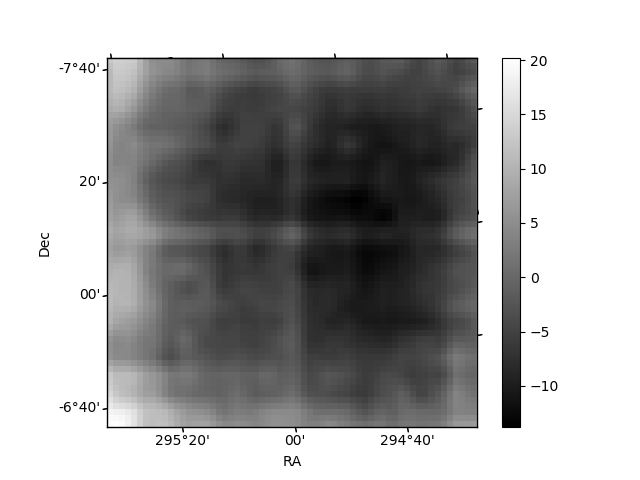
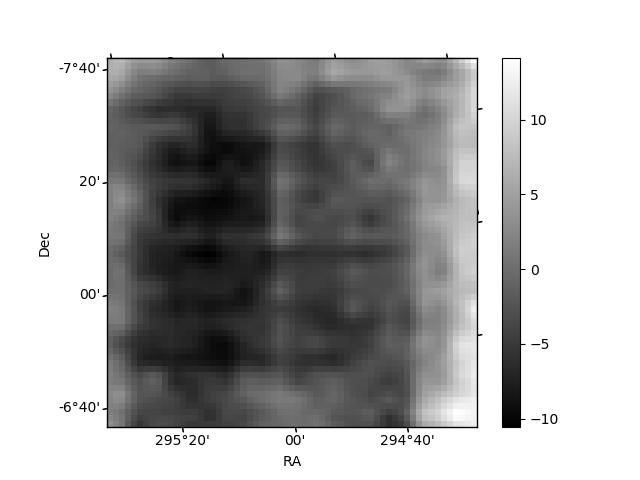
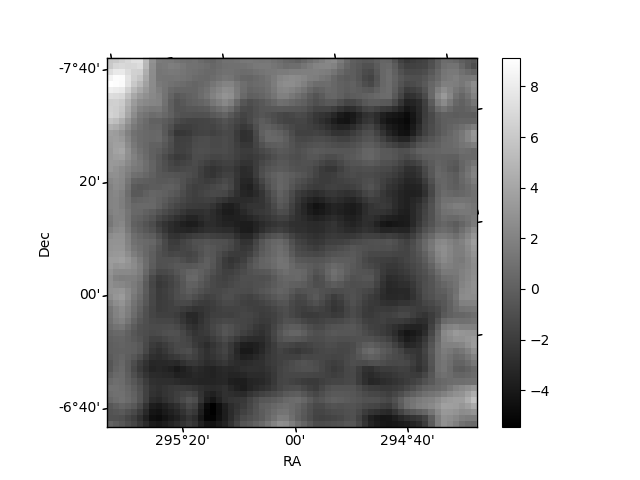
Histogram calculated using DETX and DETY for each event in the final _common_clean file
| Quadrant A | 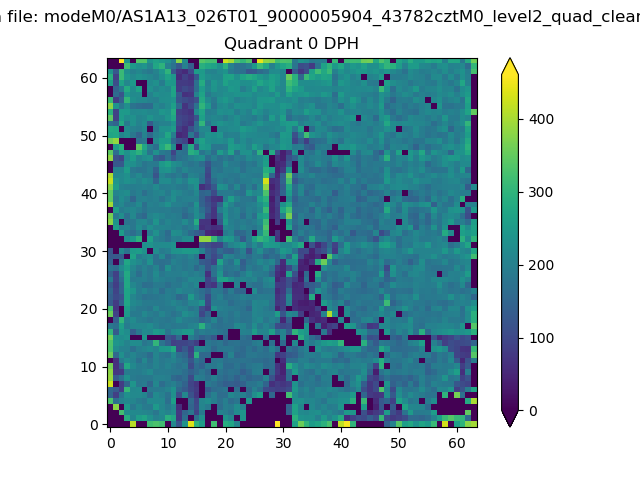 |
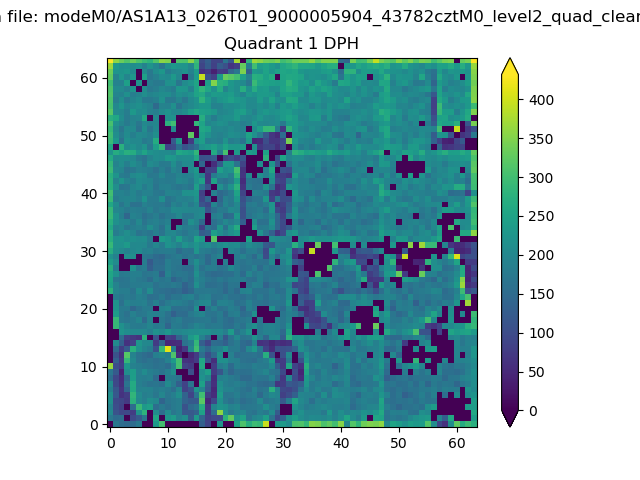 |
Quadrant B |
|---|---|---|---|
| Quadrant D | 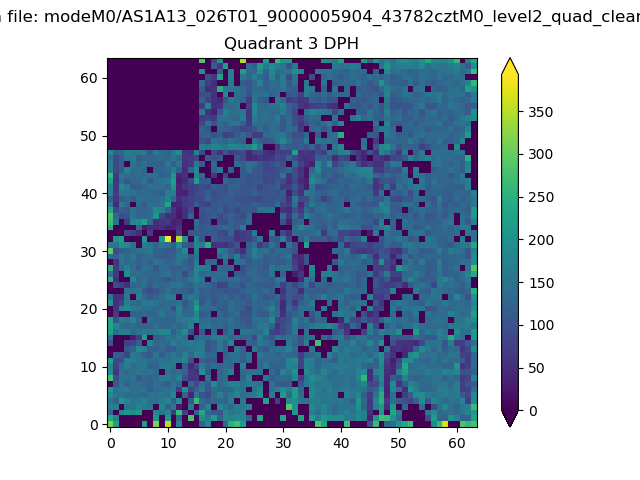 |
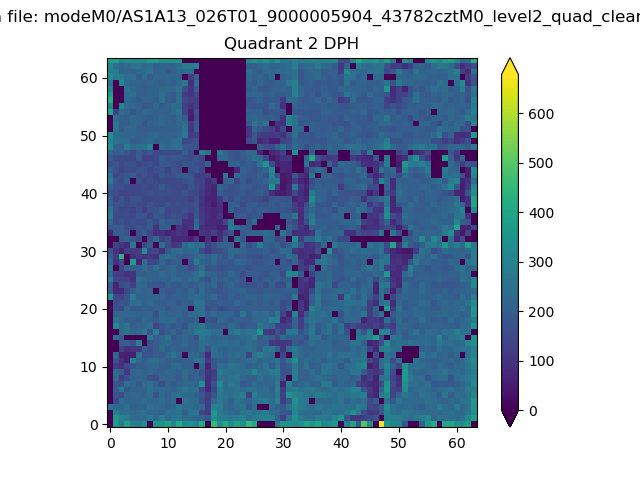 |
Quadrant C |
| Plot type | Count rate plots | Images |
|---|---|---|
| Comparison with Poisson distribution Blue bars denote a histogram of data divided into 1 sec bins. Red curve is a Poisson curve with rate = median count rate of data. |
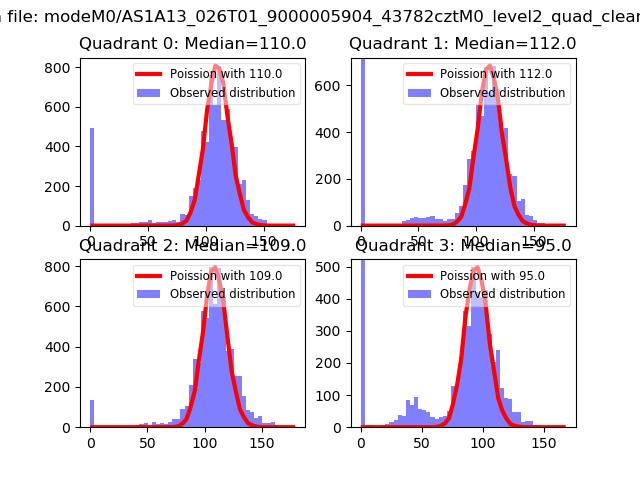 |
 |
| Quadrant-wise count rates Data is divided into 100 sec bins |
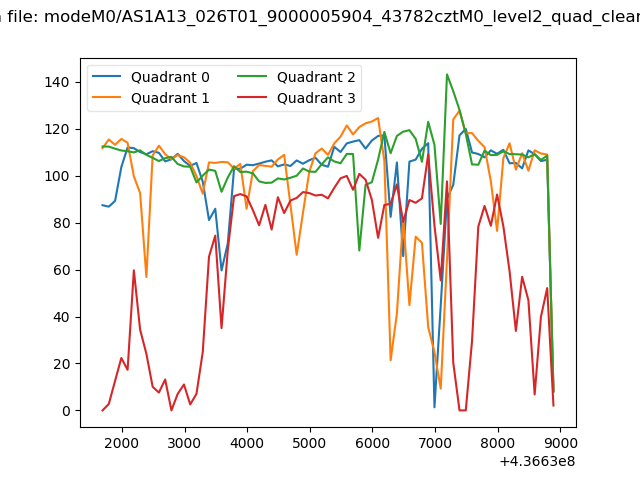 |
|
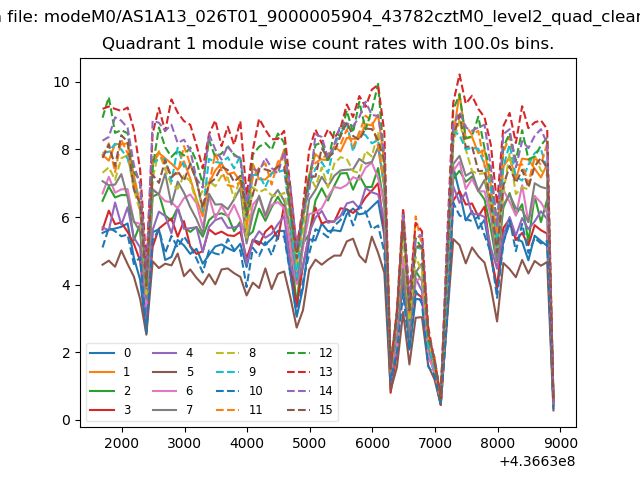
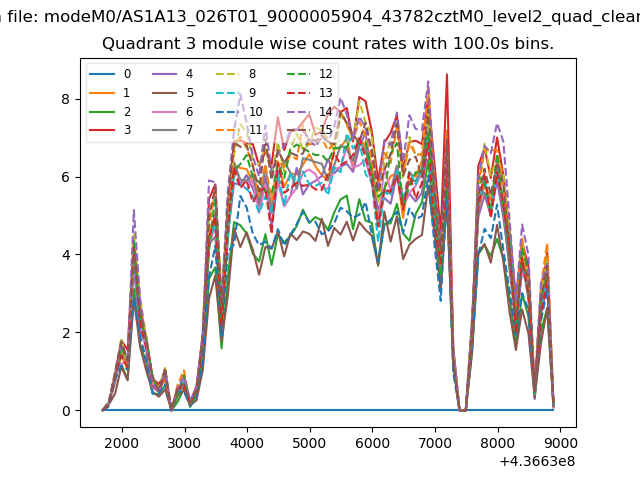
| Module-wise count rates for Quadrant A Data is divided into 100 sec bins |
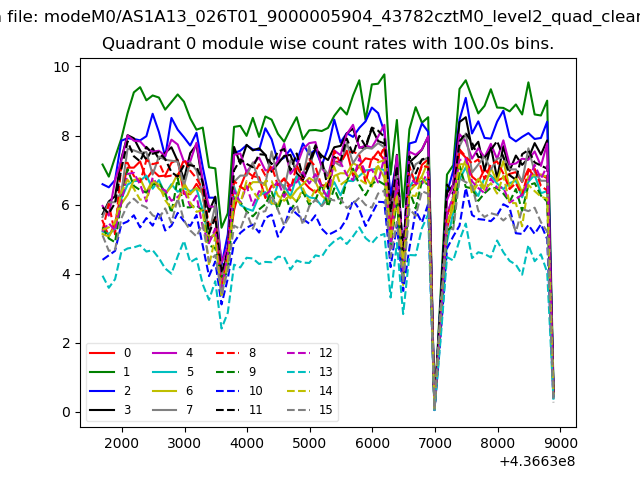 |
 |
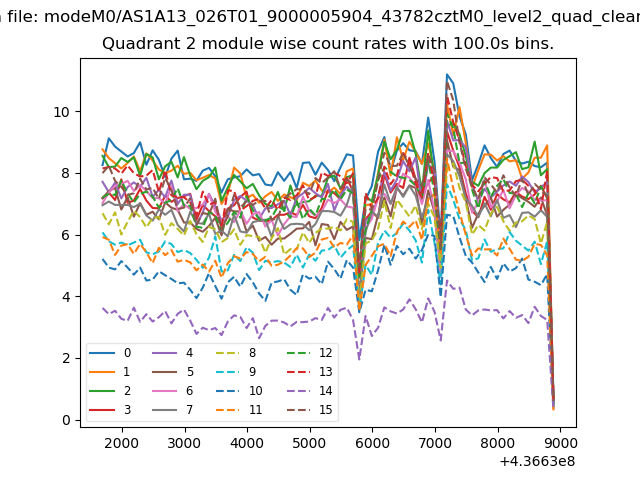
| Module-wise count rates for Quadrant B Data is divided into 100 sec bins |
 |
 |
| Module-wise count rates for Quadrant C Data is divided into 100 sec bins |
 |
 |
| Module-wise count rates for Quadrant D Data is divided into 100 sec bins |
 |
 |
| Parameter | Plot |
|---|---|
| CZT HV Monitor | 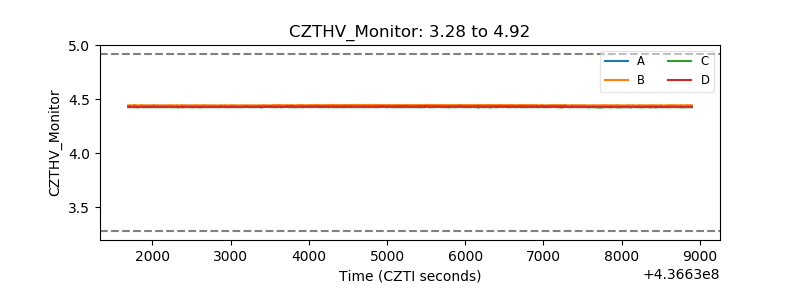 |
| D_VDD | 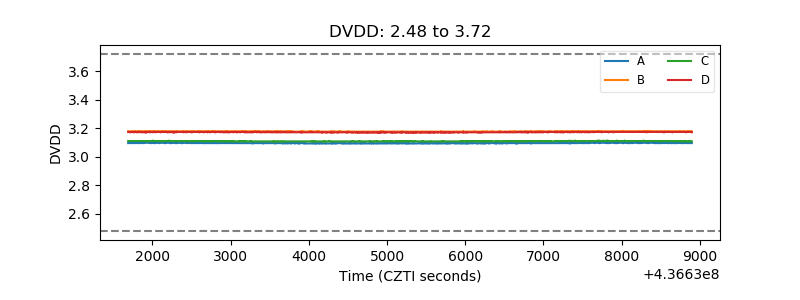 |
| Temperature 1 | 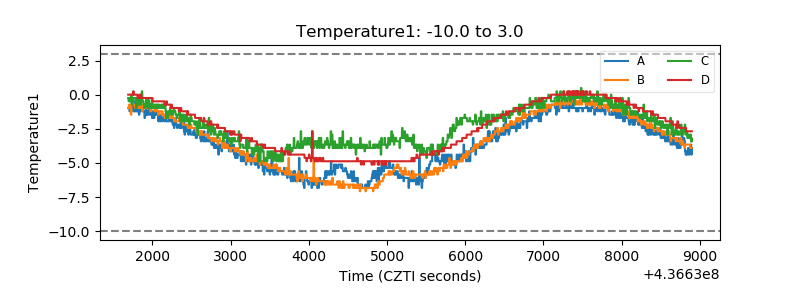 |
| Veto HV Monitor | 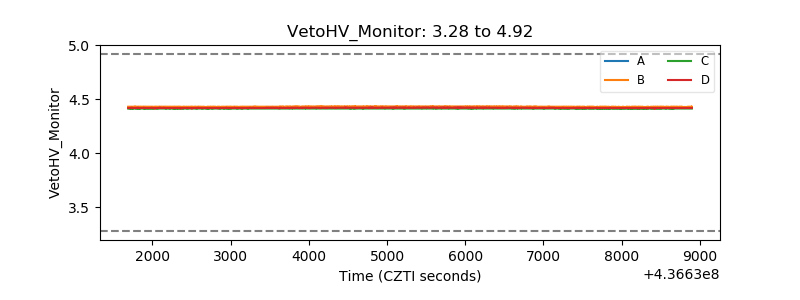 |
| Veto LLD | 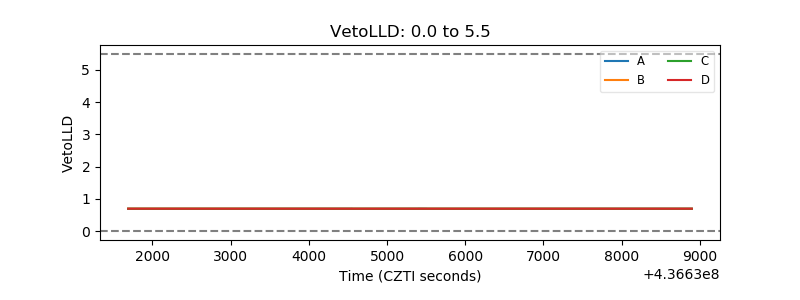 |
| Alpha Counter | 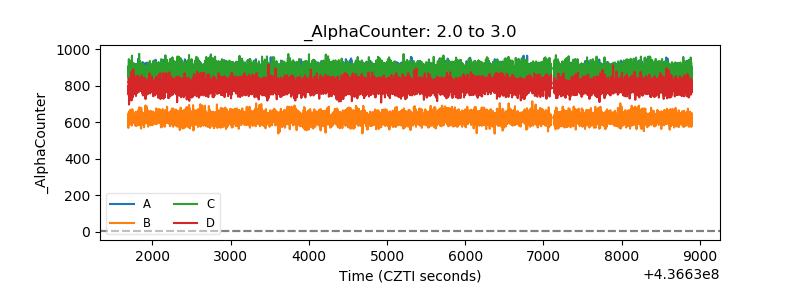 |
| _CPM_Rate | 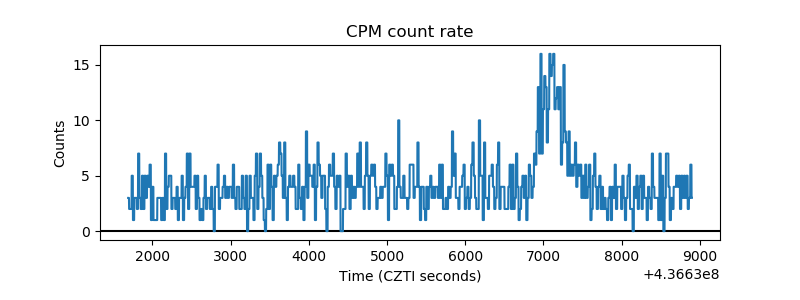 |
| CZT Counter | 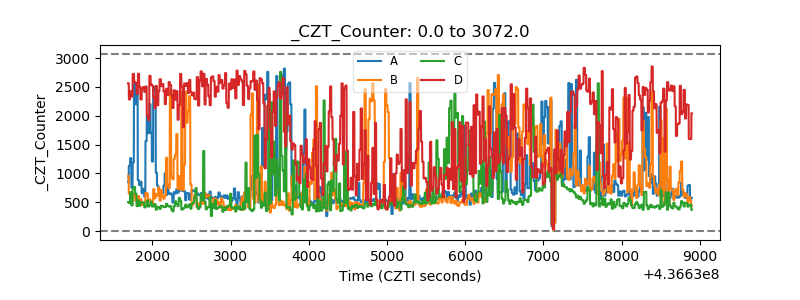 |
| +2.5 Volts monitor | 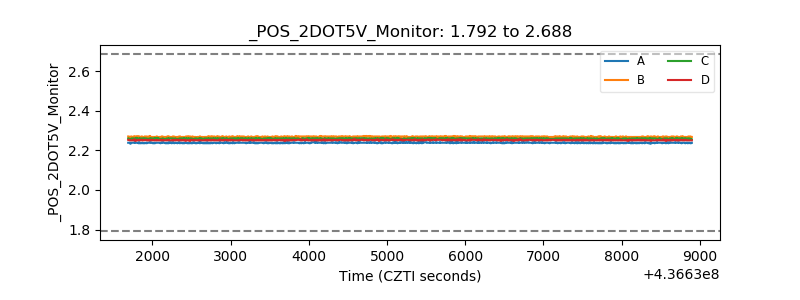 |
| +5 Volts monitor | 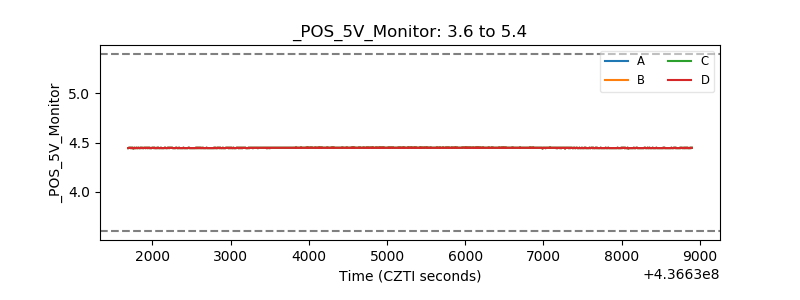 |
| _ROLL_ROT | 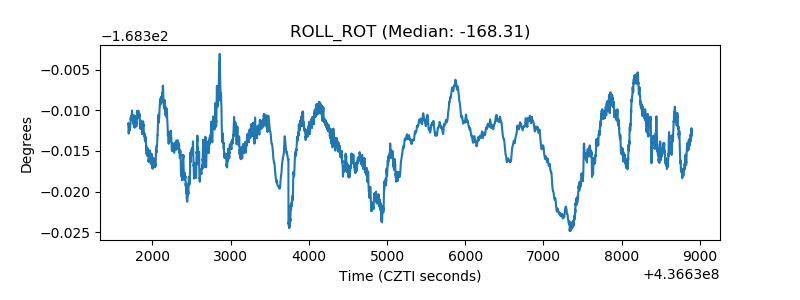 |
| _Roll_DEC | 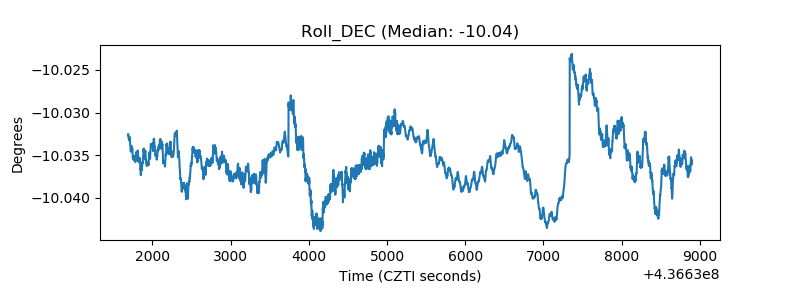 |
| _Roll_RA | 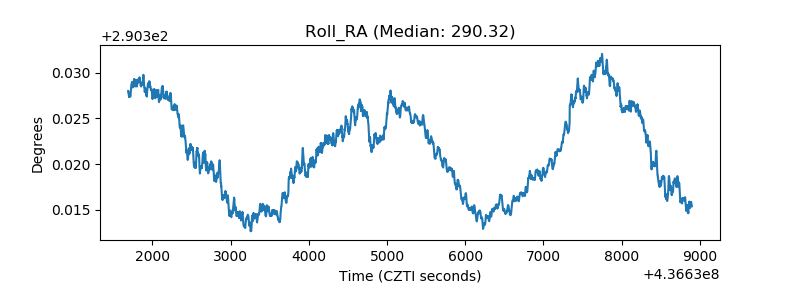 |
| Veto Counter | 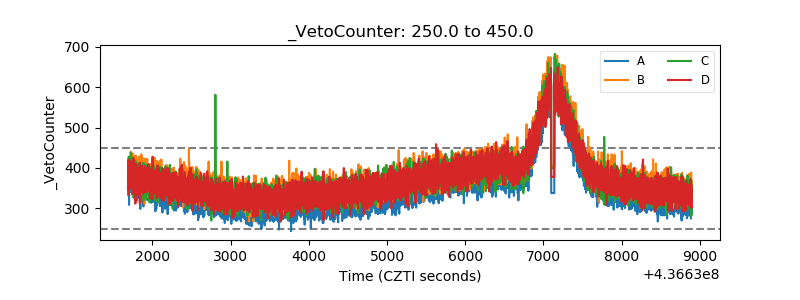 |