| Param | Original file | Final file |
|---|---|---|
| Filename | modeM0/AS1A13_018T01_9000005906_43784cztM0_level2.fits | modeM0/AS1A13_018T01_9000005906_43784cztM0_level2_quad_clean.evt |
| Size (bytes) | 634,406,400 | 89,190,720 |
| Size | 605.0 MB | 85.1 MB |
| Events in quadrant A | 5,778,807 | 585,792 |
| Events in quadrant B | 4,322,437 | 658,101 |
| Events in quadrant C | 5,448,917 | 592,144 |
| Events in quadrant D | 7,468,485 | 445,002 |
| Mode M0 | |||
|---|---|---|---|
| Quadrant | BADHDUFLAG | Total packets | Discarded packets |
| A | 0 | 21520 | 1 |
| B | 0 | 16969 | 0 |
| C | 0 | 20372 | 0 |
| D | 0 | 26309 | 0 |
| Mode SS | |||
|---|---|---|---|
| Quadrant | BADHDUFLAG | Total packets | Discarded packets |
| A | 0 | 120 | 0 |
| B | 0 | 120 | 0 |
| C | 0 | 120 | 0 |
| D | 0 | 120 | 0 |
| Quadrant | Total seconds | Saturated seconds | Saturation percentage |
|---|---|---|---|
| A | 6001 | 844 | 14.064323% |
| B | 6001 | 264 | 4.399267% |
| C | 6001 | 676 | 11.264789% |
| D | 6001 | 1597 | 26.612231% |
Noise dominated data is calculated using 1-second bins in cleaned event files. If a bin has >2000 counts, and if more than 50% of those come from <1% of pixels, then it is considered to be noise-dominated and hence unusable.
| Quadrant | # 1 sec bins | Bins with >0 counts | Bins with >2000 counts | High rate bins dominated by noise | Noise dominated (total time) | Noise dominated (detector-on time) | Marked lightcurve |
|---|---|---|---|---|---|---|---|
| A | 6001 | 6001 | 587 | 587 | 9.78% | 9.78% | 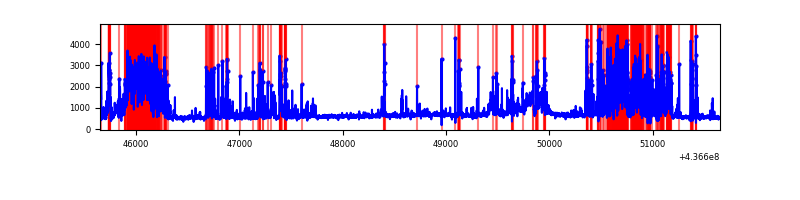 |
| B | 6001 | 6001 | 126 | 126 | 2.10% | 2.10% | 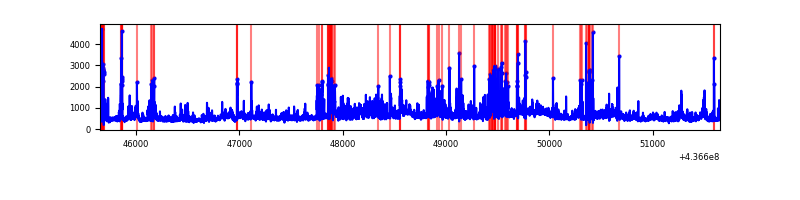 |
| C | 6001 | 6001 | 531 | 531 | 8.85% | 8.85% | 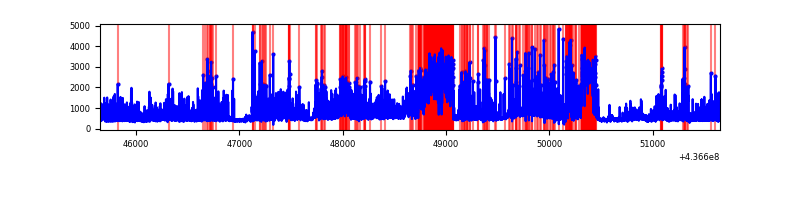 |
| D | 6001 | 6001 | 1261 | 1261 | 21.01% | 21.01% | 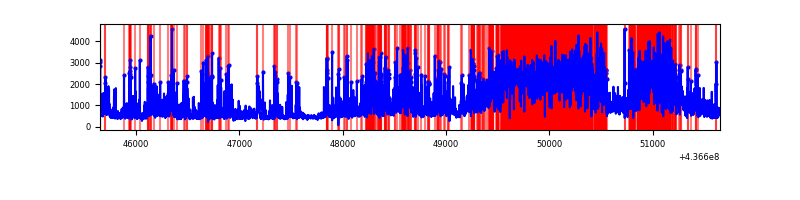 |
Top three noisy pixels from each quadrant. If the there are fewer than three noisy pixels in the level2.evt file, extra rows are filled as -1
| Pixel properties | Quadrant properties | ||||||
|---|---|---|---|---|---|---|---|
| Quadrant | DetID | PixID | Counts | Sigma | Mean | Median | Sigma |
| A | 15 | 223 | 2107536 | 15185.62 | 656 | 642 | 138.7 |
| A | 10 | 83 | 772861 | 5565.83 | 656 | 642 | 138.7 |
| A | 13 | 248 | 295543 | 2125.52 | 656 | 642 | 138.7 |
| B | 5 | 235 | 766350 | 5708.92 | 685 | 666 | 134.1 |
| B | 5 | 172 | 172262 | 1279.42 | 685 | 666 | 134.1 |
| B | 4 | 170 | 144705 | 1073.95 | 685 | 666 | 134.1 |
| C | 15 | 158 | 1481429 | 9717.45 | 644 | 648 | 152.4 |
| C | 15 | 174 | 1005818 | 6596.31 | 644 | 648 | 152.4 |
| C | 15 | 190 | 138771 | 906.42 | 644 | 648 | 152.4 |
| D | 5 | 235 | 2086330 | 13496.91 | 592 | 574 | 154.5 |
| D | 12 | 233 | 745551 | 4820.74 | 592 | 574 | 154.5 |
| D | 10 | 102 | 454511 | 2937.42 | 592 | 574 | 154.5 |
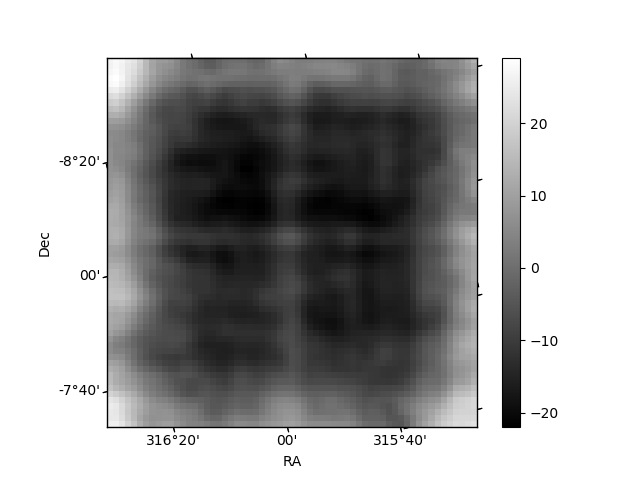
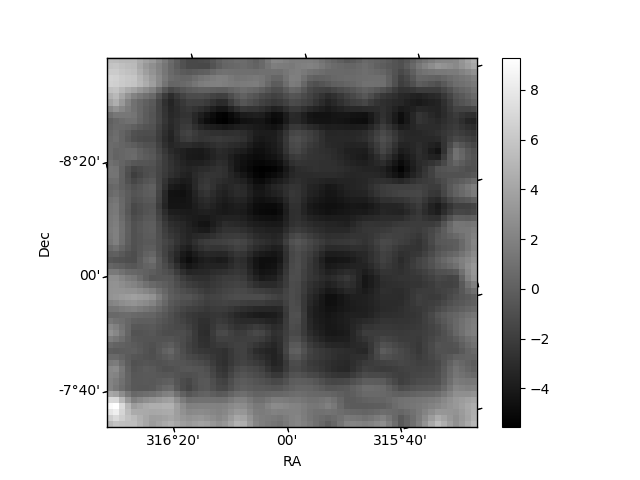
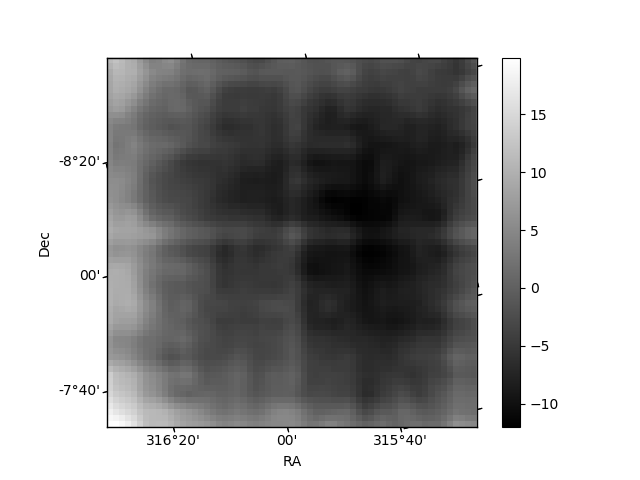
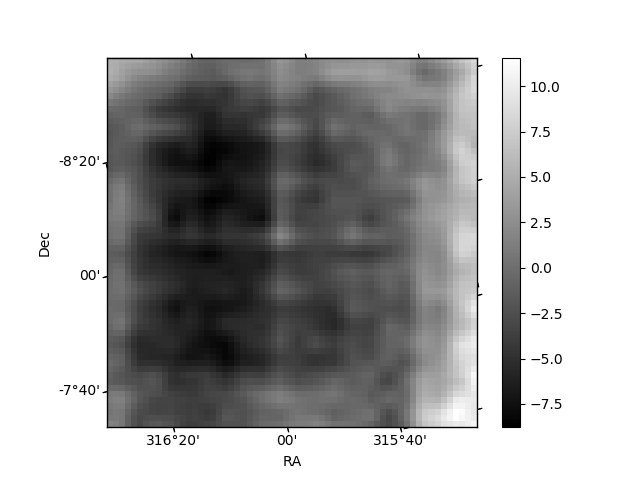
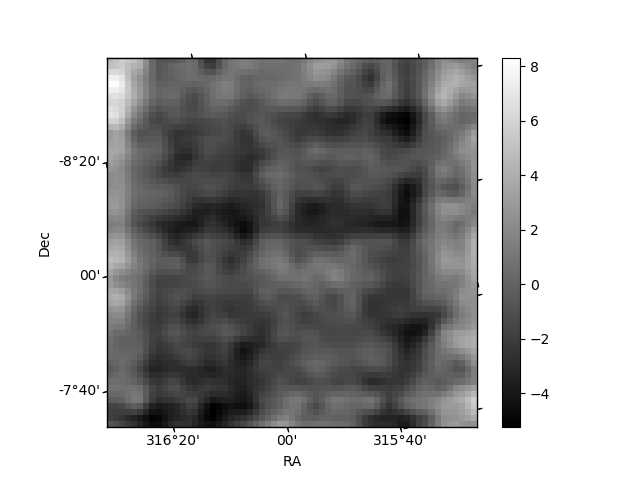
Histogram calculated using DETX and DETY for each event in the final _common_clean file
| Quadrant A | 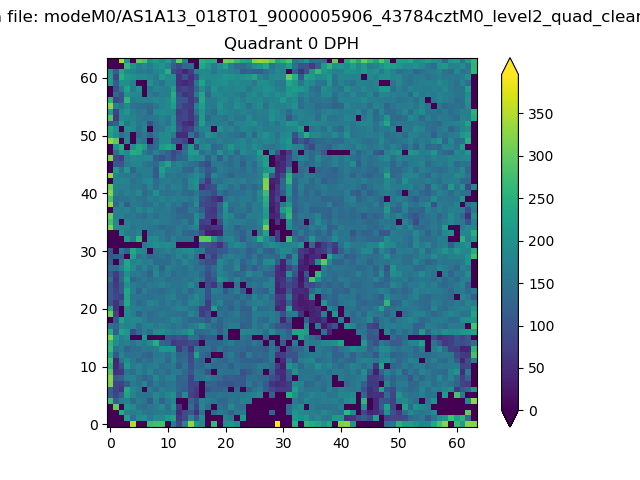 |
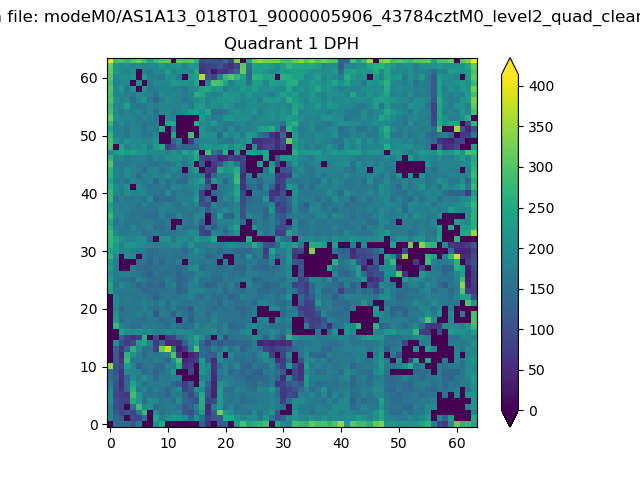 |
Quadrant B |
|---|---|---|---|
| Quadrant D | 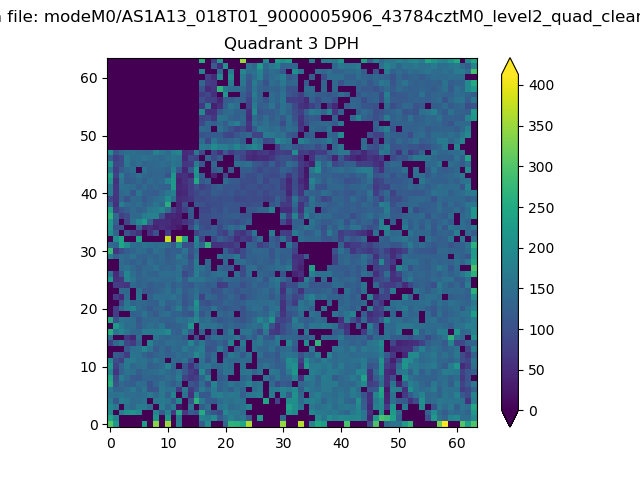 |
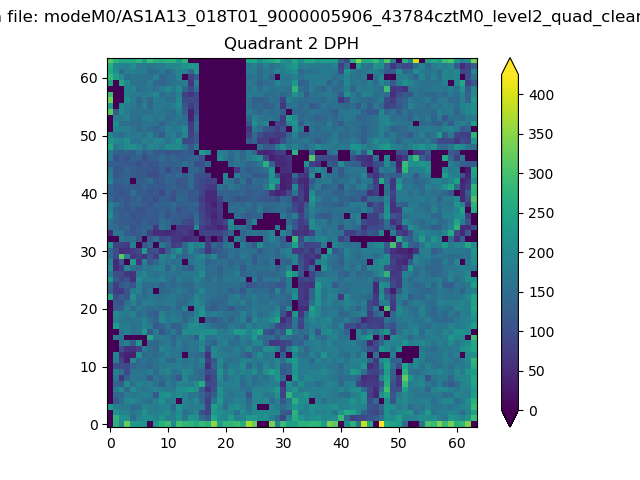 |
Quadrant C |
| Plot type | Count rate plots | Images |
|---|---|---|
| Comparison with Poisson distribution Blue bars denote a histogram of data divided into 1 sec bins. Red curve is a Poisson curve with rate = median count rate of data. |
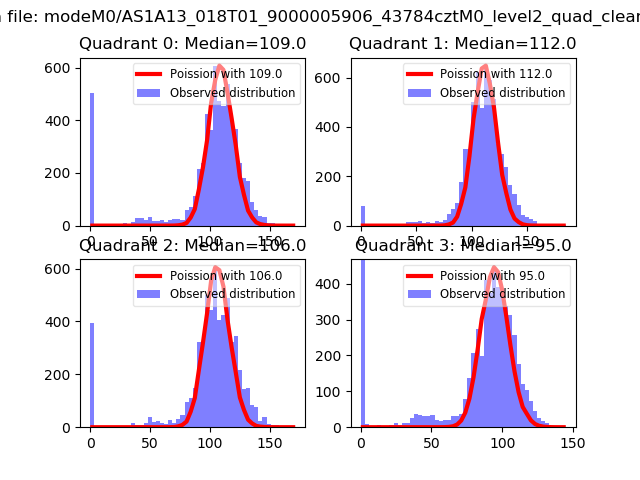 |
 |
| Quadrant-wise count rates Data is divided into 100 sec bins |
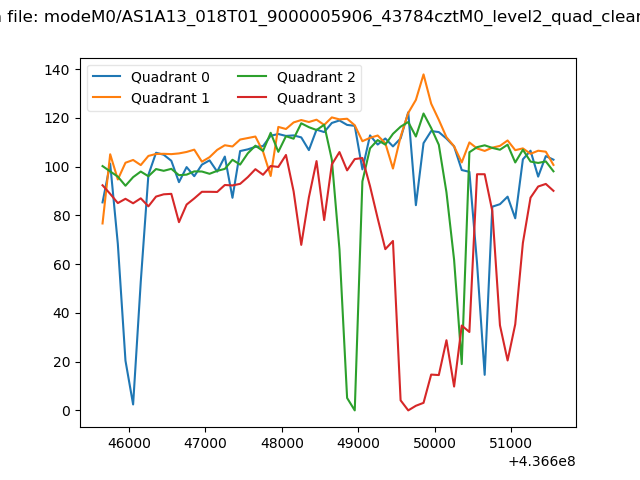 |
|
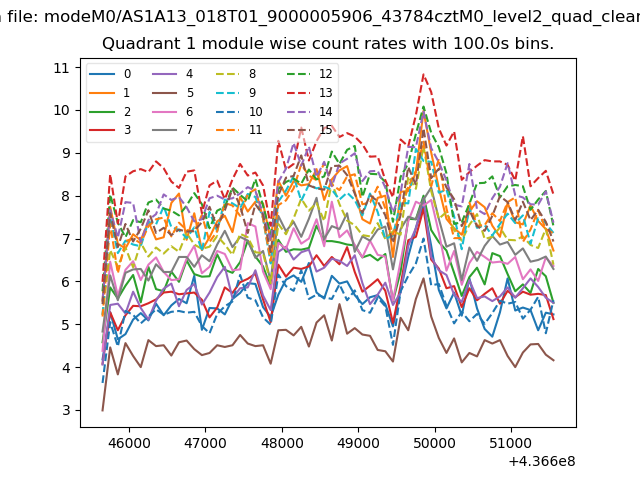
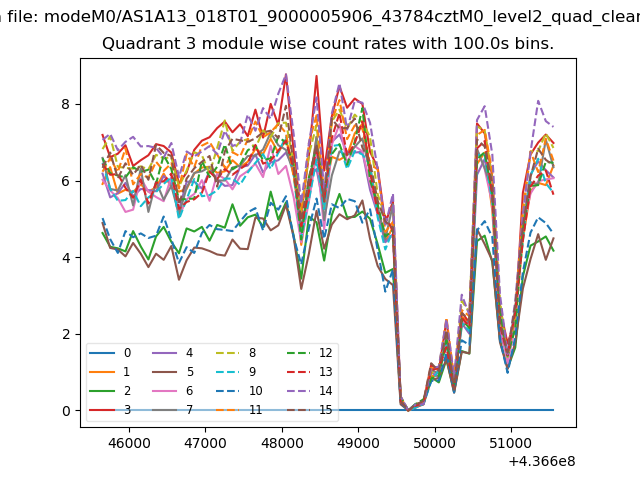
| Module-wise count rates for Quadrant A Data is divided into 100 sec bins |
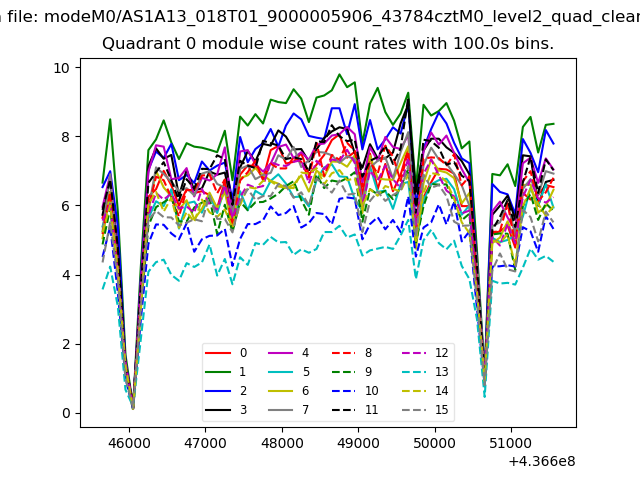 |
 |
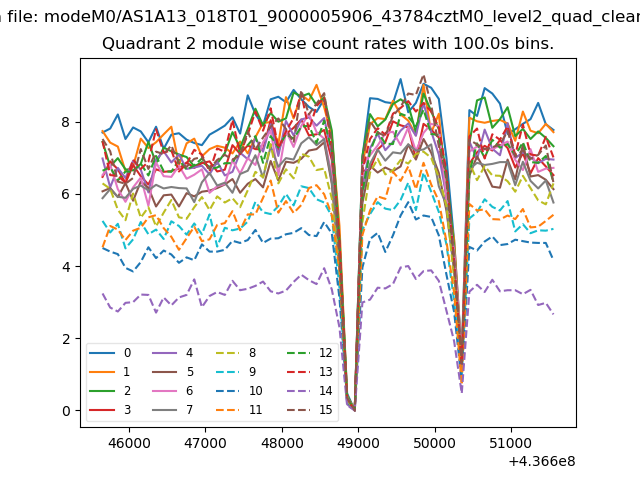
| Module-wise count rates for Quadrant B Data is divided into 100 sec bins |
 |
 |
| Module-wise count rates for Quadrant C Data is divided into 100 sec bins |
 |
 |
| Module-wise count rates for Quadrant D Data is divided into 100 sec bins |
 |
 |
| Parameter | Plot |
|---|---|
| CZT HV Monitor | 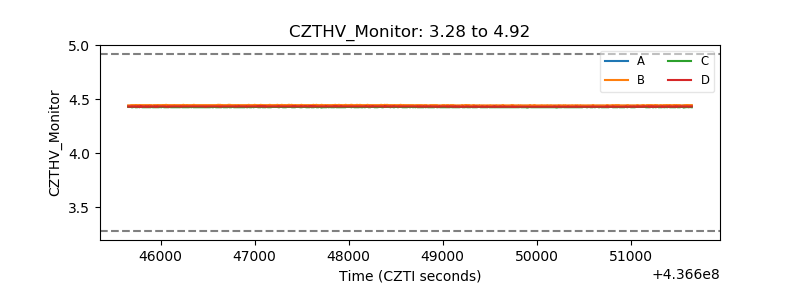 |
| D_VDD | 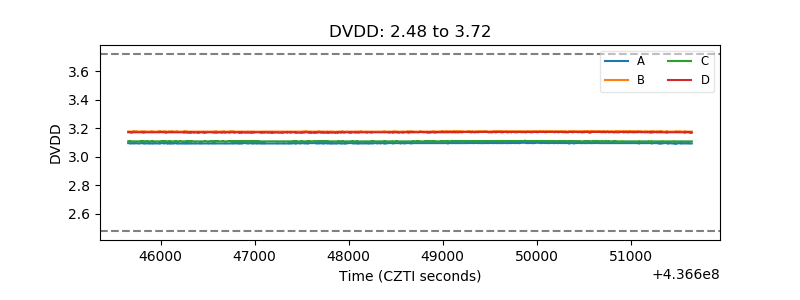 |
| Temperature 1 | 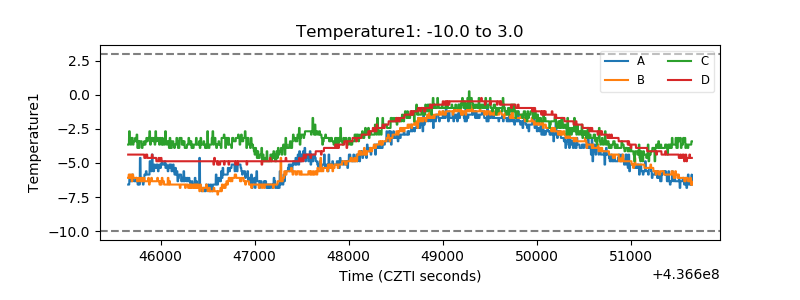 |
| Veto HV Monitor | 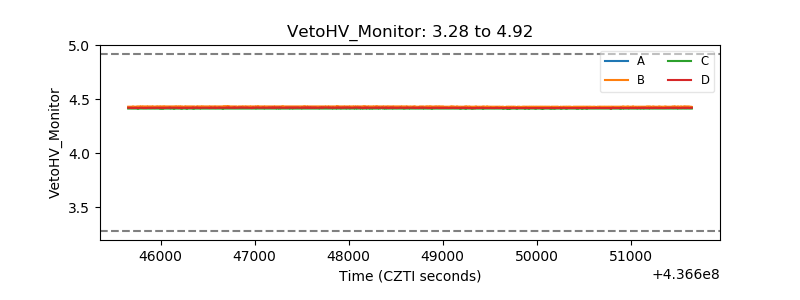 |
| Veto LLD | 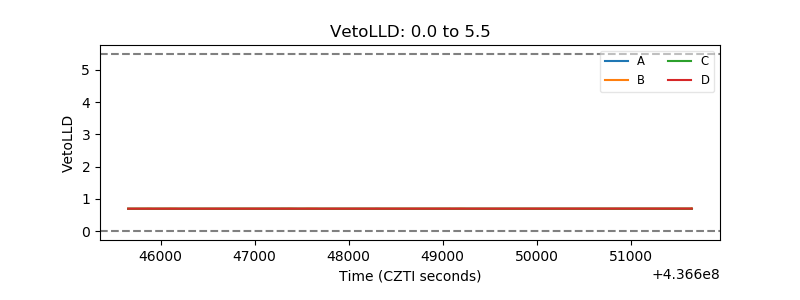 |
| Alpha Counter | 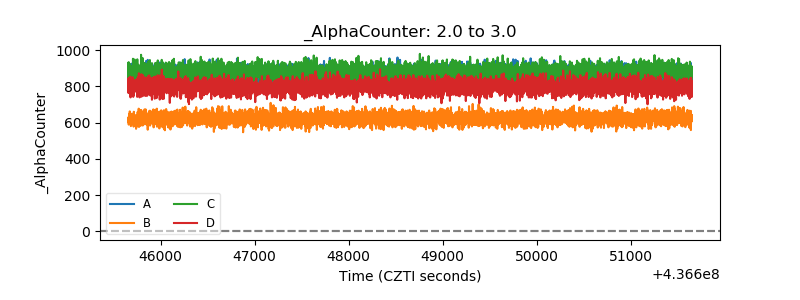 |
| _CPM_Rate | 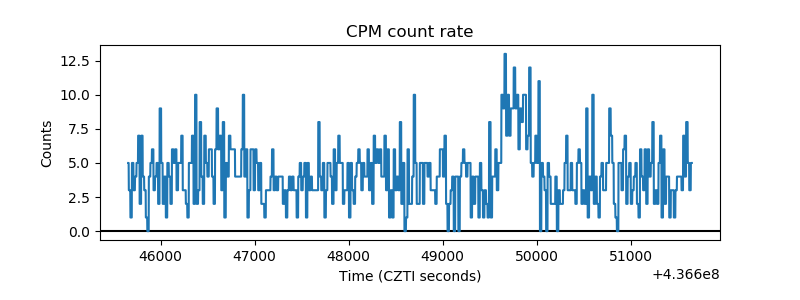 |
| CZT Counter | 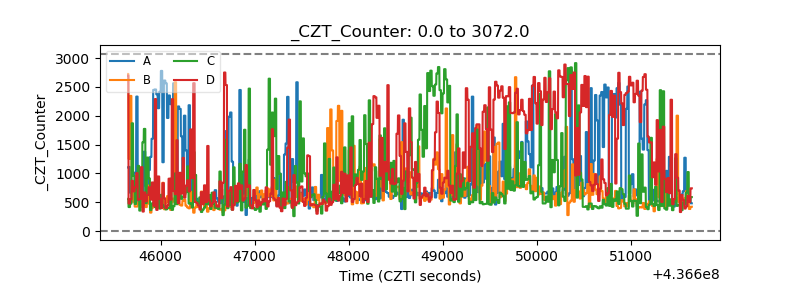 |
| +2.5 Volts monitor | 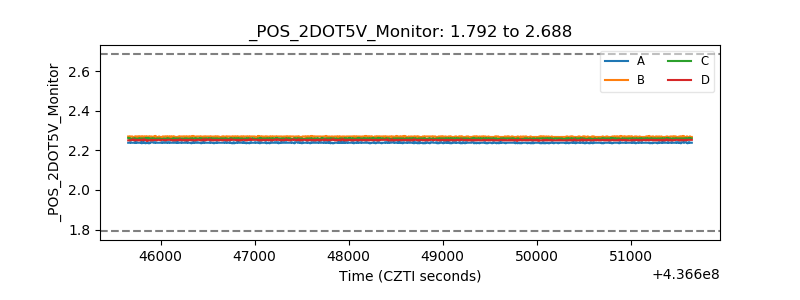 |
| +5 Volts monitor | 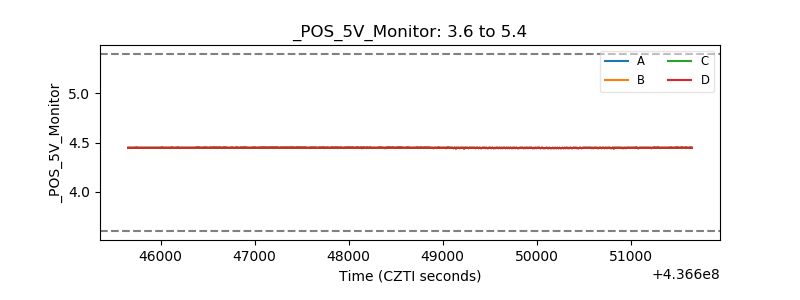 |
| _ROLL_ROT | 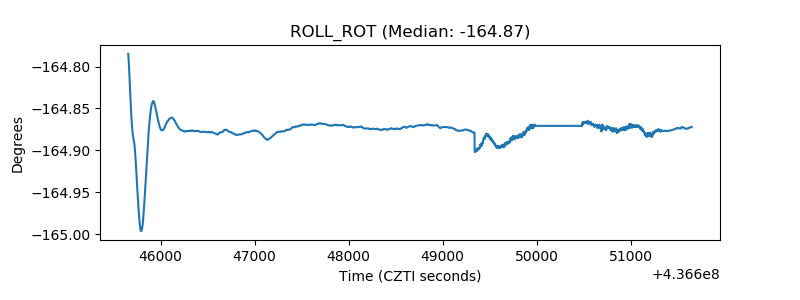 |
| _Roll_DEC | 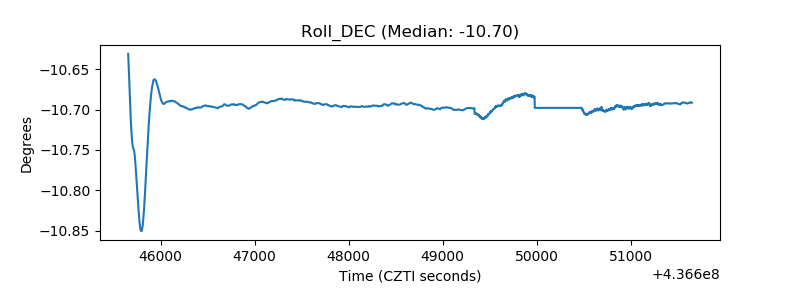 |
| _Roll_RA | 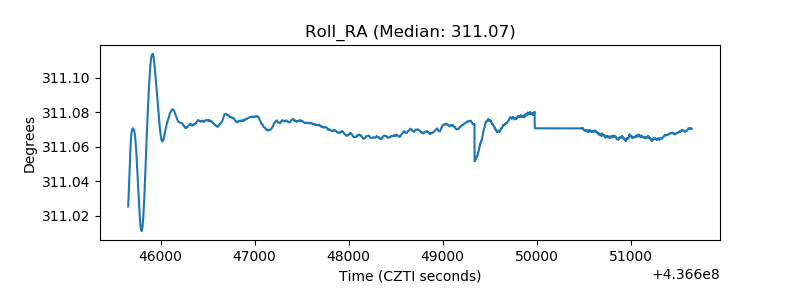 |
| Veto Counter | 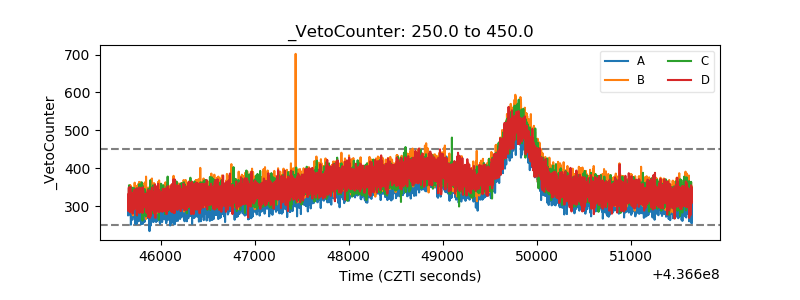 |