| Param | Original file | Final file |
|---|---|---|
| Filename | modeM0/AS1A13_018T01_9000005906_43788cztM0_level2.fits | modeM0/AS1A13_018T01_9000005906_43788cztM0_level2_quad_clean.evt |
| Size (bytes) | 733,798,080 | 97,174,080 |
| Size | 699.8 MB | 92.7 MB |
| Events in quadrant A | 5,111,563 | 701,258 |
| Events in quadrant B | 4,619,386 | 733,012 |
| Events in quadrant C | 11,936,674 | 412,189 |
| Events in quadrant D | 4,980,732 | 632,248 |
| Mode M0 | |||
|---|---|---|---|
| Quadrant | BADHDUFLAG | Total packets | Discarded packets |
| A | 0 | 19763 | 4 |
| B | 0 | 18106 | 2 |
| C | 0 | 40015 | 2 |
| D | 0 | 19331 | 2 |
| Mode SS | |||
|---|---|---|---|
| Quadrant | BADHDUFLAG | Total packets | Discarded packets |
| A | 0 | 134 | 0 |
| B | 0 | 134 | 0 |
| C | 0 | 134 | 0 |
| D | 0 | 134 | 0 |
| Mode M9 | |||
|---|---|---|---|
| Quadrant | BADHDUFLAG | Total packets | Discarded packets |
| A | 0 | 11 | 0 |
| B | 0 | 12 | 0 |
| C | 0 | 12 | 0 |
| D | 0 | 12 | 0 |
| Quadrant | Total seconds | Saturated seconds | Saturation percentage |
|---|---|---|---|
| A | 6648 | 313 | 4.708183% |
| B | 6648 | 247 | 3.715403% |
| C | 6648 | 3190 | 47.984356% |
| D | 6648 | 361 | 5.430205% |
Noise dominated data is calculated using 1-second bins in cleaned event files. If a bin has >2000 counts, and if more than 50% of those come from <1% of pixels, then it is considered to be noise-dominated and hence unusable.
| Quadrant | # 1 sec bins | Bins with >0 counts | Bins with >2000 counts | High rate bins dominated by noise | Noise dominated (total time) | Noise dominated (detector-on time) | Marked lightcurve |
|---|---|---|---|---|---|---|---|
| A | 7573 | 6649 | 190 | 190 | 2.51% | 2.86% | 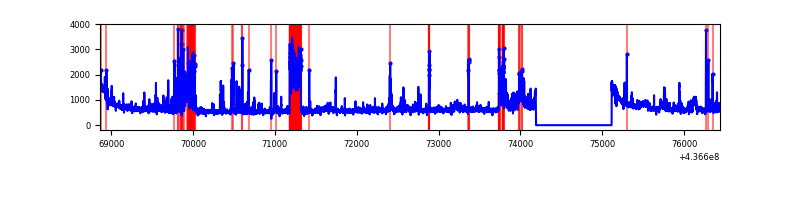 |
| B | 7573 | 6649 | 126 | 126 | 1.66% | 1.90% | 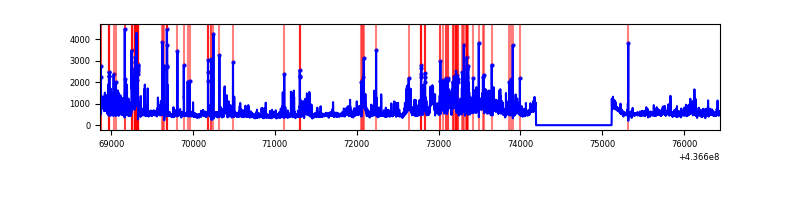 |
| C | 7573 | 6648 | 3143 | 3143 | 41.50% | 47.28% | 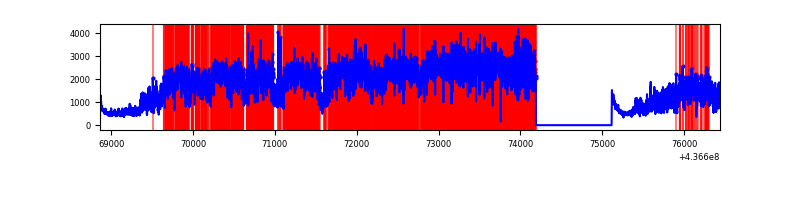 |
| D | 7573 | 6649 | 288 | 288 | 3.80% | 4.33% | 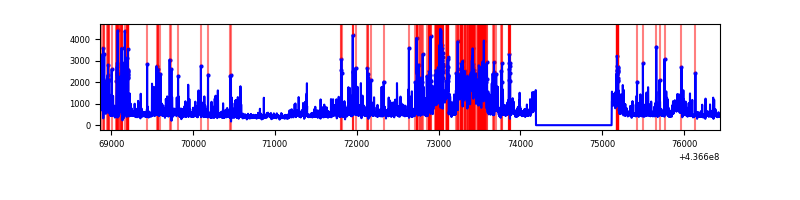 |
Top three noisy pixels from each quadrant. If the there are fewer than three noisy pixels in the level2.evt file, extra rows are filled as -1
| Pixel properties | Quadrant properties | ||||||
|---|---|---|---|---|---|---|---|
| Quadrant | DetID | PixID | Counts | Sigma | Mean | Median | Sigma |
| A | 10 | 83 | 1008450 | 6374.33 | 757 | 741 | 158.1 |
| A | 15 | 223 | 990809 | 6262.74 | 757 | 741 | 158.1 |
| A | 2 | 79 | 118288 | 743.55 | 757 | 741 | 158.1 |
| B | 0 | 200 | 610881 | 4024.93 | 760 | 735 | 151.6 |
| B | 7 | 205 | 371152 | 2443.52 | 760 | 735 | 151.6 |
| B | 5 | 235 | 329061 | 2165.86 | 760 | 735 | 151.6 |
| C | 15 | 174 | 8735074 | 57003.54 | 648 | 652 | 153.2 |
| C | 15 | 190 | 233929 | 1522.44 | 648 | 652 | 153.2 |
| C | 15 | 158 | 187420 | 1218.91 | 648 | 652 | 153.2 |
| D | 5 | 222 | 868558 | 4596.54 | 741 | 719 | 188.8 |
| D | 1 | 52 | 261474 | 1381.1 | 741 | 719 | 188.8 |
| D | 13 | 249 | 256245 | 1353.4 | 741 | 719 | 188.8 |
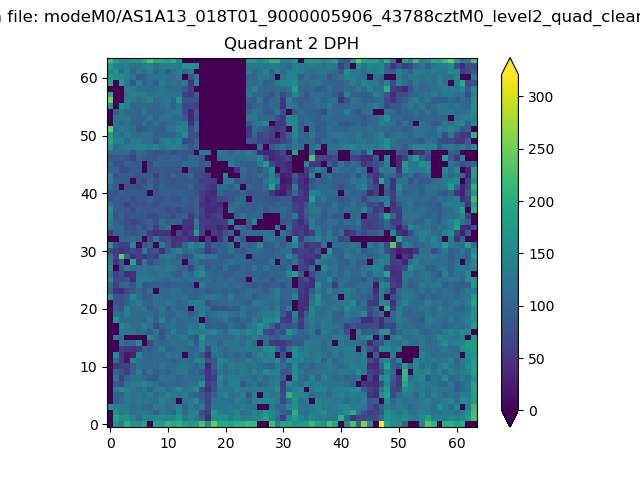
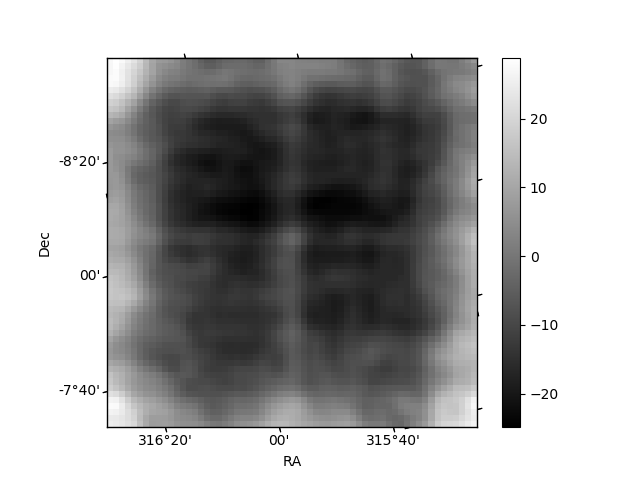
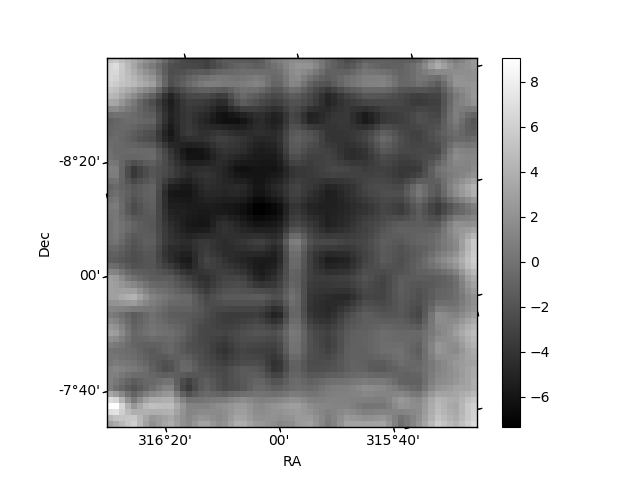
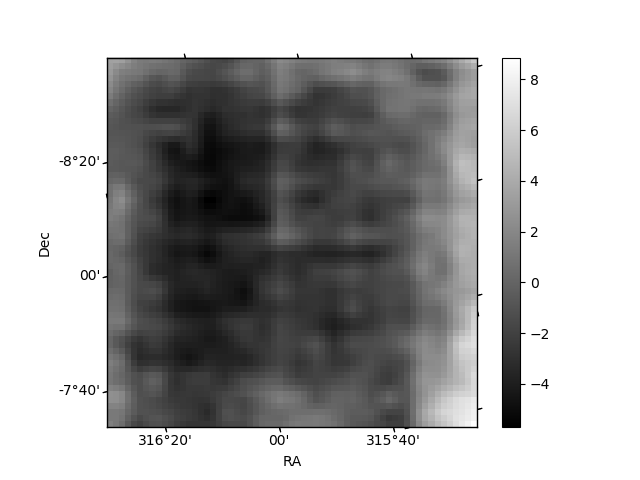
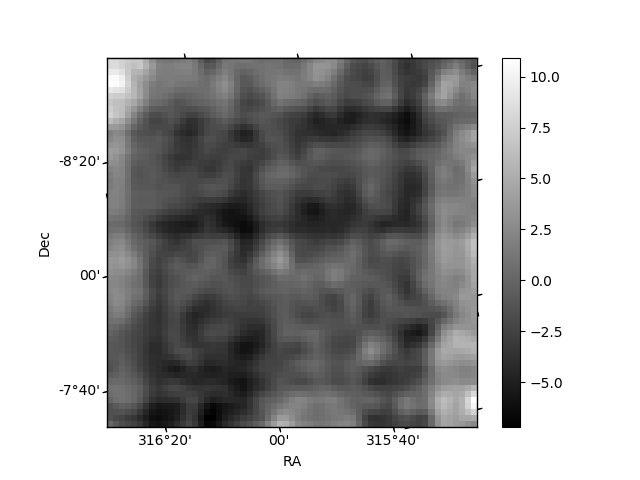
Histogram calculated using DETX and DETY for each event in the final _common_clean file
| Quadrant A | 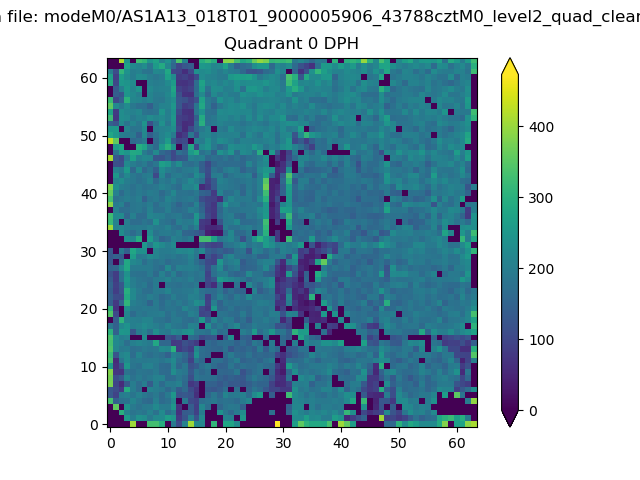 |
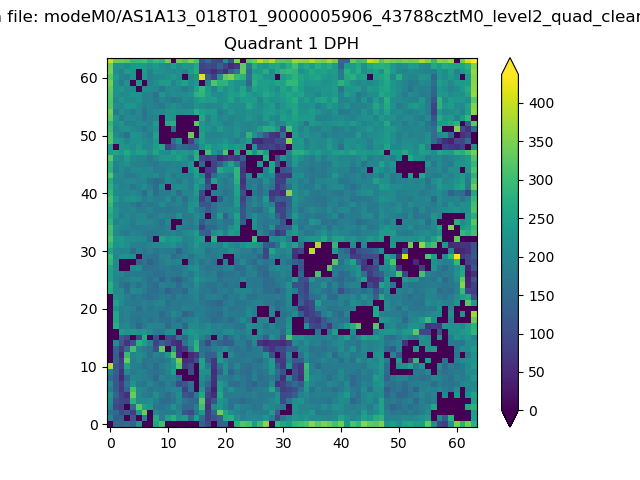 |
Quadrant B |
|---|---|---|---|
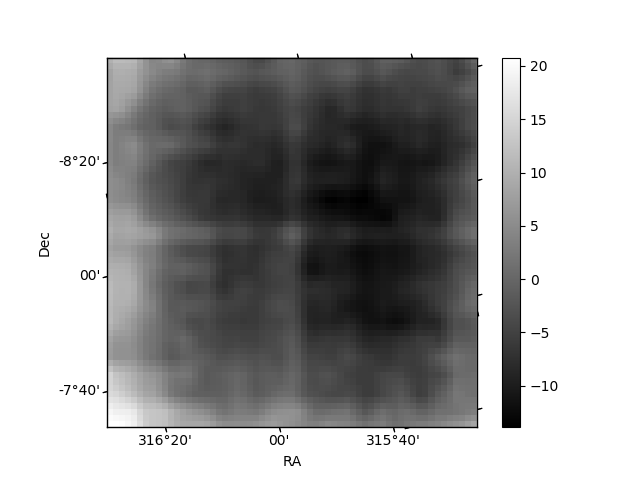
| Quadrant D | 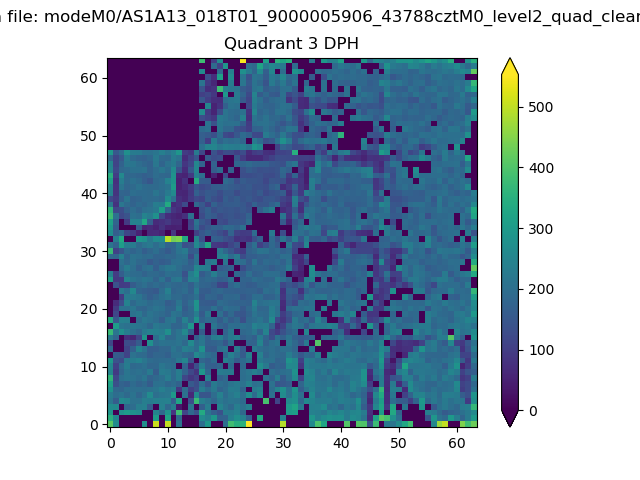 |
 |
Quadrant C |
| Plot type | Count rate plots | Images |
|---|---|---|
| Comparison with Poisson distribution Blue bars denote a histogram of data divided into 1 sec bins. Red curve is a Poisson curve with rate = median count rate of data. |
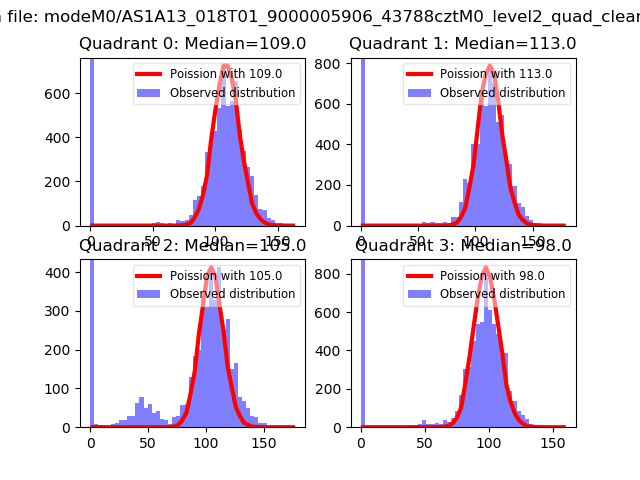 |
 |
| Quadrant-wise count rates Data is divided into 100 sec bins |
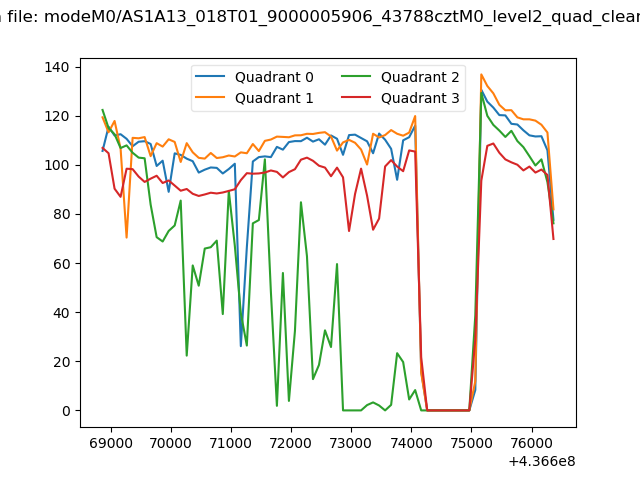 |
|
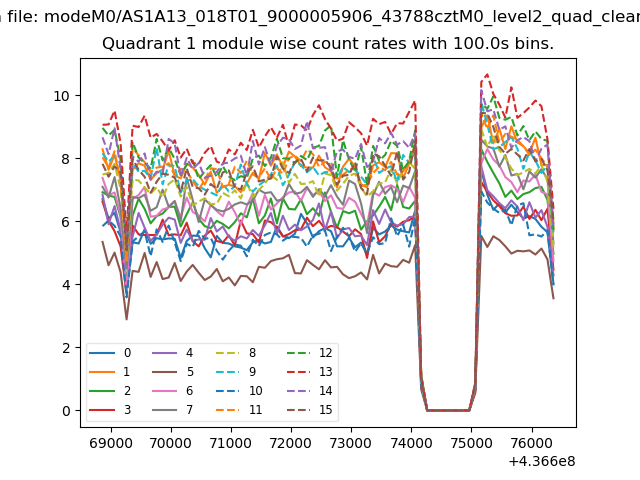
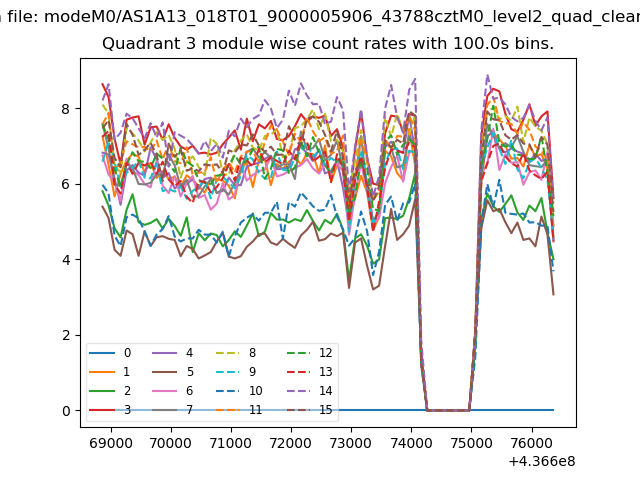
| Module-wise count rates for Quadrant A Data is divided into 100 sec bins |
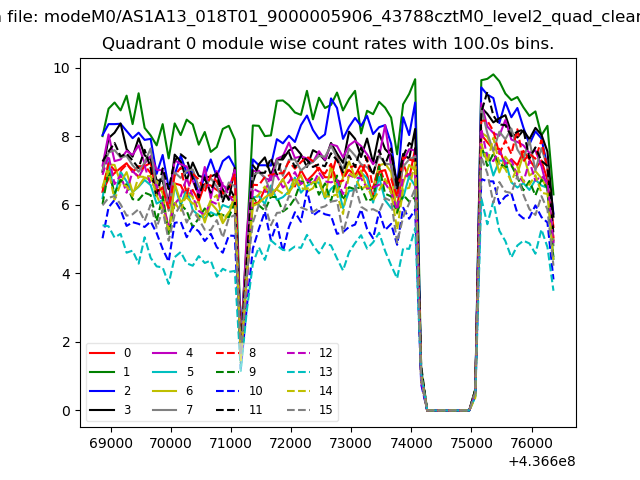 |
 |
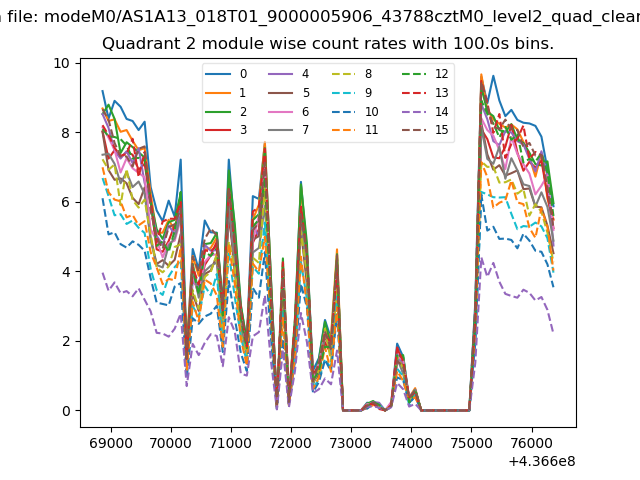
| Module-wise count rates for Quadrant B Data is divided into 100 sec bins |
 |
 |
| Module-wise count rates for Quadrant C Data is divided into 100 sec bins |
 |
 |
| Module-wise count rates for Quadrant D Data is divided into 100 sec bins |
 |
 |
| Parameter | Plot |
|---|---|
| CZT HV Monitor | 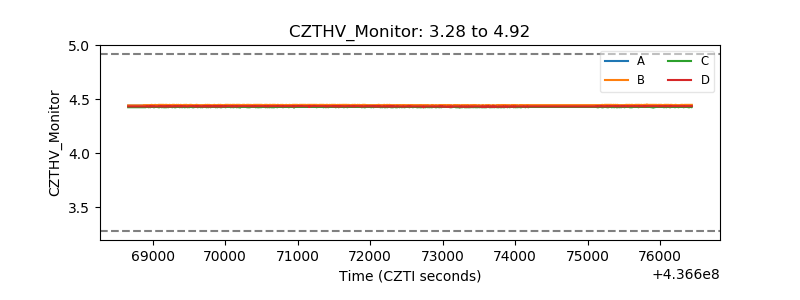 |
| D_VDD | 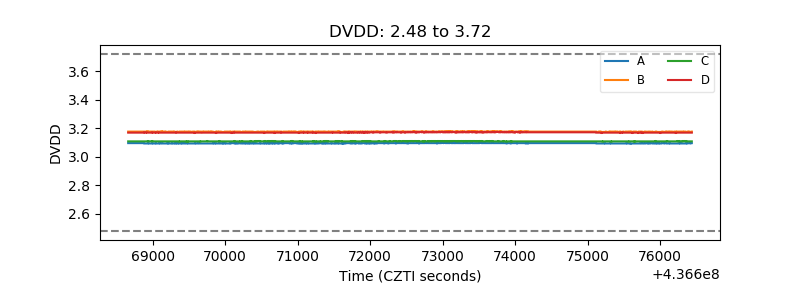 |
| Temperature 1 | 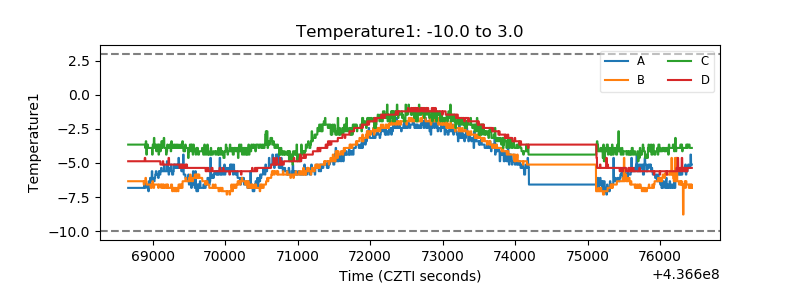 |
| Veto HV Monitor |  |
| Veto LLD | 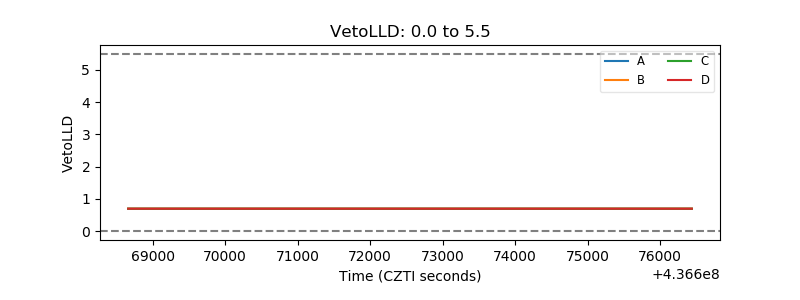 |
| Alpha Counter | 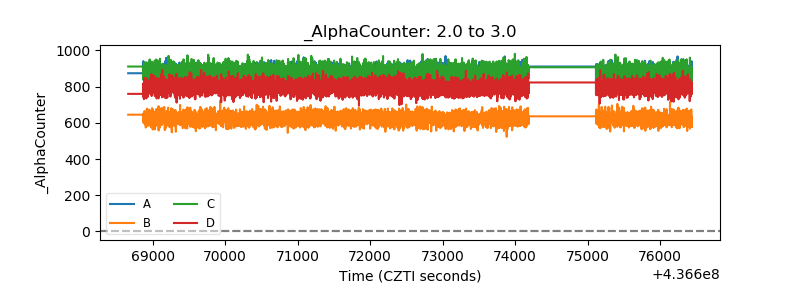 |
| _CPM_Rate | 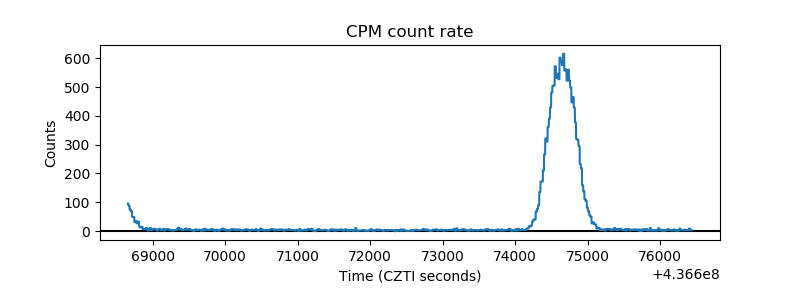 |
| CZT Counter | 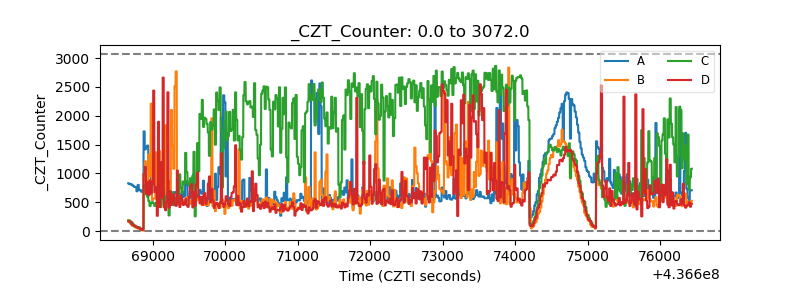 |
| +2.5 Volts monitor | 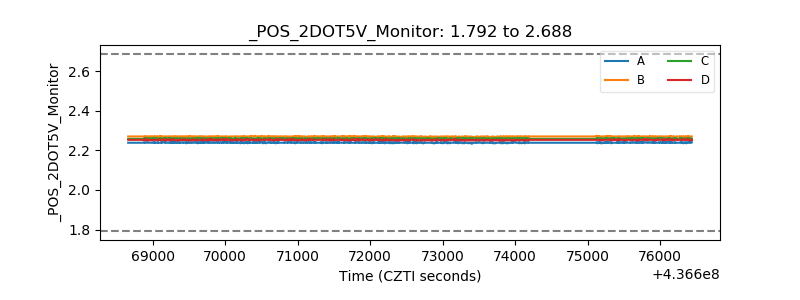 |
| +5 Volts monitor | 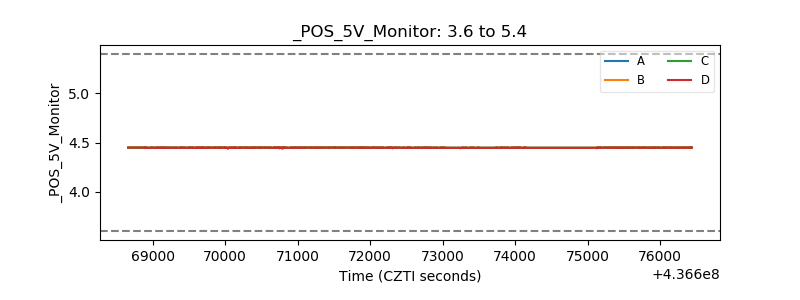 |
| _ROLL_ROT | 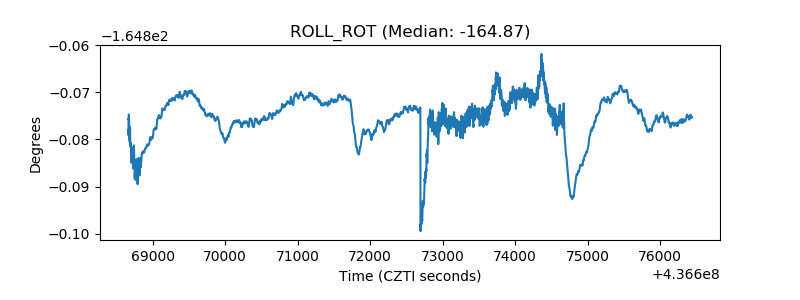 |
| _Roll_DEC | 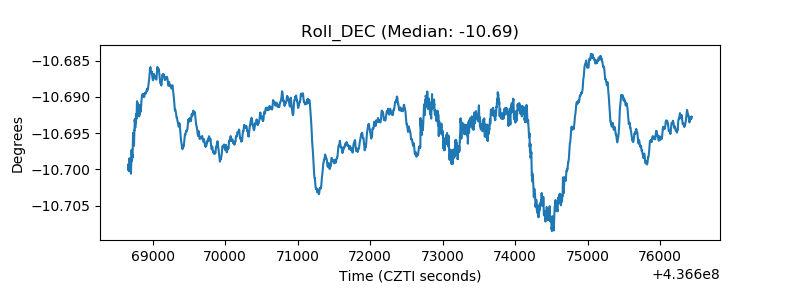 |
| _Roll_RA | 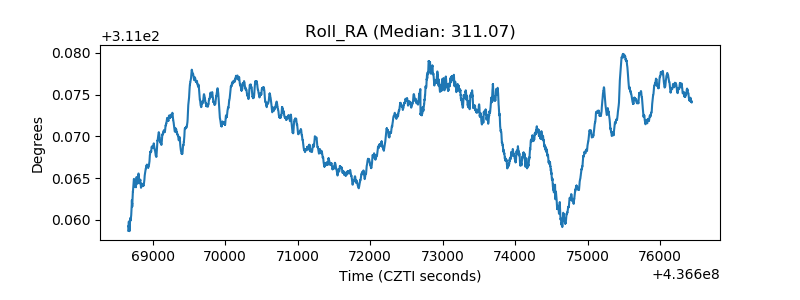 |
| Veto Counter | 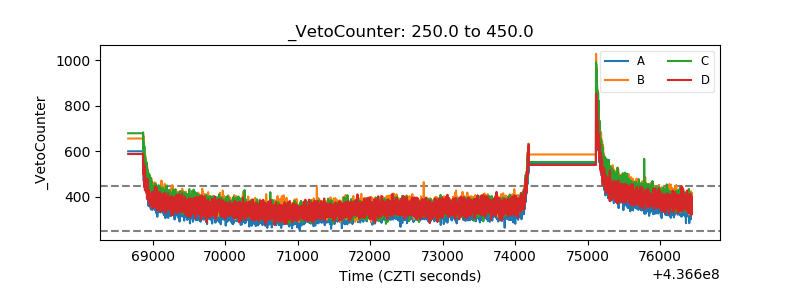 |