| Param | Original file | Final file |
|---|---|---|
| Filename | modeM0/AS1A13_018T01_9000005906_43790cztM0_level2.fits | modeM0/AS1A13_018T01_9000005906_43790cztM0_level2_quad_clean.evt |
| Size (bytes) | 635,952,960 | 105,387,840 |
| Size | 606.5 MB | 100.5 MB |
| Events in quadrant A | 4,758,761 | 725,113 |
| Events in quadrant B | 4,249,584 | 760,478 |
| Events in quadrant C | 8,646,237 | 615,484 |
| Events in quadrant D | 5,384,322 | 637,123 |
| Mode M0 | |||
|---|---|---|---|
| Quadrant | BADHDUFLAG | Total packets | Discarded packets |
| A | 0 | 18539 | 2 |
| B | 0 | 16960 | 2 |
| C | 0 | 30176 | 6 |
| D | 0 | 20418 | 2 |
| Mode SS | |||
|---|---|---|---|
| Quadrant | BADHDUFLAG | Total packets | Discarded packets |
| A | 0 | 132 | 0 |
| B | 0 | 132 | 0 |
| C | 0 | 132 | 0 |
| D | 0 | 132 | 0 |
| Mode M9 | |||
|---|---|---|---|
| Quadrant | BADHDUFLAG | Total packets | Discarded packets |
| A | 0 | 15 | 0 |
| B | 0 | 16 | 0 |
| C | 0 | 16 | 0 |
| D | 0 | 16 | 0 |
| Quadrant | Total seconds | Saturated seconds | Saturation percentage |
|---|---|---|---|
| A | 6489 | 259 | 3.991370% |
| B | 6489 | 203 | 3.128371% |
| C | 6488 | 1406 | 21.670777% |
| D | 6488 | 474 | 7.305795% |
Noise dominated data is calculated using 1-second bins in cleaned event files. If a bin has >2000 counts, and if more than 50% of those come from <1% of pixels, then it is considered to be noise-dominated and hence unusable.
| Quadrant | # 1 sec bins | Bins with >0 counts | Bins with >2000 counts | High rate bins dominated by noise | Noise dominated (total time) | Noise dominated (detector-on time) | Marked lightcurve |
|---|---|---|---|---|---|---|---|
| A | 7569 | 6490 | 94 | 94 | 1.24% | 1.45% | 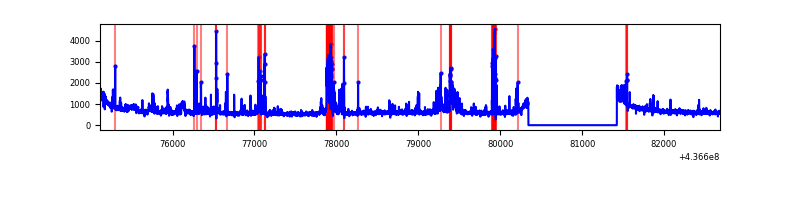 |
| B | 7569 | 6490 | 64 | 64 | 0.85% | 0.99% | 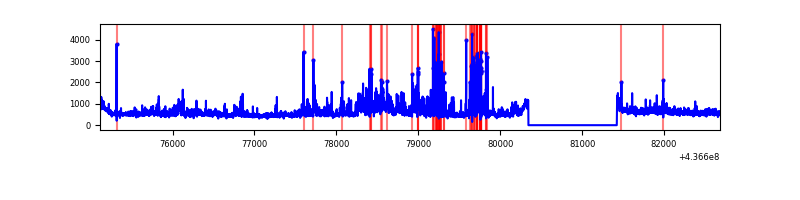 |
| C | 7568 | 6489 | 1357 | 1357 | 17.93% | 20.91% | 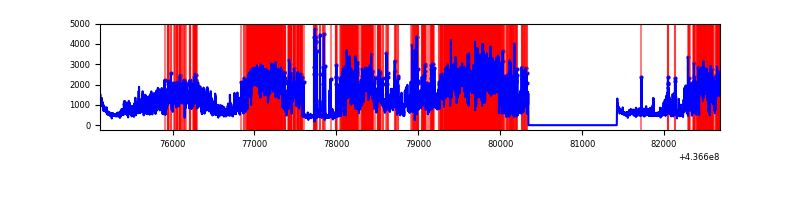 |
| D | 7568 | 6489 | 291 | 291 | 3.85% | 4.48% | 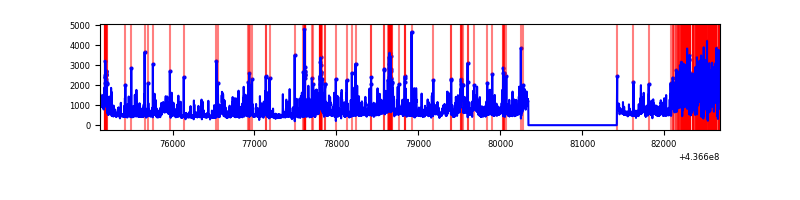 |
Top three noisy pixels from each quadrant. If the there are fewer than three noisy pixels in the level2.evt file, extra rows are filled as -1
| Pixel properties | Quadrant properties | ||||||
|---|---|---|---|---|---|---|---|
| Quadrant | DetID | PixID | Counts | Sigma | Mean | Median | Sigma |
| A | 10 | 83 | 1000957 | 6279.49 | 767 | 754 | 159.3 |
| A | 15 | 223 | 736550 | 4619.49 | 767 | 754 | 159.3 |
| A | 13 | 6 | 14207 | 84.46 | 767 | 754 | 159.3 |
| B | 7 | 205 | 376084 | 2478.44 | 772 | 749 | 151.4 |
| B | 0 | 200 | 264699 | 1742.93 | 772 | 749 | 151.4 |
| B | 0 | 219 | 166518 | 1094.62 | 772 | 749 | 151.4 |
| C | 15 | 174 | 5028887 | 29561.23 | 725 | 730 | 170.1 |
| C | 15 | 158 | 453370 | 2661.13 | 725 | 730 | 170.1 |
| C | 15 | 190 | 89464 | 521.68 | 725 | 730 | 170.1 |
| D | 12 | 33 | 998132 | 5256.79 | 743 | 720 | 189.7 |
| D | 2 | 120 | 463625 | 2439.71 | 743 | 720 | 189.7 |
| D | 1 | 52 | 259846 | 1365.7 | 743 | 720 | 189.7 |
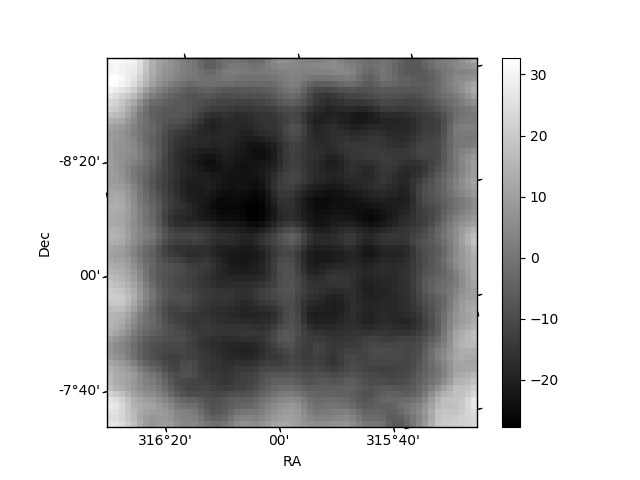
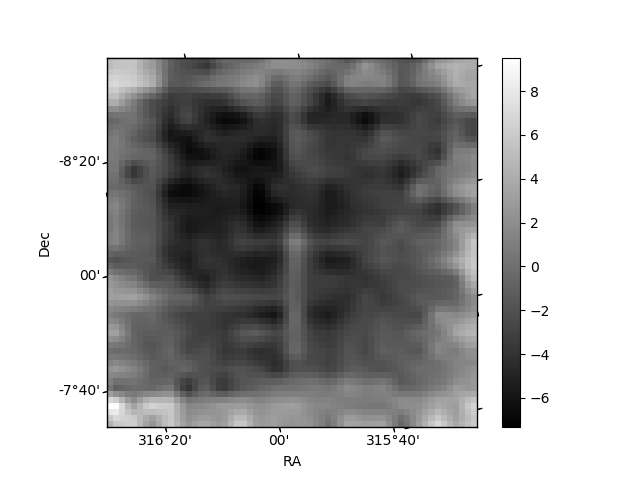
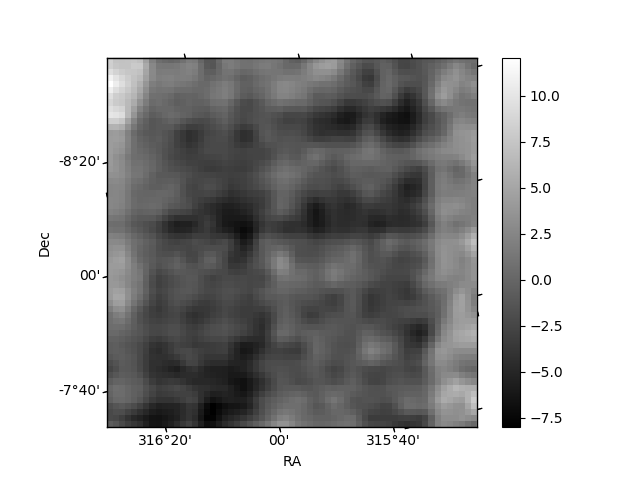
Histogram calculated using DETX and DETY for each event in the final _common_clean file
| Quadrant A | 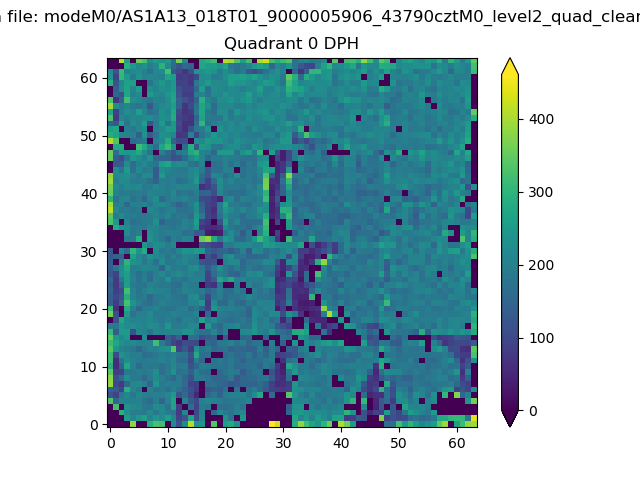 |
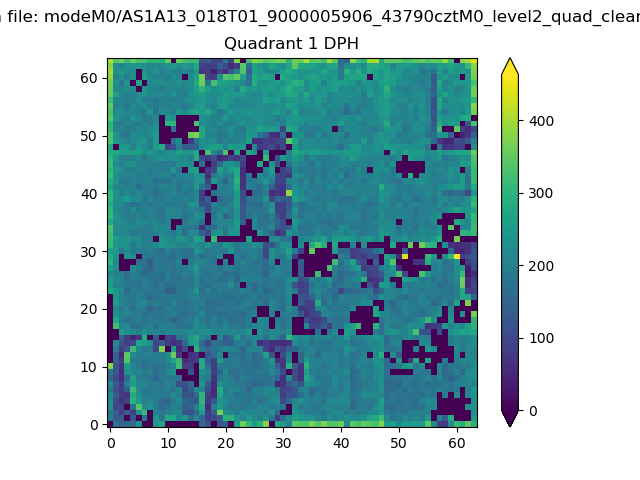 |
Quadrant B |
|---|---|---|---|
| Quadrant D | 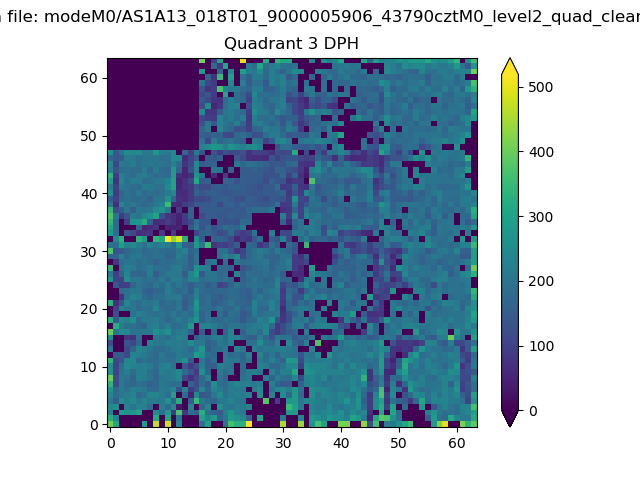 |
 |
Quadrant C |
| Plot type | Count rate plots | Images |
|---|---|---|
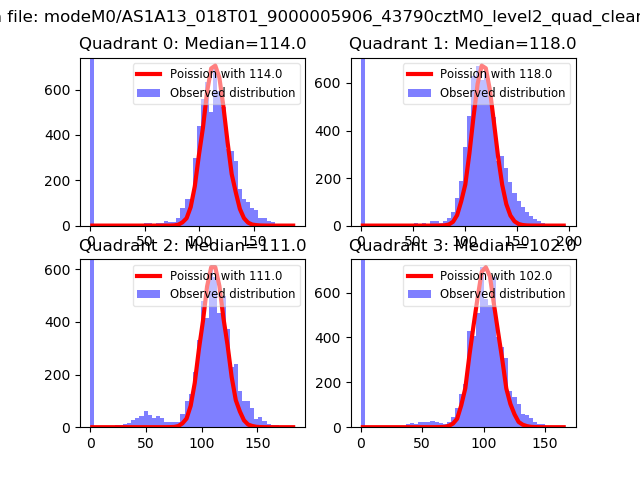
| Comparison with Poisson distribution Blue bars denote a histogram of data divided into 1 sec bins. Red curve is a Poisson curve with rate = median count rate of data. |
 |
 |
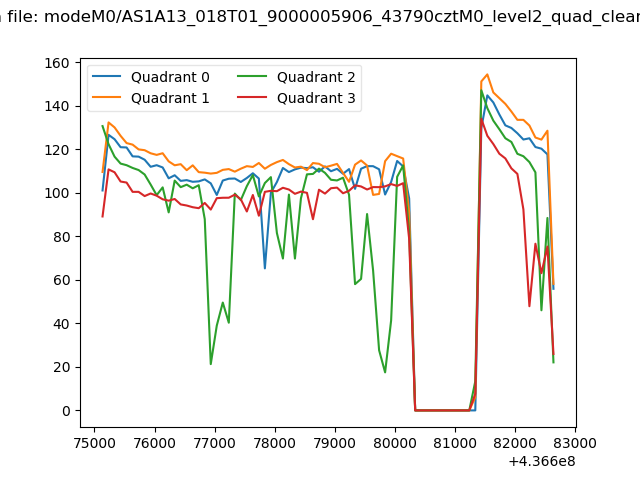
| Quadrant-wise count rates Data is divided into 100 sec bins |
 |
|
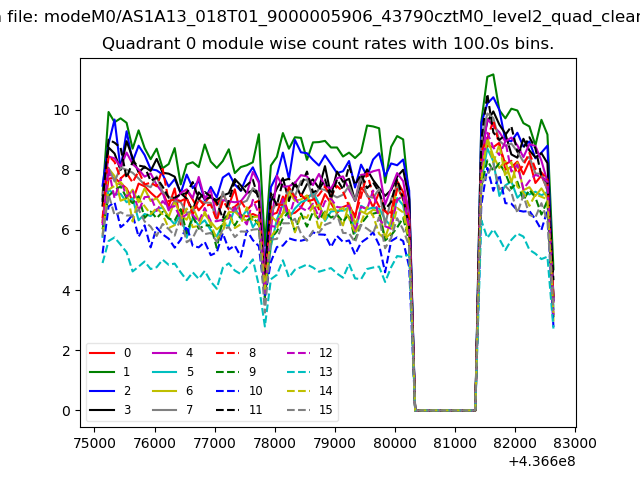
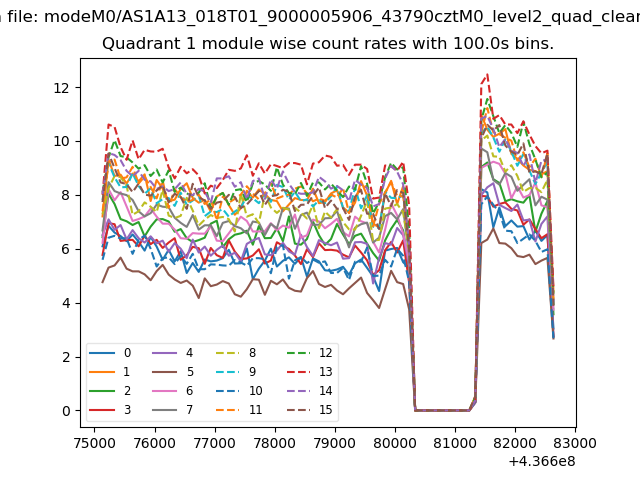
| Module-wise count rates for Quadrant A Data is divided into 100 sec bins |
 |
 |
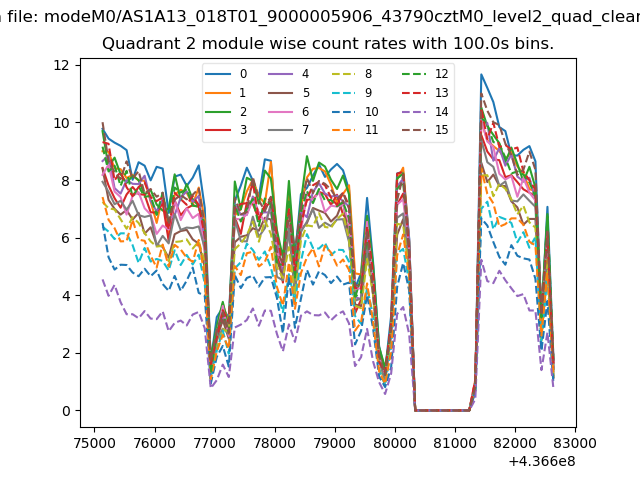
| Module-wise count rates for Quadrant B Data is divided into 100 sec bins |
 |
 |
| Module-wise count rates for Quadrant C Data is divided into 100 sec bins |
 |
 |
| Module-wise count rates for Quadrant D Data is divided into 100 sec bins |
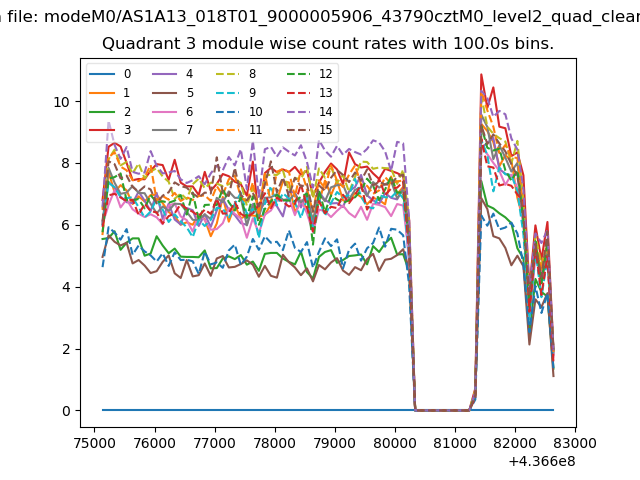 |
 |
| Parameter | Plot |
|---|---|
| CZT HV Monitor | 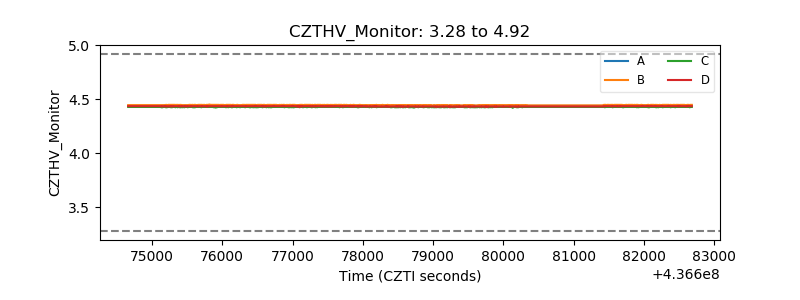 |
| D_VDD | 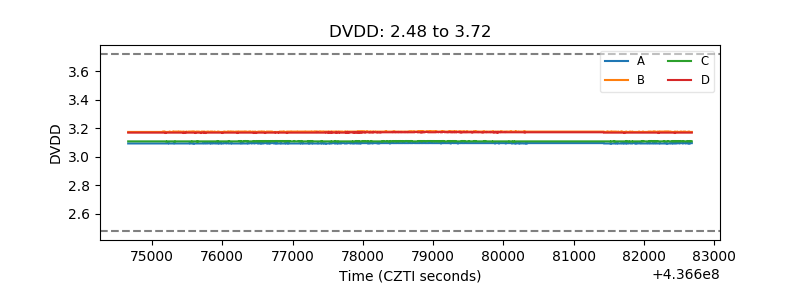 |
| Temperature 1 | 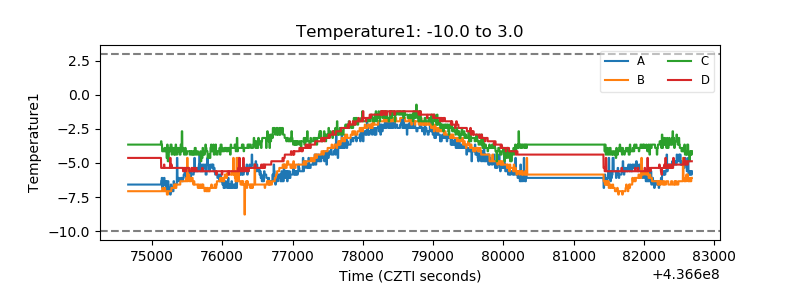 |
| Veto HV Monitor | 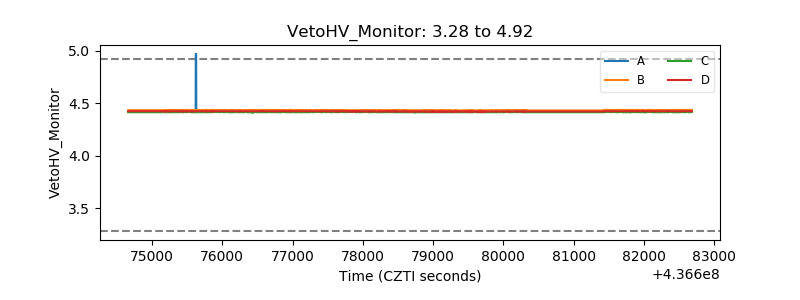 |
| Veto LLD | 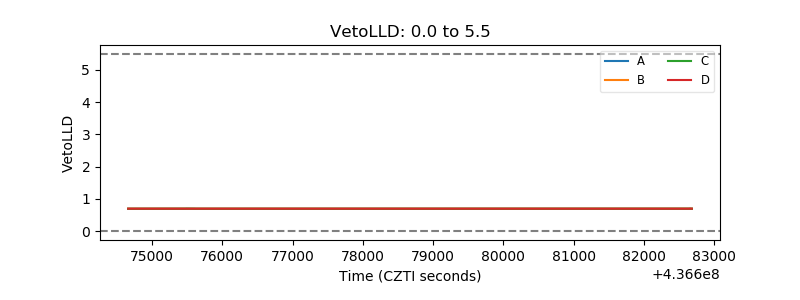 |
| Alpha Counter | 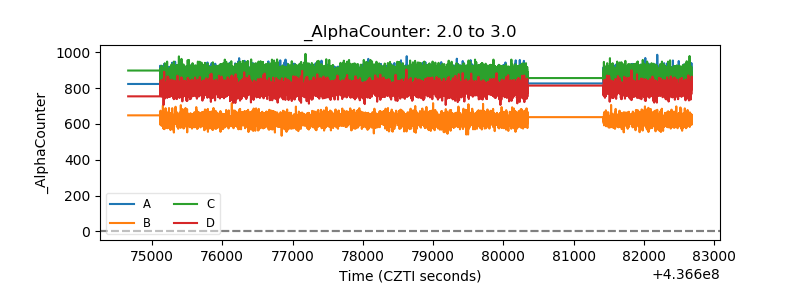 |
| _CPM_Rate | 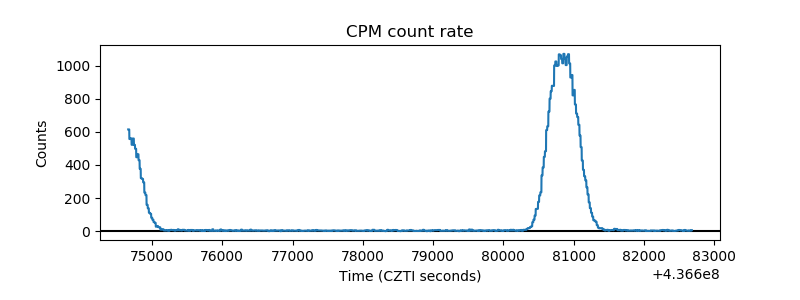 |
| CZT Counter |  |
| +2.5 Volts monitor | 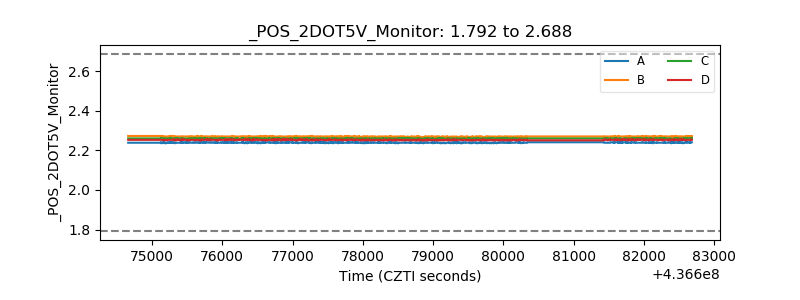 |
| +5 Volts monitor | 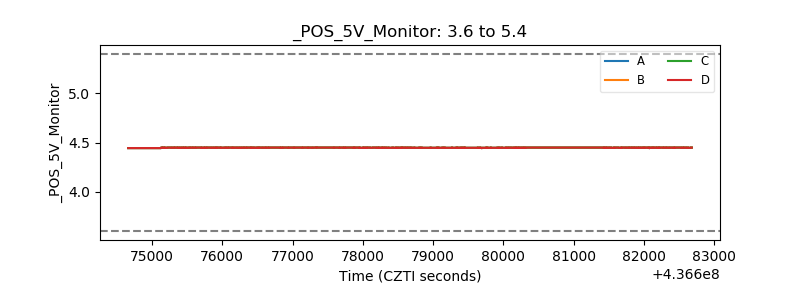 |
| _ROLL_ROT | 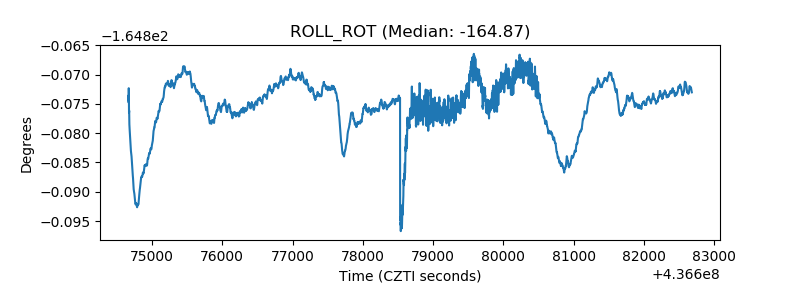 |
| _Roll_DEC | 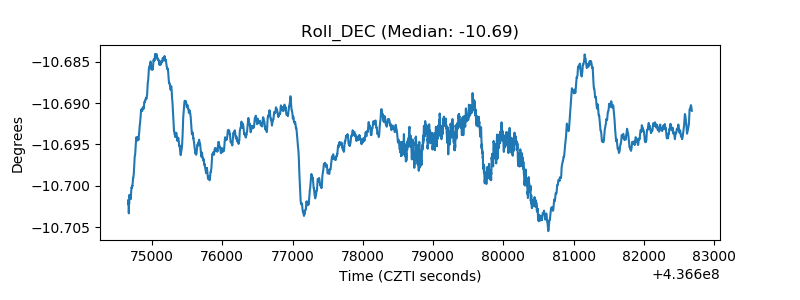 |
| _Roll_RA | 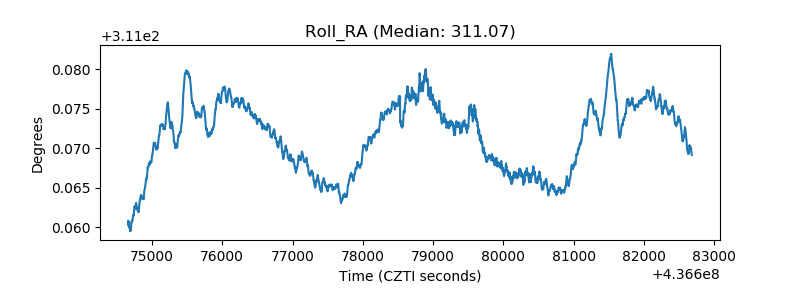 |
| Veto Counter | 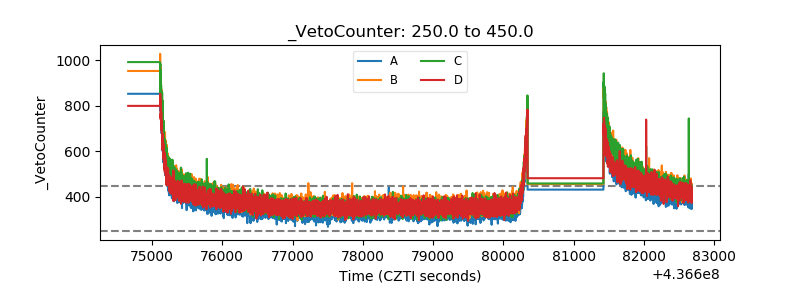 |