| Param | Original file | Final file |
|---|---|---|
| Filename | modeM0/AS1A13_018T01_9000005906_43792cztM0_level2.fits | modeM0/AS1A13_018T01_9000005906_43792cztM0_level2_quad_clean.evt |
| Size (bytes) | 748,198,080 | 108,616,320 |
| Size | 713.5 MB | 103.6 MB |
| Events in quadrant A | 4,741,724 | 813,693 |
| Events in quadrant B | 3,755,124 | 862,201 |
| Events in quadrant C | 9,321,870 | 567,370 |
| Events in quadrant D | 9,379,733 | 597,183 |
| Mode M0 | |||
|---|---|---|---|
| Quadrant | BADHDUFLAG | Total packets | Discarded packets |
| A | 0 | 18648 | 2 |
| B | 0 | 15229 | 2 |
| C | 0 | 31990 | 2 |
| D | 0 | 32360 | 2 |
| Mode SS | |||
|---|---|---|---|
| Quadrant | BADHDUFLAG | Total packets | Discarded packets |
| A | 0 | 130 | 0 |
| B | 0 | 130 | 0 |
| C | 0 | 130 | 0 |
| D | 0 | 130 | 0 |
| Mode M9 | |||
|---|---|---|---|
| Quadrant | BADHDUFLAG | Total packets | Discarded packets |
| A | 0 | 16 | 0 |
| B | 0 | 17 | 0 |
| C | 0 | 17 | 0 |
| D | 0 | 17 | 0 |
| Quadrant | Total seconds | Saturated seconds | Saturation percentage |
|---|---|---|---|
| A | 6430 | 324 | 5.038880% |
| B | 6430 | 185 | 2.877138% |
| C | 6430 | 2376 | 36.951788% |
| D | 6430 | 1738 | 27.029549% |
Noise dominated data is calculated using 1-second bins in cleaned event files. If a bin has >2000 counts, and if more than 50% of those come from <1% of pixels, then it is considered to be noise-dominated and hence unusable.
| Quadrant | # 1 sec bins | Bins with >0 counts | Bins with >2000 counts | High rate bins dominated by noise | Noise dominated (total time) | Noise dominated (detector-on time) | Marked lightcurve |
|---|---|---|---|---|---|---|---|
| A | 7620 | 6431 | 128 | 128 | 1.68% | 1.99% | 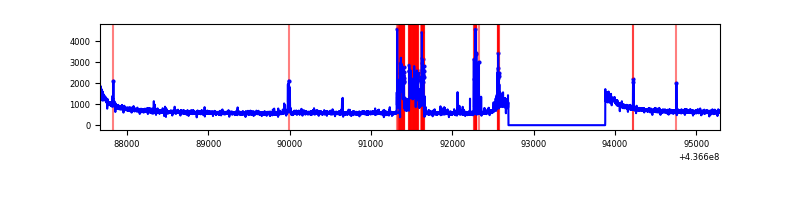 |
| B | 7620 | 6431 | 20 | 20 | 0.26% | 0.31% | 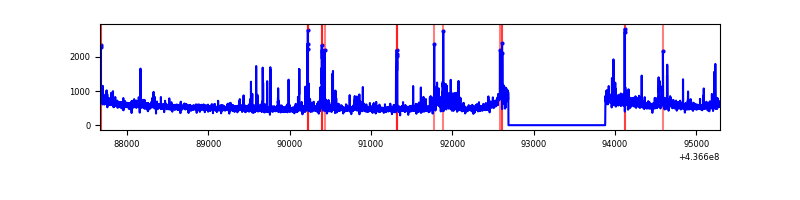 |
| C | 7620 | 6430 | 2128 | 2128 | 27.93% | 33.09% | 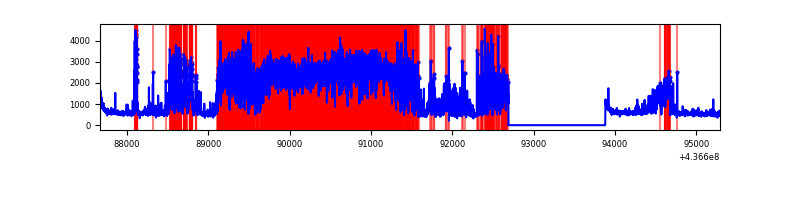 |
| D | 7620 | 6431 | 1473 | 1473 | 19.33% | 22.90% | 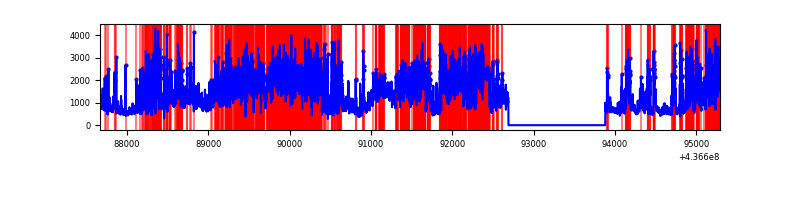 |
Top three noisy pixels from each quadrant. If the there are fewer than three noisy pixels in the level2.evt file, extra rows are filled as -1
| Pixel properties | Quadrant properties | ||||||
|---|---|---|---|---|---|---|---|
| Quadrant | DetID | PixID | Counts | Sigma | Mean | Median | Sigma |
| A | 10 | 83 | 987192 | 5864.22 | 827 | 813 | 168.2 |
| A | 15 | 223 | 452193 | 2683.54 | 827 | 813 | 168.2 |
| A | 13 | 248 | 80451 | 473.46 | 827 | 813 | 168.2 |
| B | 0 | 200 | 231580 | 1439.74 | 828 | 806 | 160.3 |
| B | 0 | 183 | 61068 | 375.96 | 828 | 806 | 160.3 |
| B | 7 | 205 | 40469 | 247.45 | 828 | 806 | 160.3 |
| C | 15 | 174 | 4712397 | 28289.1 | 721 | 726 | 166.6 |
| C | 15 | 190 | 727256 | 4362.12 | 721 | 726 | 166.6 |
| C | 15 | 158 | 445955 | 2673.18 | 721 | 726 | 166.6 |
| D | 12 | 33 | 3610922 | 18715.69 | 750 | 726 | 192.9 |
| D | 5 | 222 | 1651544 | 8558.04 | 750 | 726 | 192.9 |
| D | 12 | 2 | 230804 | 1192.75 | 750 | 726 | 192.9 |
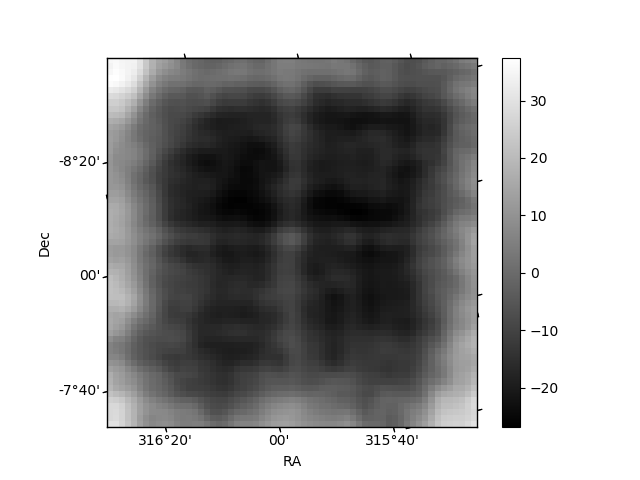
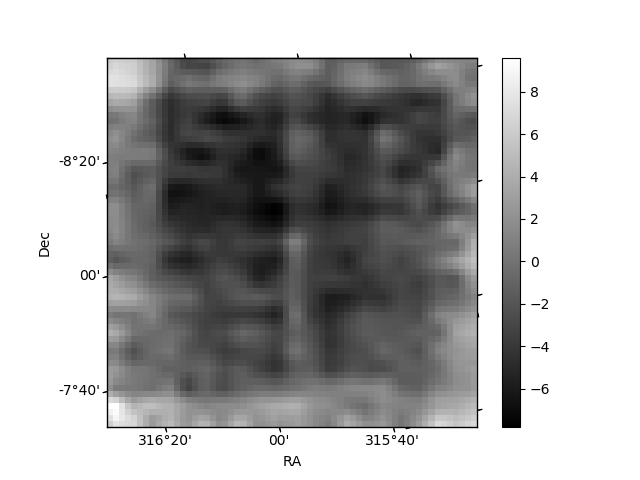
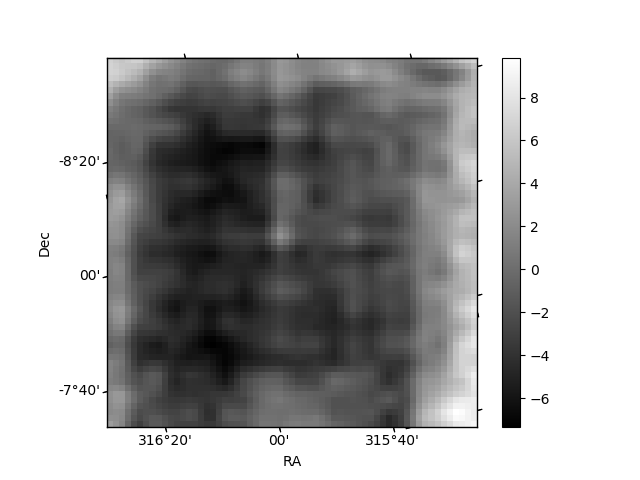
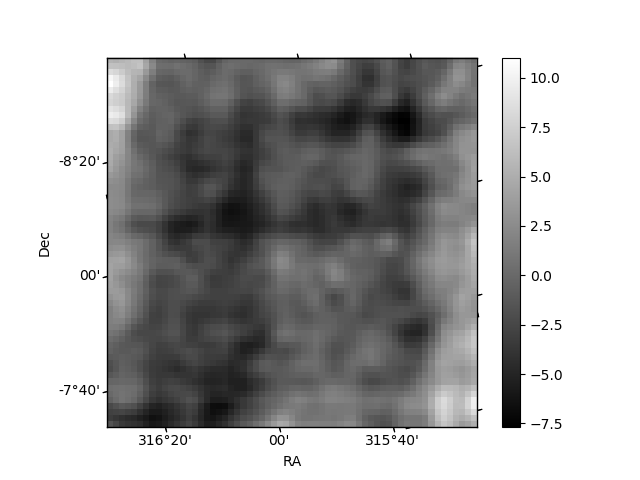
Histogram calculated using DETX and DETY for each event in the final _common_clean file
| Quadrant A | 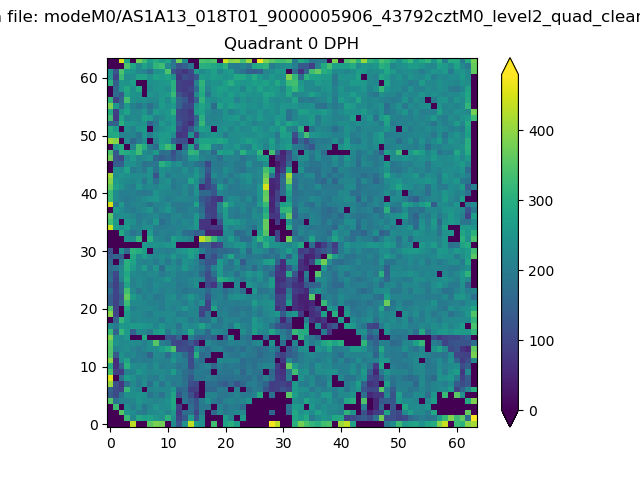 |
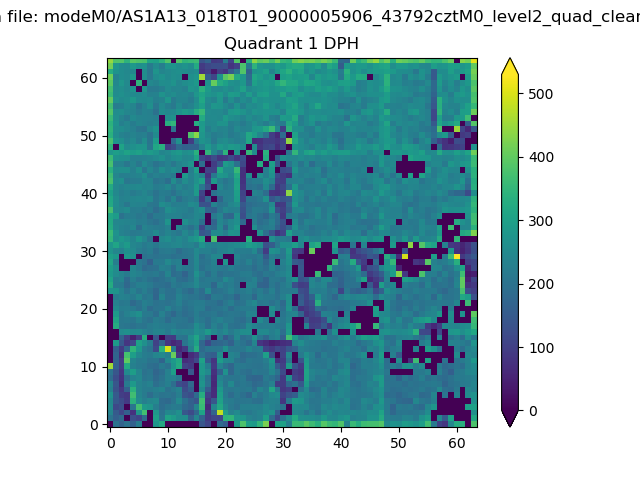 |
Quadrant B |
|---|---|---|---|
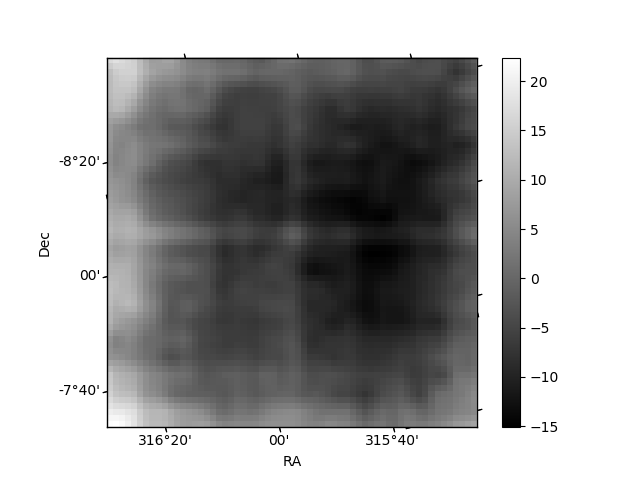
| Quadrant D | 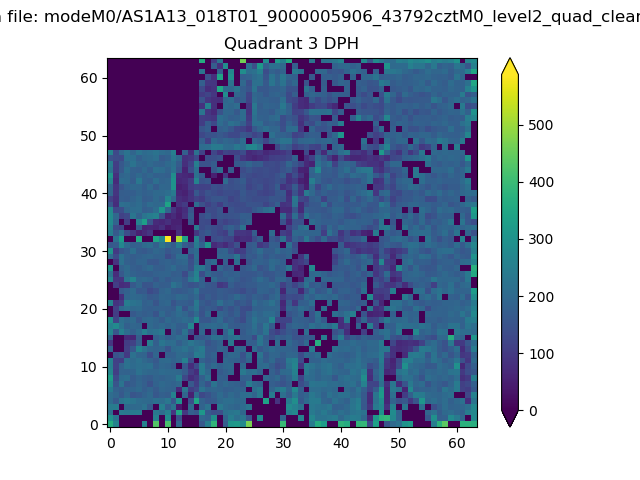 |
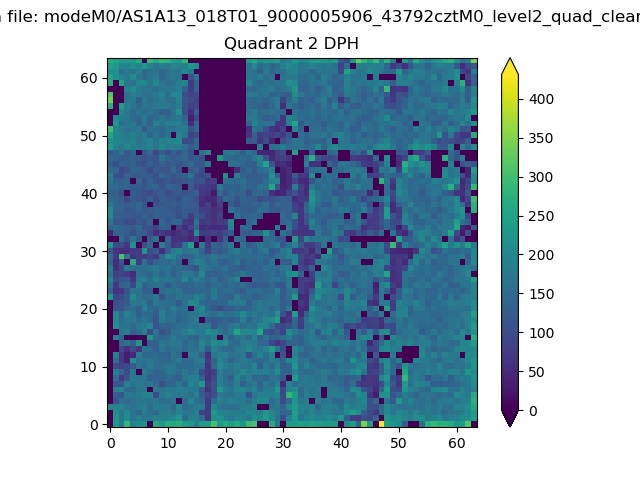 |
Quadrant C |
| Plot type | Count rate plots | Images |
|---|---|---|
| Comparison with Poisson distribution Blue bars denote a histogram of data divided into 1 sec bins. Red curve is a Poisson curve with rate = median count rate of data. |
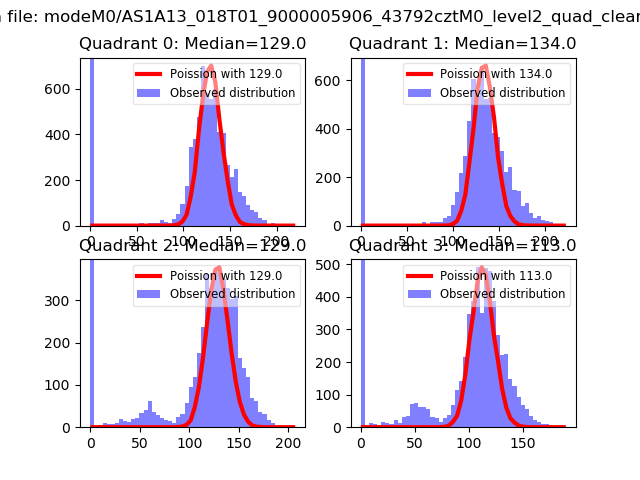 |
 |
| Quadrant-wise count rates Data is divided into 100 sec bins |
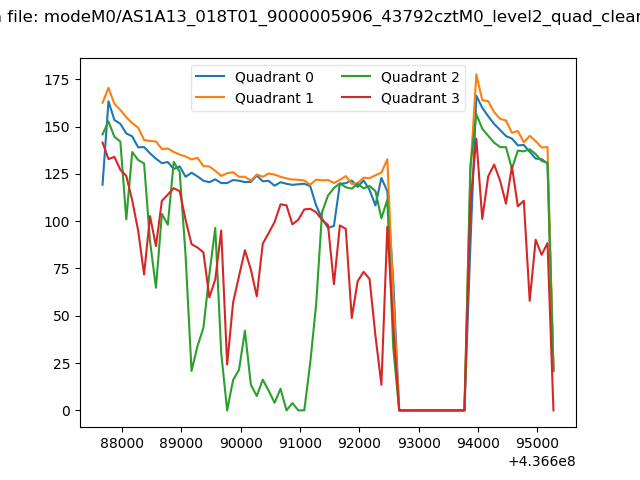 |
|
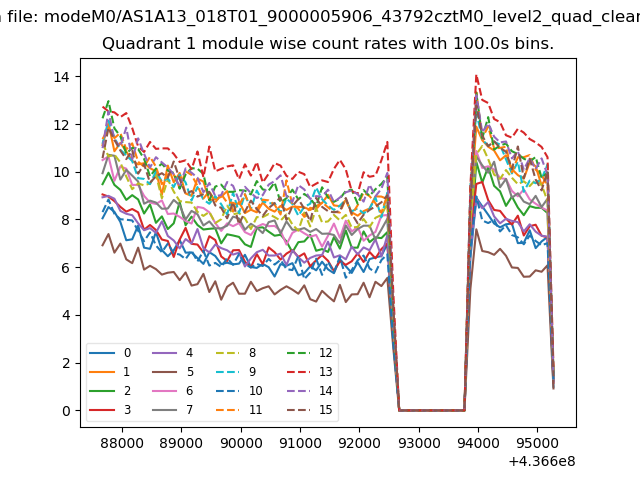
| Module-wise count rates for Quadrant A Data is divided into 100 sec bins |
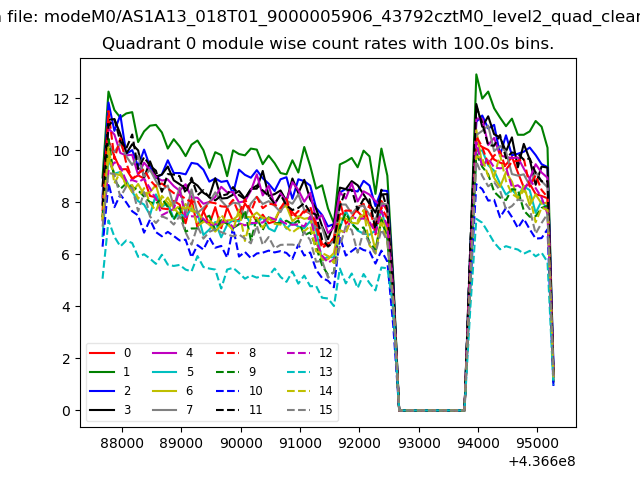 |
 |
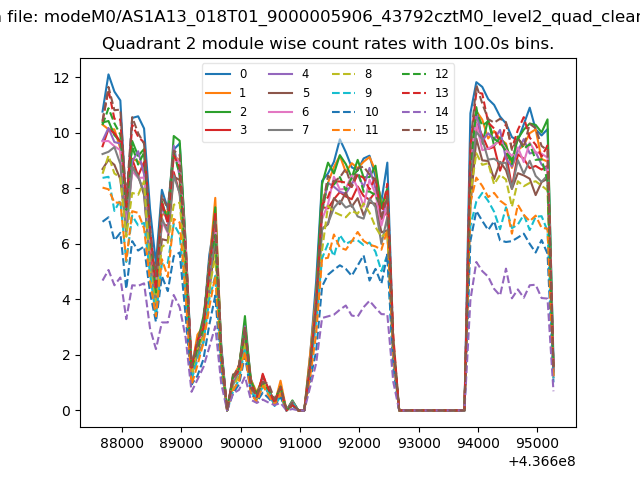
| Module-wise count rates for Quadrant B Data is divided into 100 sec bins |
 |
 |
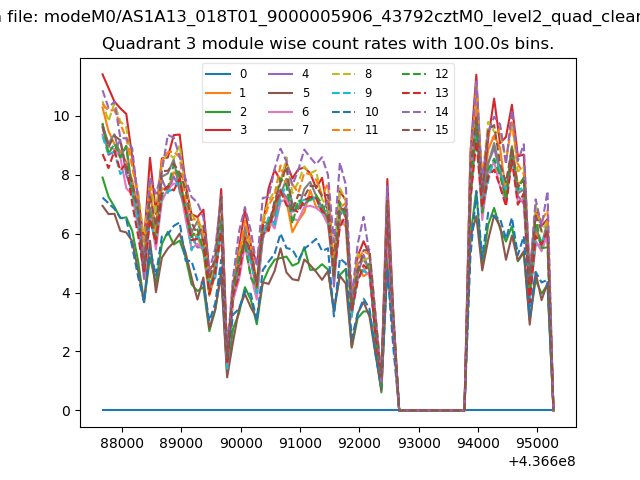
| Module-wise count rates for Quadrant C Data is divided into 100 sec bins |
 |
 |
| Module-wise count rates for Quadrant D Data is divided into 100 sec bins |
 |
 |
| Parameter | Plot |
|---|---|
| CZT HV Monitor | 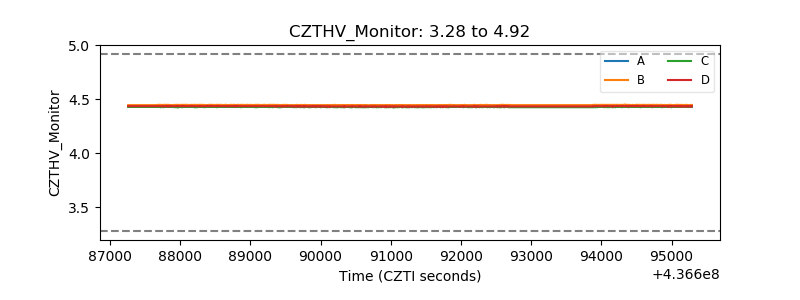 |
| D_VDD | 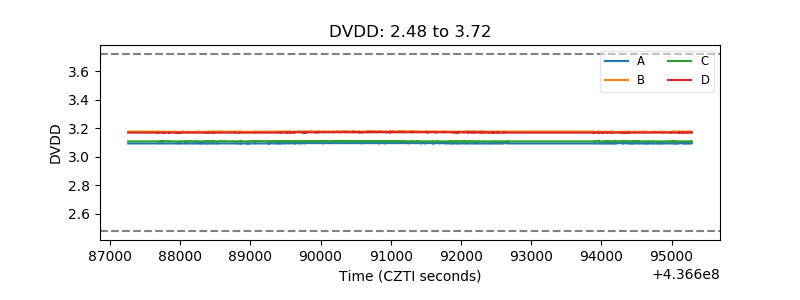 |
| Temperature 1 | 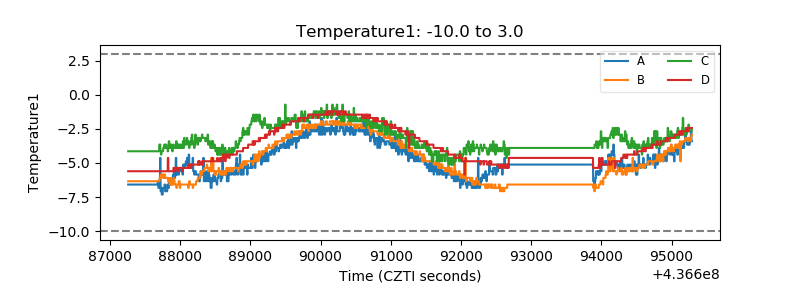 |
| Veto HV Monitor | 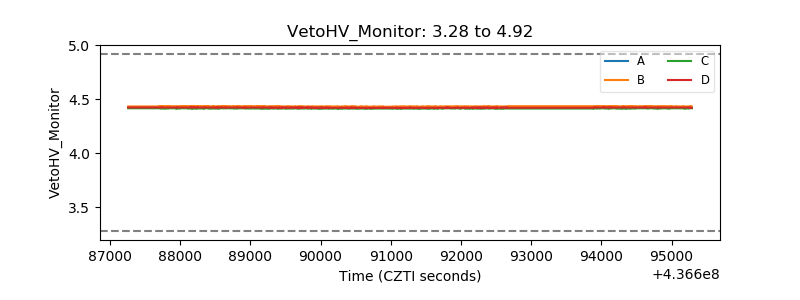 |
| Veto LLD | 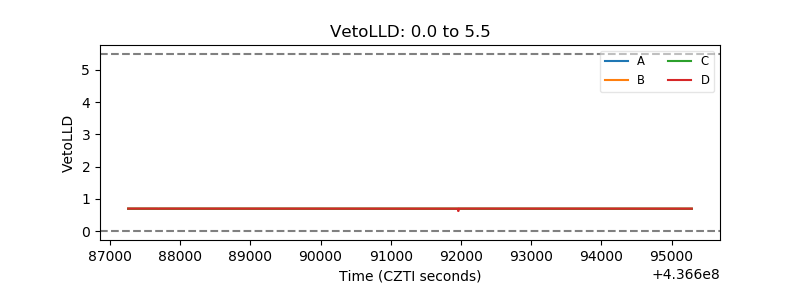 |
| Alpha Counter | 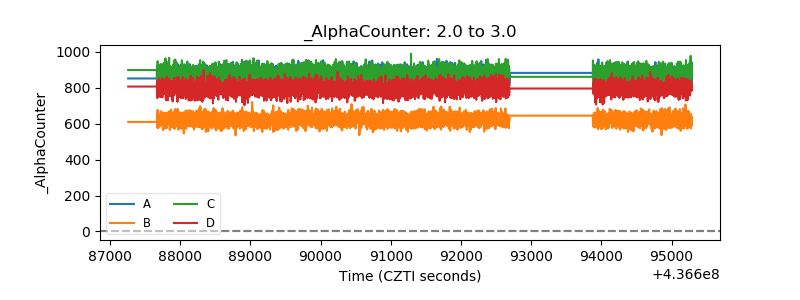 |
| _CPM_Rate | 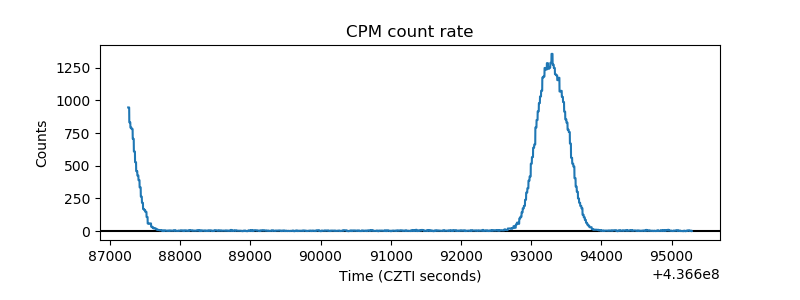 |
| CZT Counter | 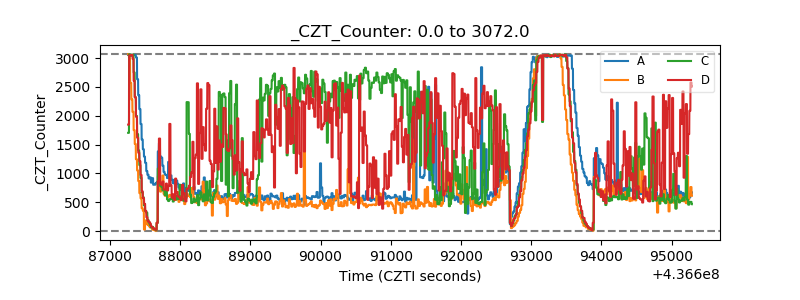 |
| +2.5 Volts monitor | 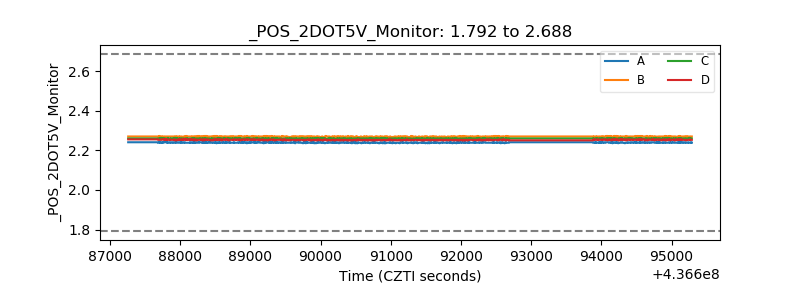 |
| +5 Volts monitor | 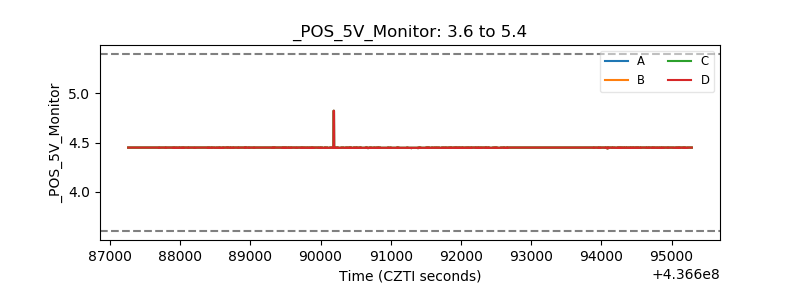 |
| _ROLL_ROT | 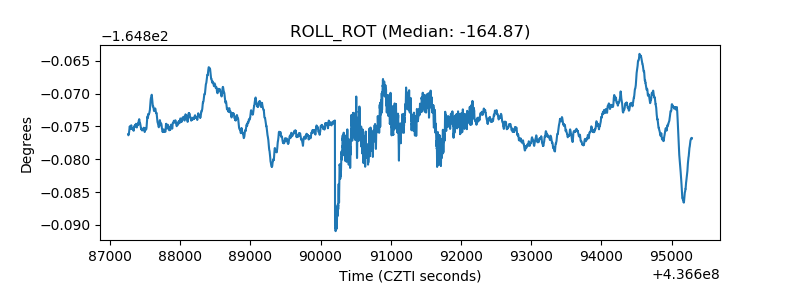 |
| _Roll_DEC | 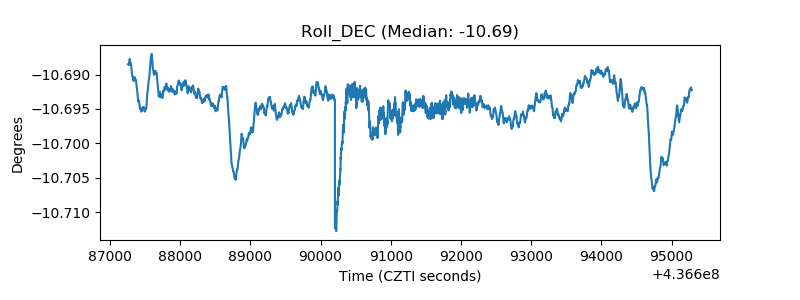 |
| _Roll_RA | 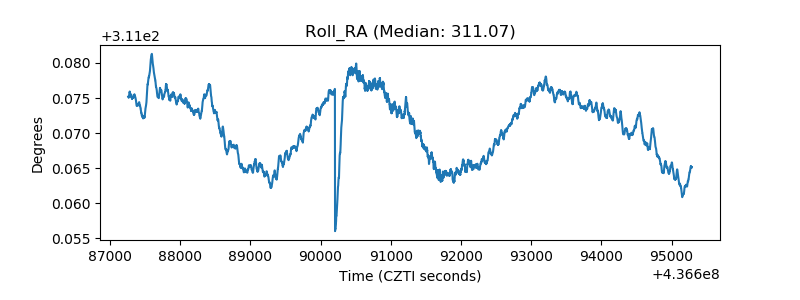 |
| Veto Counter | 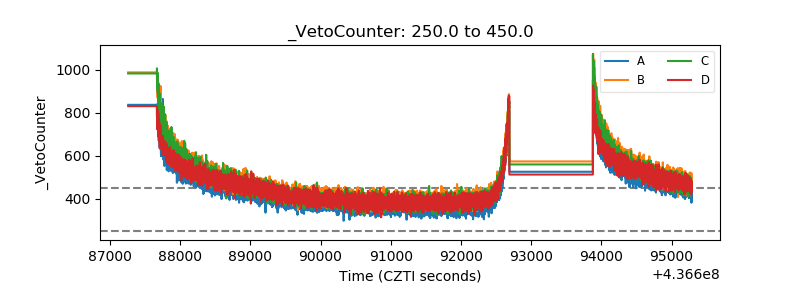 |