| Param | Original file | Final file |
|---|---|---|
| Filename | modeM0/AS1A13_018T01_9000005906_43793cztM0_level2.fits | modeM0/AS1A13_018T01_9000005906_43793cztM0_level2_quad_clean.evt |
| Size (bytes) | 661,268,160 | 114,739,200 |
| Size | 630.6 MB | 109.4 MB |
| Events in quadrant A | 5,123,196 | 801,882 |
| Events in quadrant B | 3,869,796 | 856,240 |
| Events in quadrant C | 6,685,956 | 752,002 |
| Events in quadrant D | 8,300,482 | 614,989 |
| Mode M0 | |||
|---|---|---|---|
| Quadrant | BADHDUFLAG | Total packets | Discarded packets |
| A | 0 | 20221 | 2 |
| B | 0 | 15688 | 2 |
| C | 0 | 24055 | 2 |
| D | 0 | 29196 | 2 |
| Mode SS | |||
|---|---|---|---|
| Quadrant | BADHDUFLAG | Total packets | Discarded packets |
| A | 0 | 130 | 0 |
| B | 0 | 130 | 0 |
| C | 0 | 130 | 0 |
| D | 0 | 130 | 0 |
| Mode M9 | |||
|---|---|---|---|
| Quadrant | BADHDUFLAG | Total packets | Discarded packets |
| A | 0 | 18 | 0 |
| B | 0 | 19 | 0 |
| C | 0 | 19 | 0 |
| D | 0 | 19 | 0 |
| Quadrant | Total seconds | Saturated seconds | Saturation percentage |
|---|---|---|---|
| A | 6444 | 431 | 6.688392% |
| B | 6443 | 207 | 3.212789% |
| C | 6443 | 914 | 14.185938% |
| D | 6443 | 1477 | 22.924104% |
Noise dominated data is calculated using 1-second bins in cleaned event files. If a bin has >2000 counts, and if more than 50% of those come from <1% of pixels, then it is considered to be noise-dominated and hence unusable.
| Quadrant | # 1 sec bins | Bins with >0 counts | Bins with >2000 counts | High rate bins dominated by noise | Noise dominated (total time) | Noise dominated (detector-on time) | Marked lightcurve |
|---|---|---|---|---|---|---|---|
| A | 7649 | 6445 | 134 | 134 | 1.75% | 2.08% | 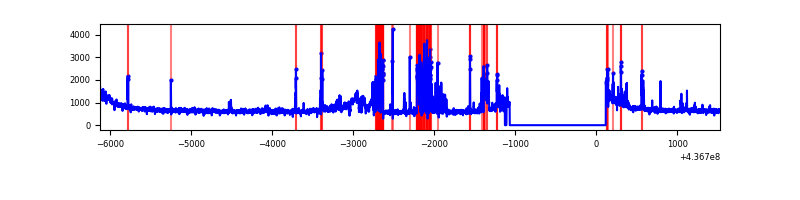 |
| B | 7648 | 6445 | 22 | 22 | 0.29% | 0.34% | 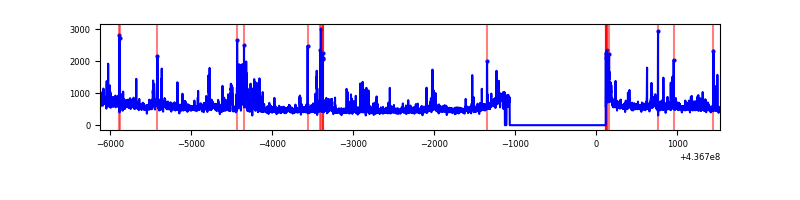 |
| C | 7648 | 6445 | 945 | 945 | 12.36% | 14.66% | 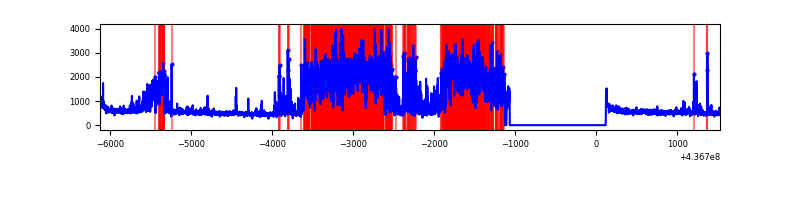 |
| D | 7648 | 6444 | 1193 | 1193 | 15.60% | 18.51% | 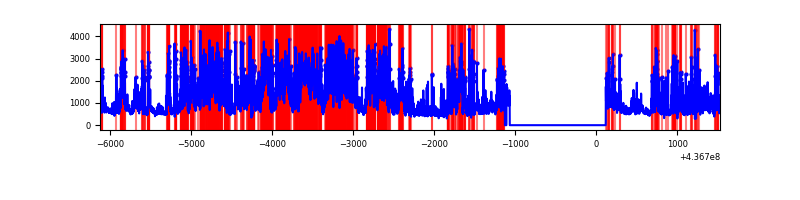 |
Top three noisy pixels from each quadrant. If the there are fewer than three noisy pixels in the level2.evt file, extra rows are filled as -1
| Pixel properties | Quadrant properties | ||||||
|---|---|---|---|---|---|---|---|
| Quadrant | DetID | PixID | Counts | Sigma | Mean | Median | Sigma |
| A | 10 | 83 | 1003296 | 5975.74 | 823 | 807 | 167.8 |
| A | 15 | 223 | 728694 | 4338.86 | 823 | 807 | 167.8 |
| A | 15 | 174 | 100857 | 596.39 | 823 | 807 | 167.8 |
| B | 0 | 200 | 227013 | 1413.14 | 826 | 805 | 160.1 |
| B | 7 | 205 | 88813 | 549.79 | 826 | 805 | 160.1 |
| B | 0 | 183 | 75568 | 467.05 | 826 | 805 | 160.1 |
| C | 15 | 174 | 2763911 | 15111.8 | 787 | 793 | 182.8 |
| C | 15 | 158 | 376711 | 2055.94 | 787 | 793 | 182.8 |
| C | 15 | 157 | 133807 | 727.47 | 787 | 793 | 182.8 |
| D | 12 | 33 | 3403137 | 17945.81 | 753 | 729 | 189.6 |
| D | 5 | 222 | 393940 | 2073.97 | 753 | 729 | 189.6 |
| D | 1 | 52 | 345001 | 1815.84 | 753 | 729 | 189.6 |
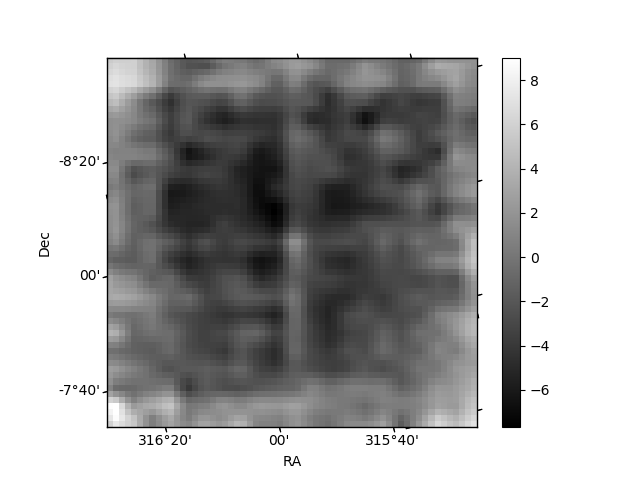
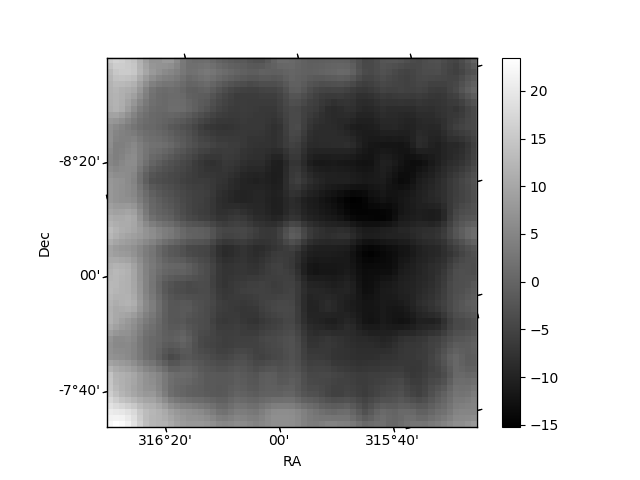
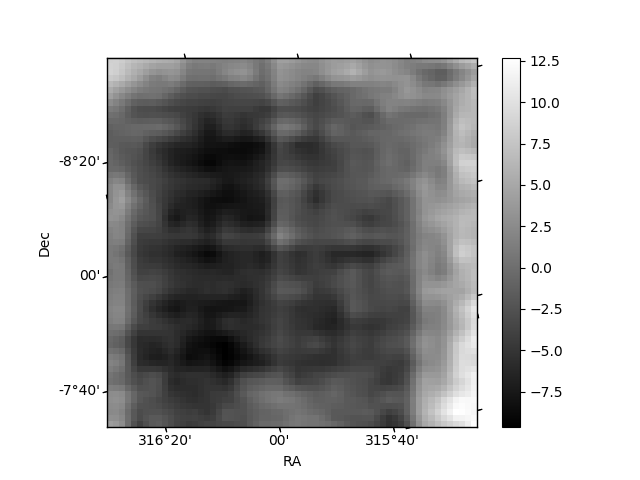
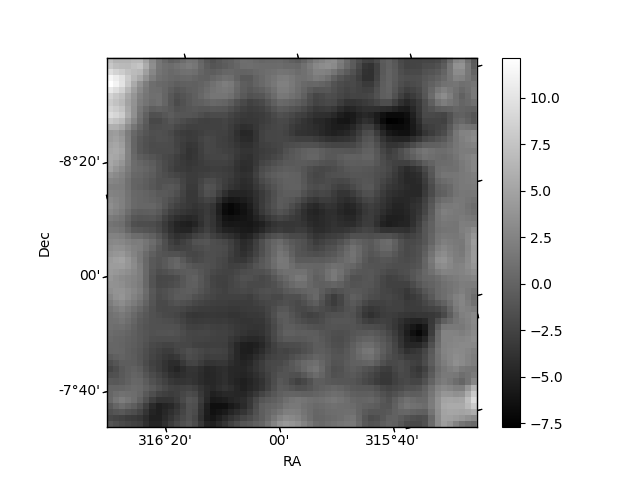
Histogram calculated using DETX and DETY for each event in the final _common_clean file
| Quadrant A | 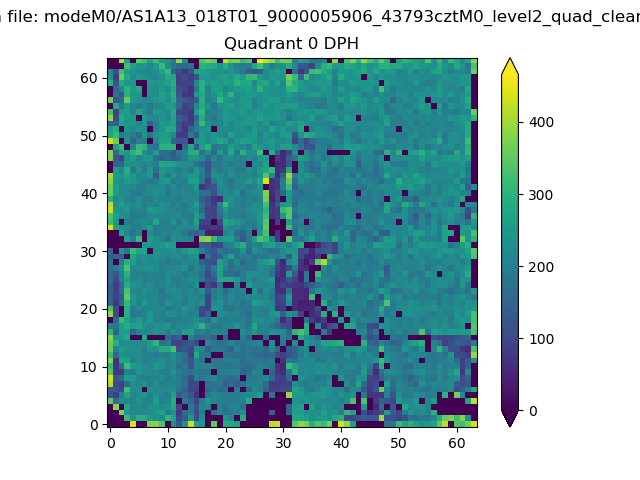 |
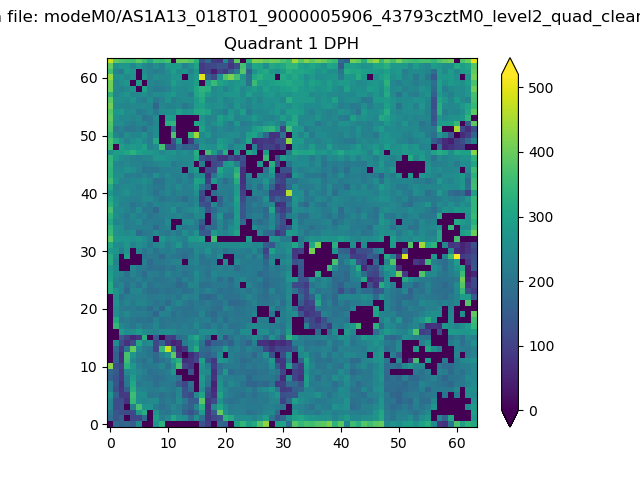 |
Quadrant B |
|---|---|---|---|
| Quadrant D | 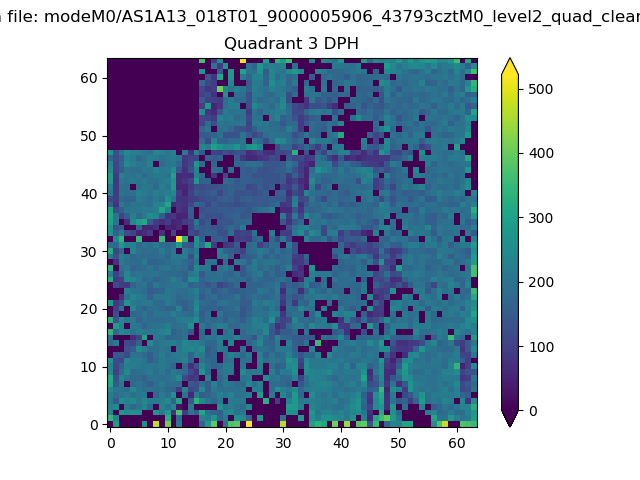 |
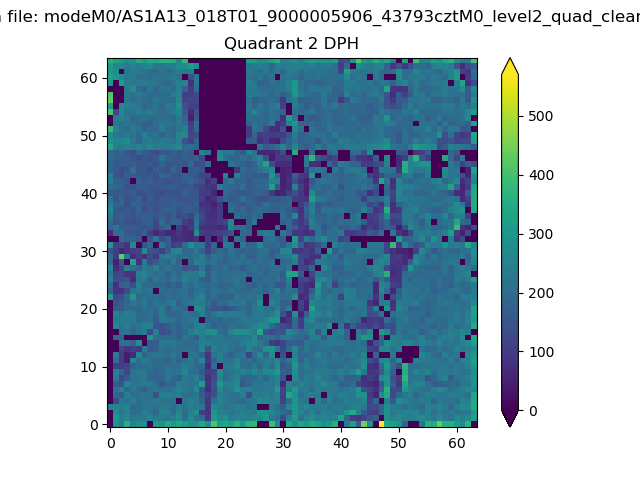 |
Quadrant C |
| Plot type | Count rate plots | Images |
|---|---|---|
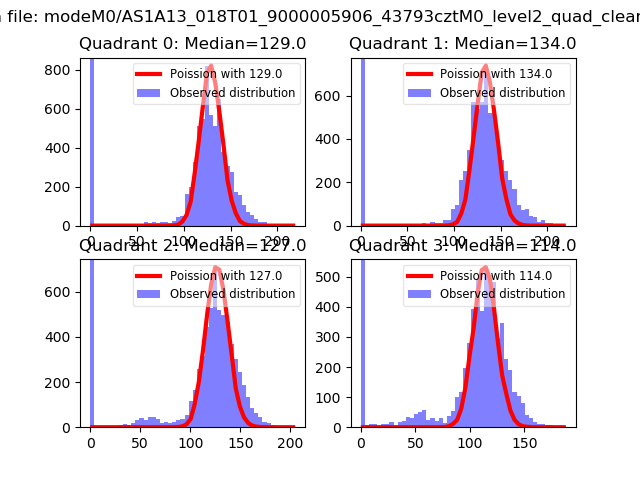
| Comparison with Poisson distribution Blue bars denote a histogram of data divided into 1 sec bins. Red curve is a Poisson curve with rate = median count rate of data. |
 |
 |
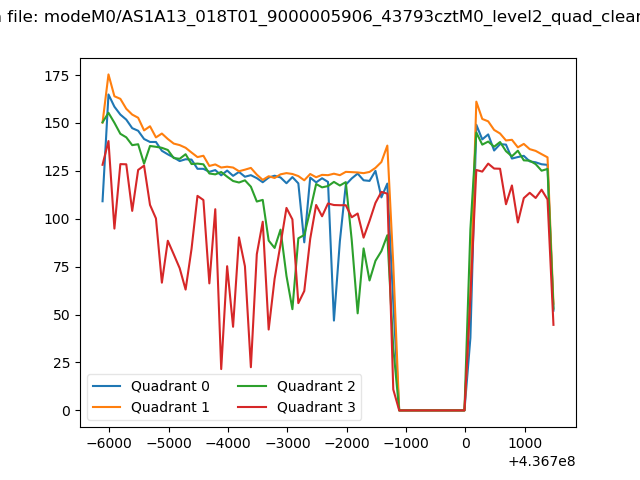
| Quadrant-wise count rates Data is divided into 100 sec bins |
 |
|
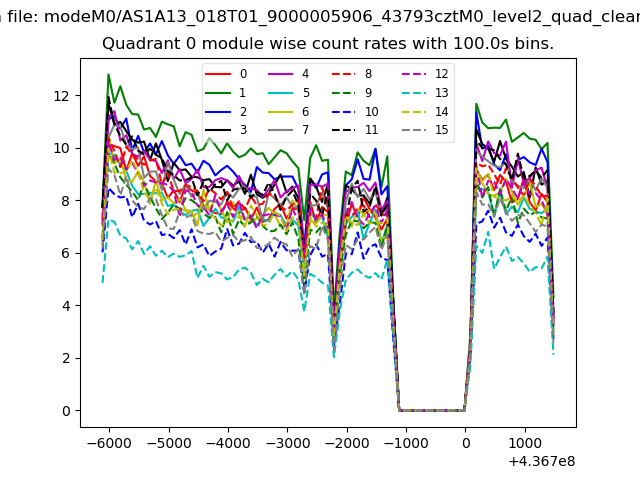
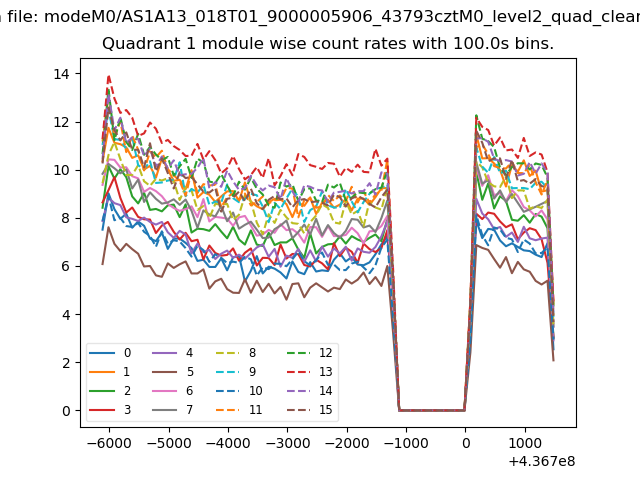
| Module-wise count rates for Quadrant A Data is divided into 100 sec bins |
 |
 |
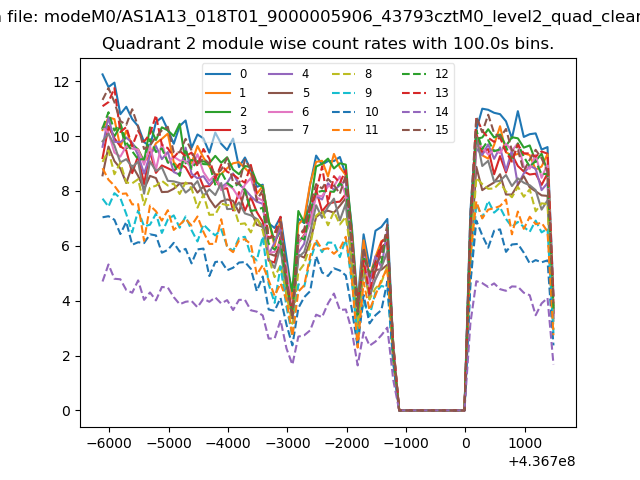
| Module-wise count rates for Quadrant B Data is divided into 100 sec bins |
 |
 |
| Module-wise count rates for Quadrant C Data is divided into 100 sec bins |
 |
 |
| Module-wise count rates for Quadrant D Data is divided into 100 sec bins |
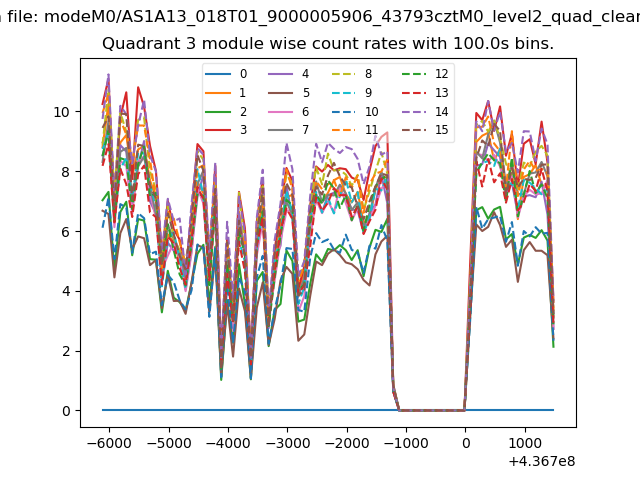 |
 |
| Parameter | Plot |
|---|---|
| CZT HV Monitor | 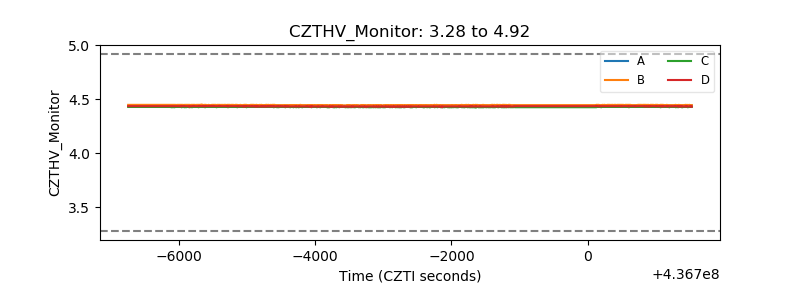 |
| D_VDD | 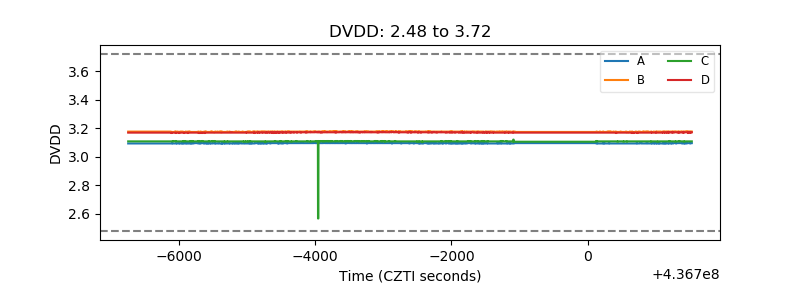 |
| Temperature 1 | 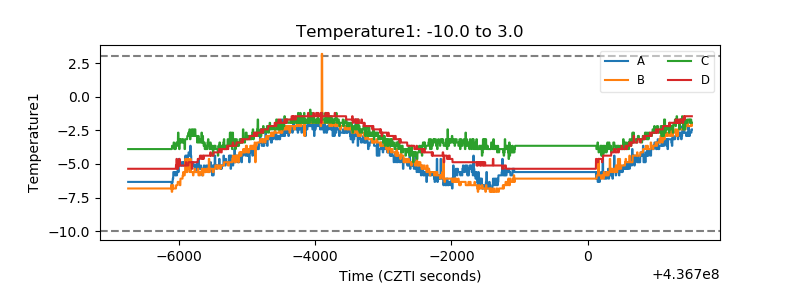 |
| Veto HV Monitor | 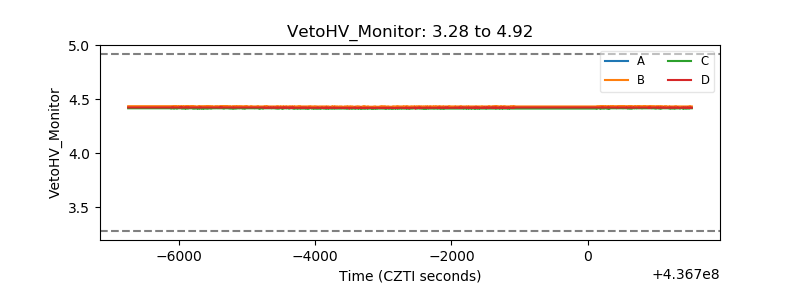 |
| Veto LLD |  |
| Alpha Counter | 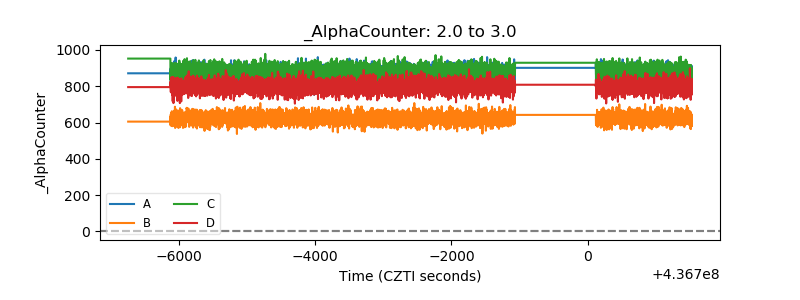 |
| _CPM_Rate | 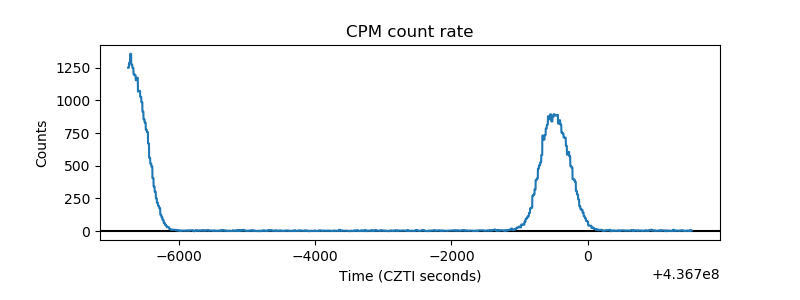 |
| CZT Counter | 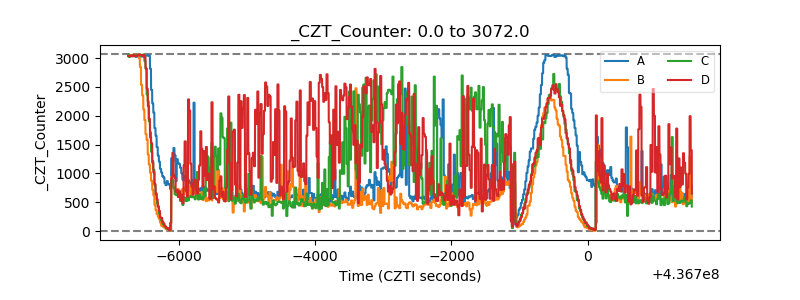 |
| +2.5 Volts monitor | 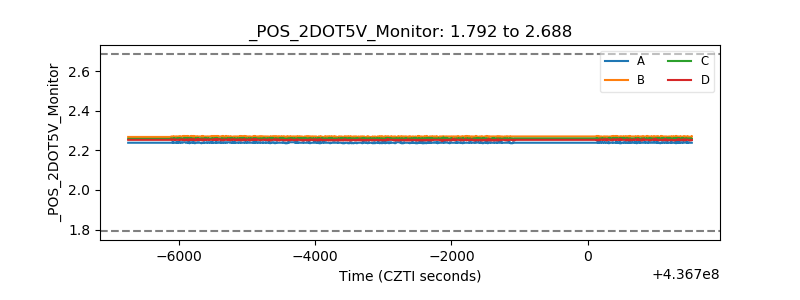 |
| +5 Volts monitor | 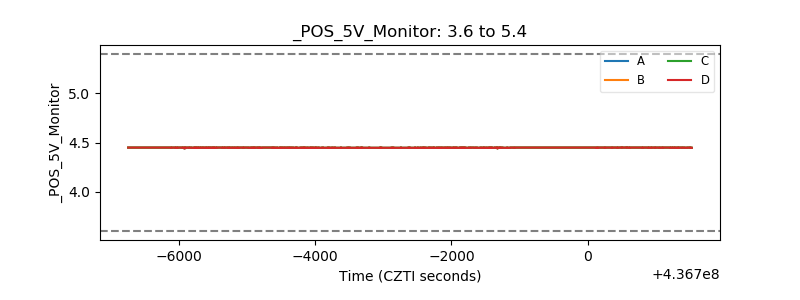 |
| _ROLL_ROT | 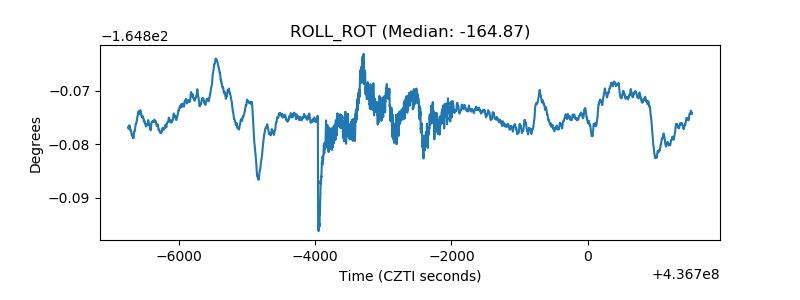 |
| _Roll_DEC | 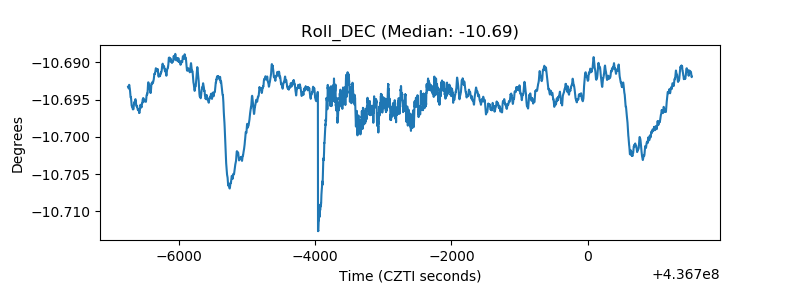 |
| _Roll_RA | 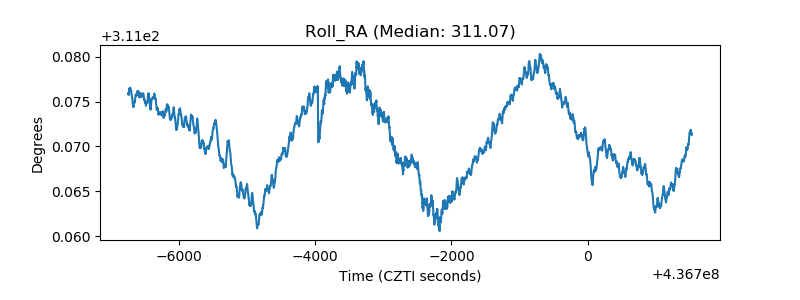 |
| Veto Counter | 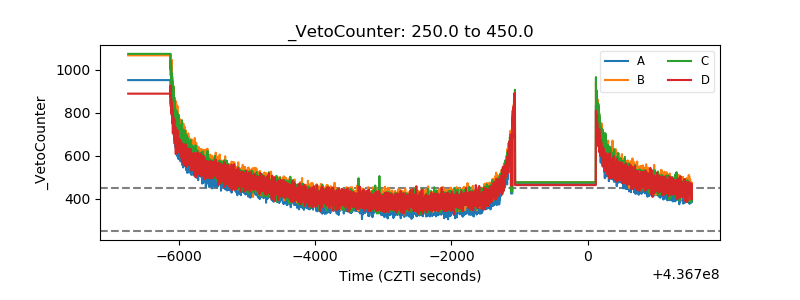 |