| Param | Original file | Final file |
|---|---|---|
| Filename | modeM0/AS1A13_018T01_9000005906_43794cztM0_level2.fits | modeM0/AS1A13_018T01_9000005906_43794cztM0_level2_quad_clean.evt |
| Size (bytes) | 564,698,880 | 116,959,680 |
| Size | 538.5 MB | 111.5 MB |
| Events in quadrant A | 4,837,580 | 784,844 |
| Events in quadrant B | 3,760,908 | 831,608 |
| Events in quadrant C | 5,873,759 | 764,014 |
| Events in quadrant D | 5,919,631 | 701,074 |
| Mode M0 | |||
|---|---|---|---|
| Quadrant | BADHDUFLAG | Total packets | Discarded packets |
| A | 0 | 19026 | 2 |
| B | 0 | 15428 | 2 |
| C | 0 | 21713 | 3 |
| D | 0 | 22180 | 2 |
| Mode SS | |||
|---|---|---|---|
| Quadrant | BADHDUFLAG | Total packets | Discarded packets |
| A | 0 | 134 | 0 |
| B | 0 | 134 | 0 |
| C | 0 | 134 | 0 |
| D | 0 | 134 | 0 |
| Mode M9 | |||
|---|---|---|---|
| Quadrant | BADHDUFLAG | Total packets | Discarded packets |
| A | 0 | 15 | 0 |
| B | 0 | 16 | 0 |
| C | 0 | 16 | 0 |
| D | 0 | 16 | 0 |
| Quadrant | Total seconds | Saturated seconds | Saturation percentage |
|---|---|---|---|
| A | 6600 | 403 | 6.106061% |
| B | 6600 | 225 | 3.409091% |
| C | 6599 | 569 | 8.622519% |
| D | 6599 | 539 | 8.167904% |
Noise dominated data is calculated using 1-second bins in cleaned event files. If a bin has >2000 counts, and if more than 50% of those come from <1% of pixels, then it is considered to be noise-dominated and hence unusable.
| Quadrant | # 1 sec bins | Bins with >0 counts | Bins with >2000 counts | High rate bins dominated by noise | Noise dominated (total time) | Noise dominated (detector-on time) | Marked lightcurve |
|---|---|---|---|---|---|---|---|
| A | 7700 | 6601 | 94 | 94 | 1.22% | 1.42% | 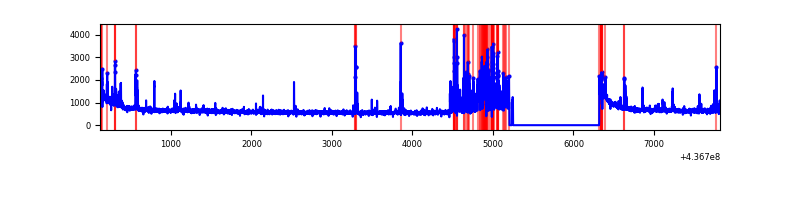 |
| B | 7700 | 6601 | 43 | 43 | 0.56% | 0.65% | 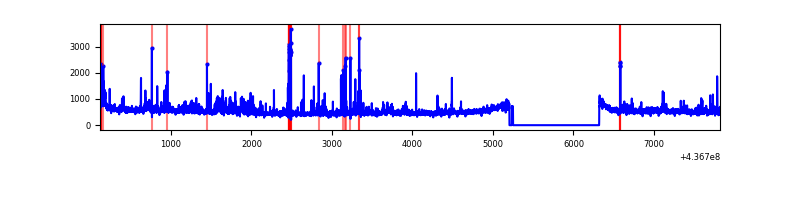 |
| C | 7699 | 6600 | 652 | 652 | 8.47% | 9.88% | 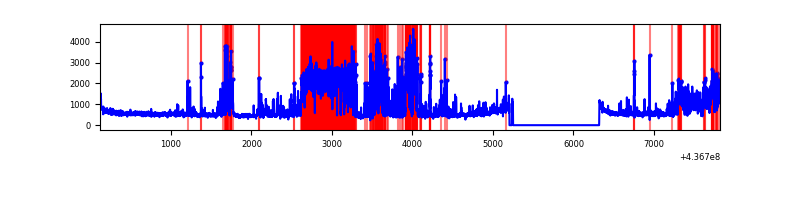 |
| D | 7699 | 6600 | 352 | 352 | 4.57% | 5.33% | 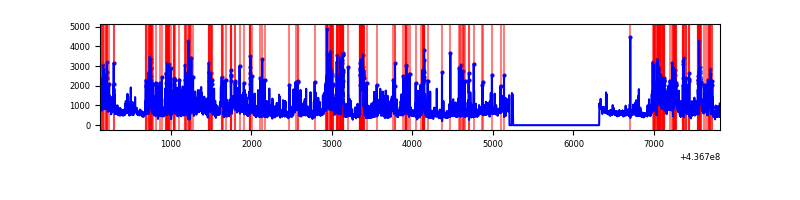 |
Top three noisy pixels from each quadrant. If the there are fewer than three noisy pixels in the level2.evt file, extra rows are filled as -1
| Pixel properties | Quadrant properties | ||||||
|---|---|---|---|---|---|---|---|
| Quadrant | DetID | PixID | Counts | Sigma | Mean | Median | Sigma |
| A | 10 | 83 | 1030489 | 6143.0 | 814 | 799 | 167.6 |
| A | 13 | 248 | 368729 | 2195.02 | 814 | 799 | 167.6 |
| A | 15 | 223 | 236969 | 1408.96 | 814 | 799 | 167.6 |
| B | 0 | 200 | 178139 | 1121.2 | 816 | 793 | 158.2 |
| B | 5 | 235 | 87948 | 551.0 | 816 | 793 | 158.2 |
| B | 5 | 172 | 79439 | 497.21 | 816 | 793 | 158.2 |
| C | 15 | 174 | 1626281 | 8924.29 | 786 | 794 | 182.1 |
| C | 15 | 157 | 692259 | 3796.3 | 786 | 794 | 182.1 |
| C | 15 | 158 | 171700 | 938.31 | 786 | 794 | 182.1 |
| D | 12 | 33 | 1365817 | 6786.0 | 796 | 770 | 201.2 |
| D | 1 | 52 | 328058 | 1627.03 | 796 | 770 | 201.2 |
| D | 5 | 235 | 270060 | 1338.71 | 796 | 770 | 201.2 |
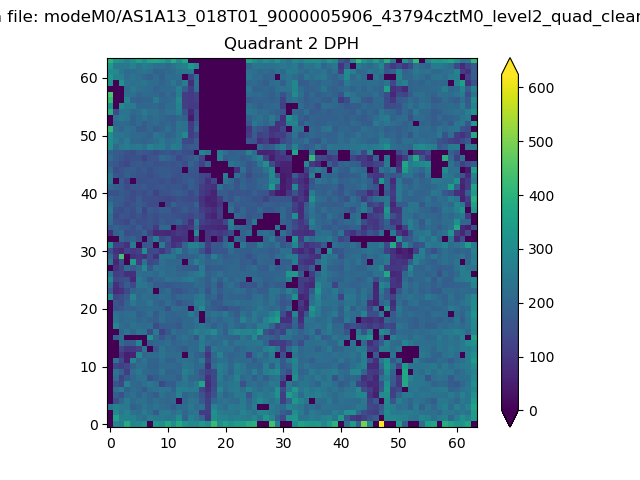
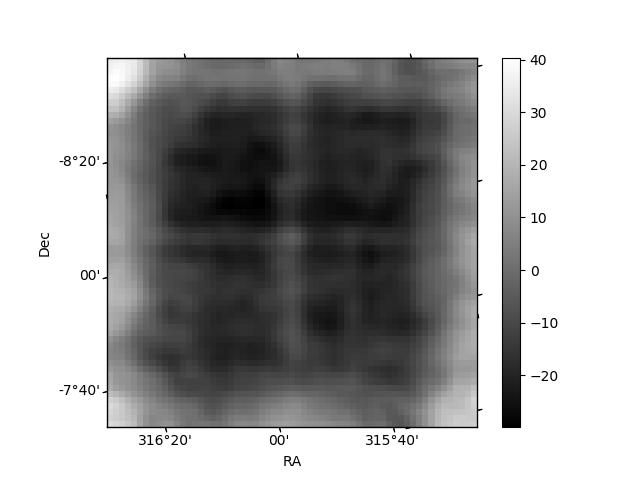
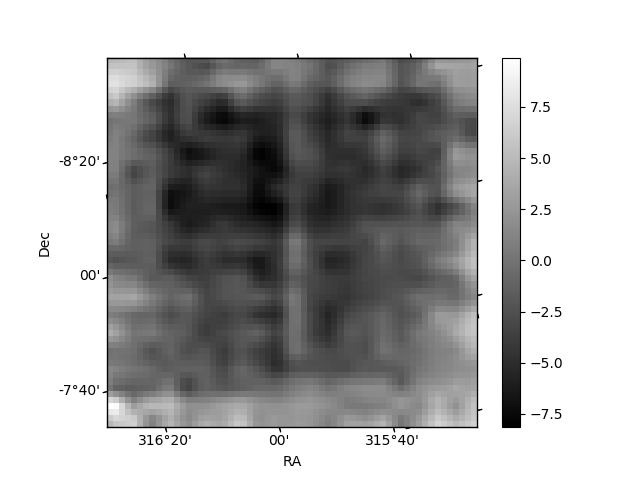
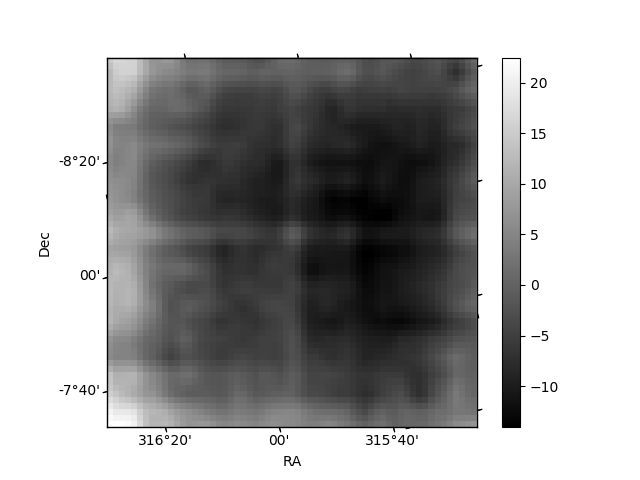
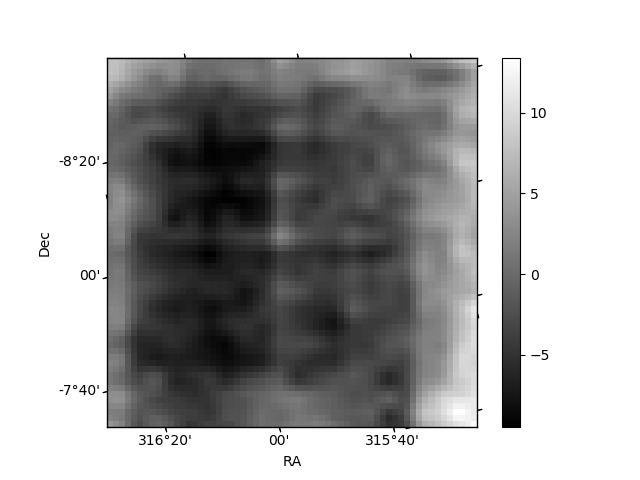
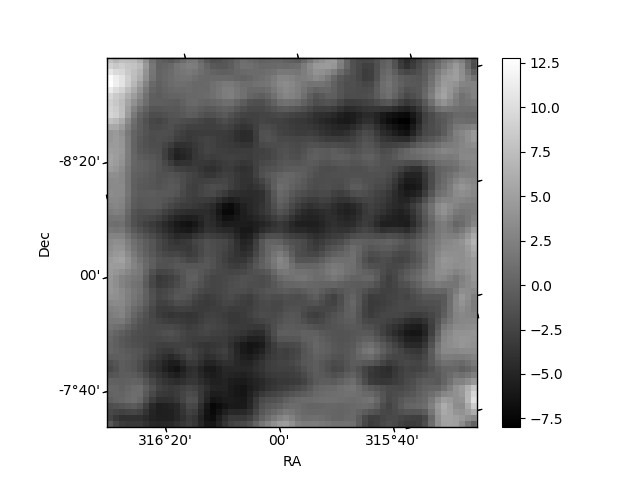
Histogram calculated using DETX and DETY for each event in the final _common_clean file
| Quadrant A | 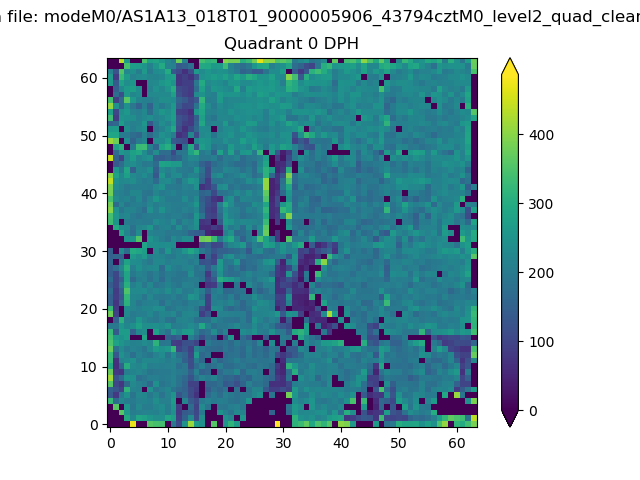 |
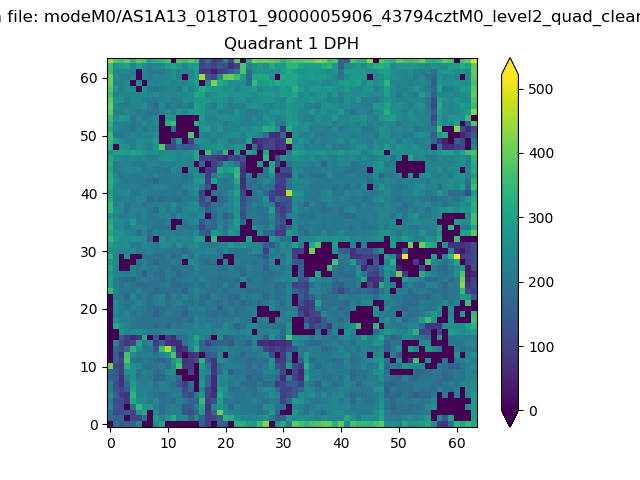 |
Quadrant B |
|---|---|---|---|
| Quadrant D | 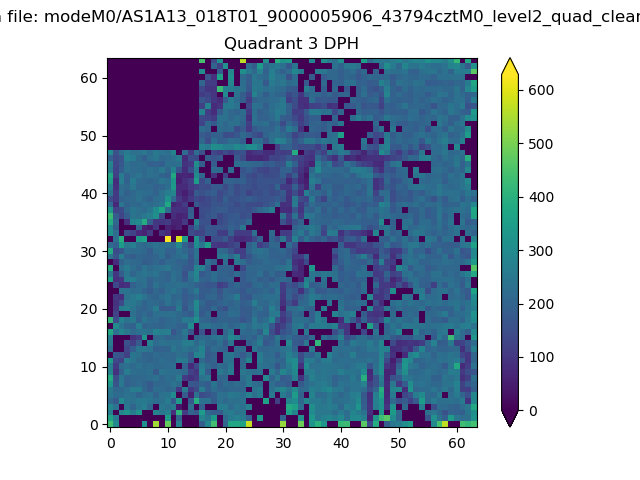 |
 |
Quadrant C |
| Plot type | Count rate plots | Images |
|---|---|---|
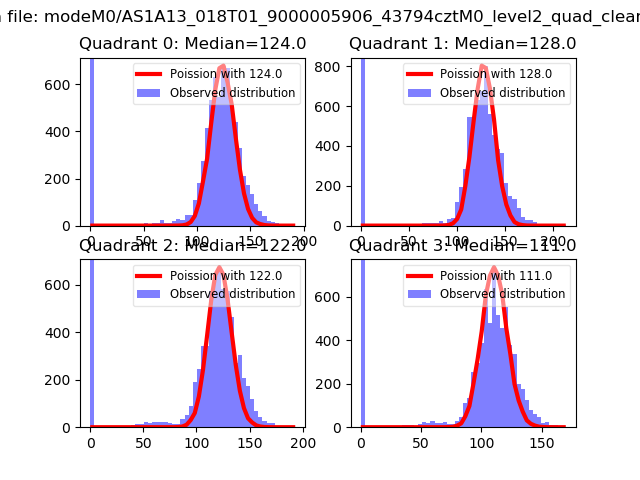
| Comparison with Poisson distribution Blue bars denote a histogram of data divided into 1 sec bins. Red curve is a Poisson curve with rate = median count rate of data. |
 |
 |
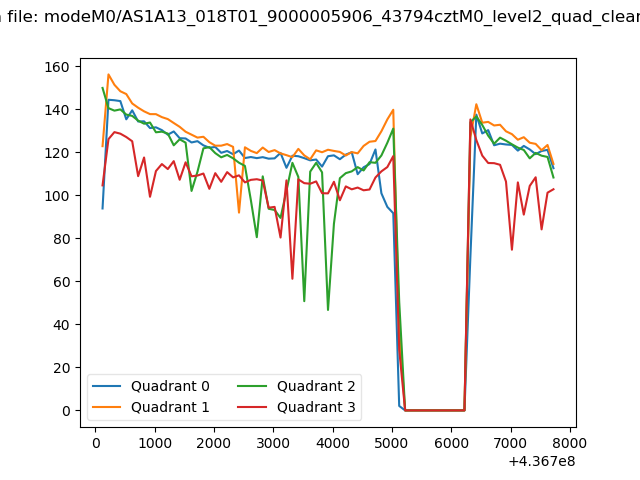
| Quadrant-wise count rates Data is divided into 100 sec bins |
 |
|
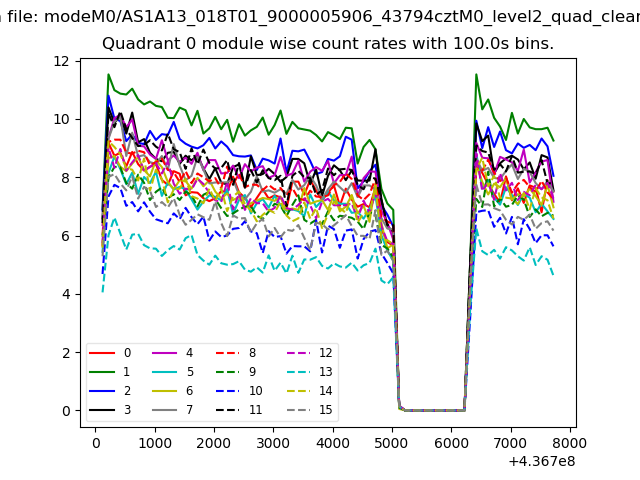
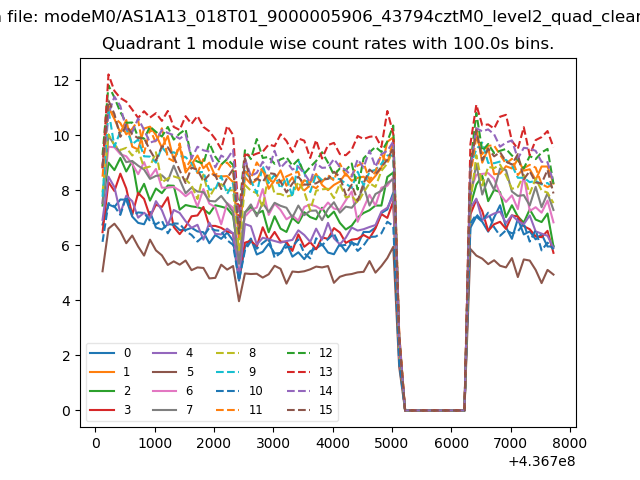
| Module-wise count rates for Quadrant A Data is divided into 100 sec bins |
 |
 |
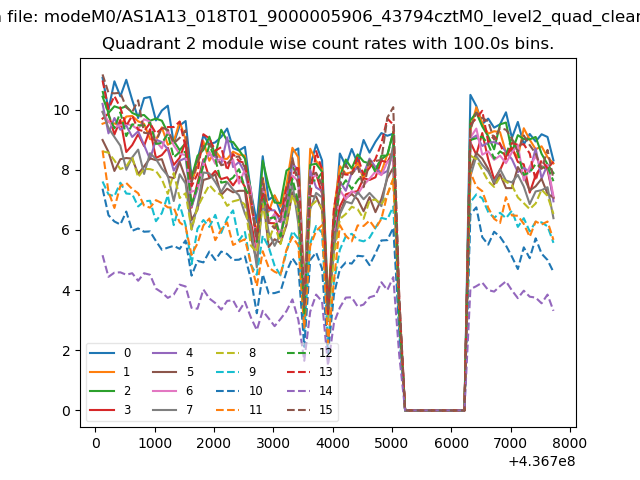
| Module-wise count rates for Quadrant B Data is divided into 100 sec bins |
 |
 |
| Module-wise count rates for Quadrant C Data is divided into 100 sec bins |
 |
 |
| Module-wise count rates for Quadrant D Data is divided into 100 sec bins |
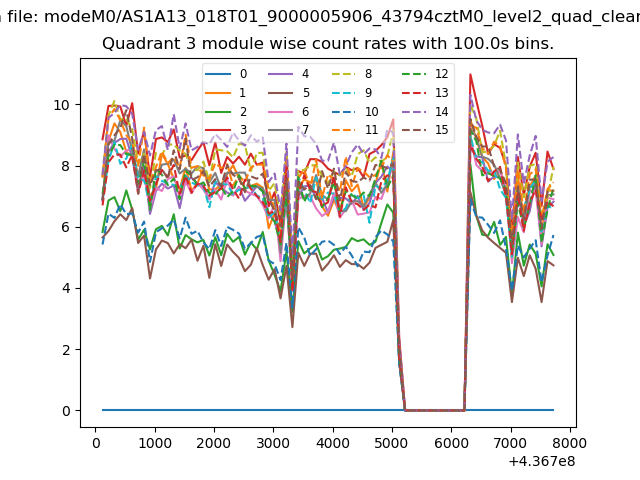 |
 |
| Parameter | Plot |
|---|---|
| CZT HV Monitor | 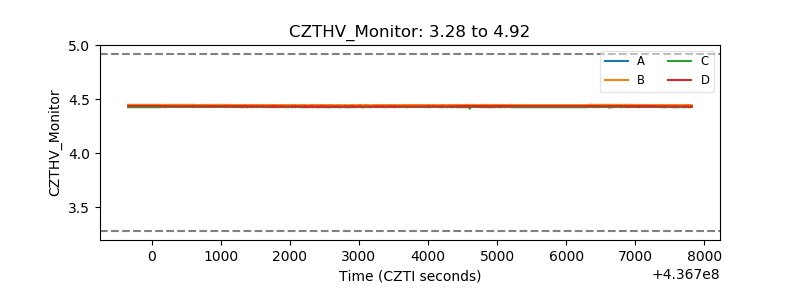 |
| D_VDD | 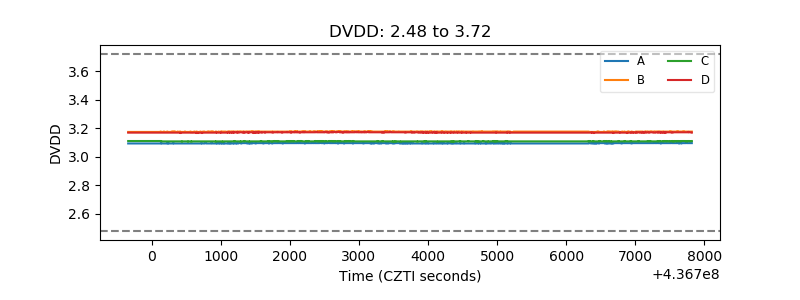 |
| Temperature 1 | 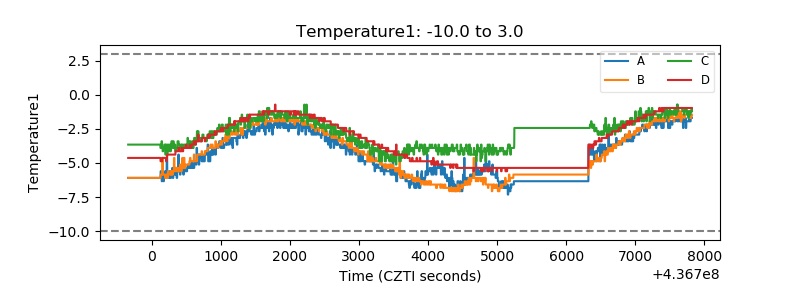 |
| Veto HV Monitor | 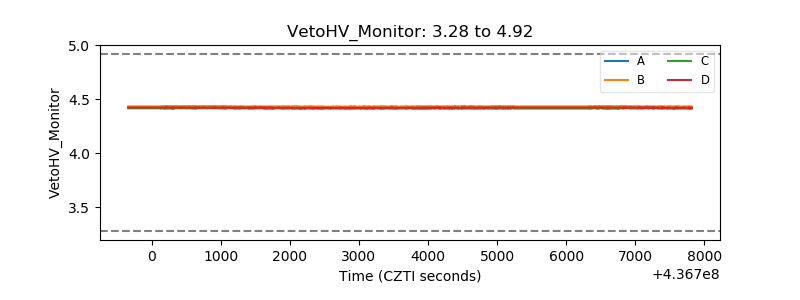 |
| Veto LLD | 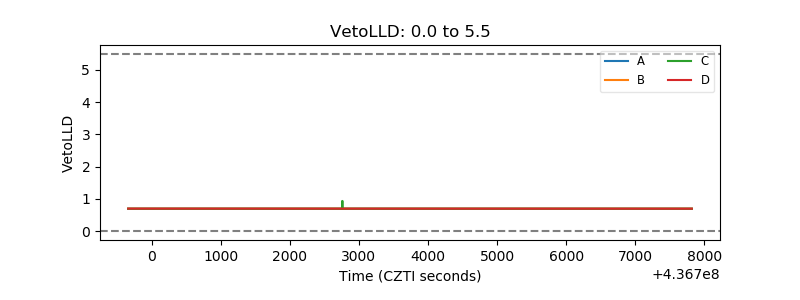 |
| Alpha Counter | 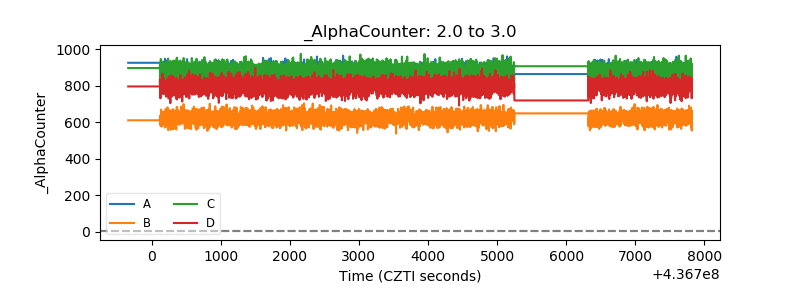 |
| _CPM_Rate | 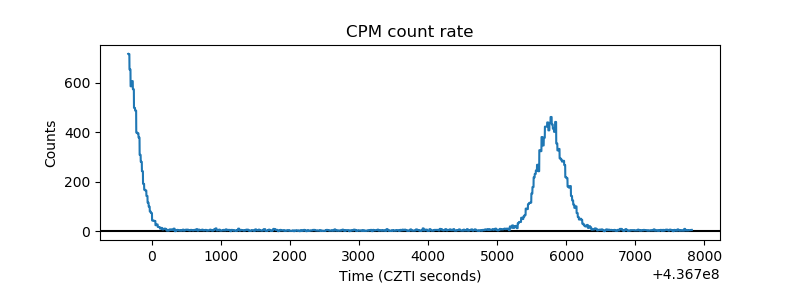 |
| CZT Counter | 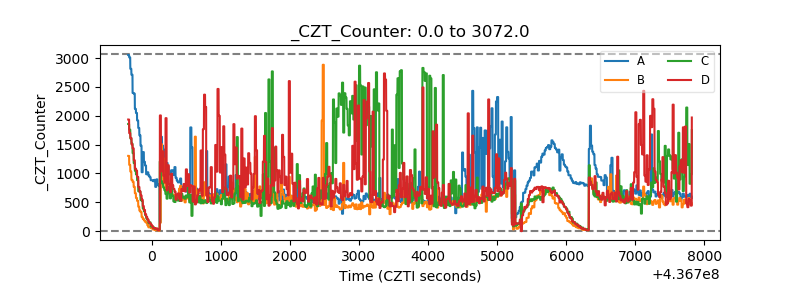 |
| +2.5 Volts monitor |  |
| +5 Volts monitor | 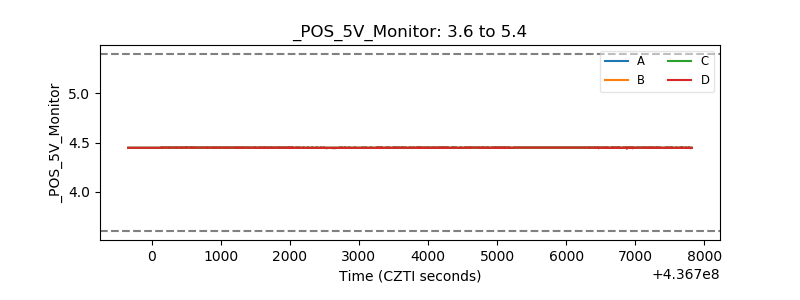 |
| _ROLL_ROT | 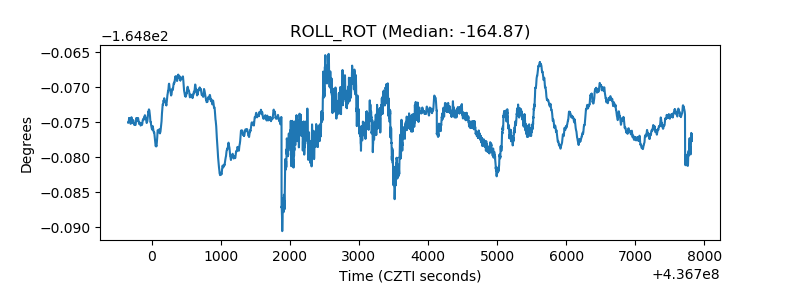 |
| _Roll_DEC | 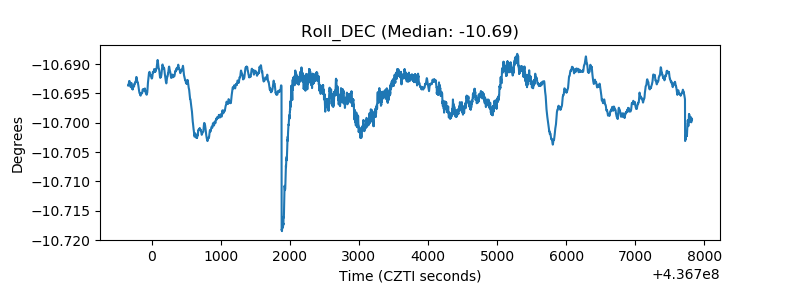 |
| _Roll_RA | 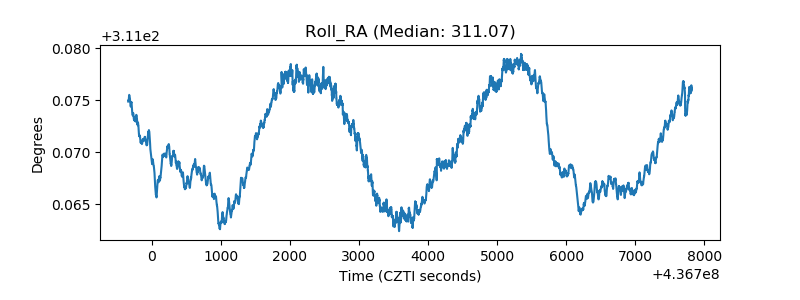 |
| Veto Counter | 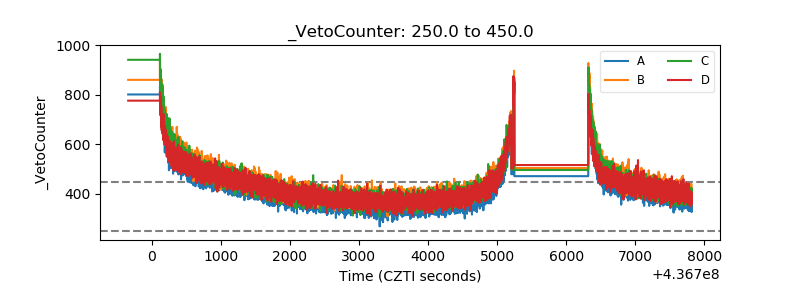 |