| Param | Original file | Final file |
|---|---|---|
| Filename | modeM0/AS1A13_018T01_9000005906_43796cztM0_level2.fits | modeM0/AS1A13_018T01_9000005906_43796cztM0_level2_quad_clean.evt |
| Size (bytes) | 626,955,840 | 117,961,920 |
| Size | 597.9 MB | 112.5 MB |
| Events in quadrant A | 5,116,507 | 810,565 |
| Events in quadrant B | 4,368,267 | 838,586 |
| Events in quadrant C | 4,457,233 | 817,162 |
| Events in quadrant D | 8,687,960 | 587,206 |
| Mode M0 | |||
|---|---|---|---|
| Quadrant | BADHDUFLAG | Total packets | Discarded packets |
| A | 0 | 20522 | 1 |
| B | 0 | 17861 | 1 |
| C | 0 | 18123 | 1 |
| D | 0 | 30951 | 1 |
| Mode SS | |||
|---|---|---|---|
| Quadrant | BADHDUFLAG | Total packets | Discarded packets |
| A | 0 | 150 | 0 |
| B | 0 | 150 | 0 |
| C | 0 | 150 | 0 |
| D | 0 | 150 | 0 |
| Mode M9 | |||
|---|---|---|---|
| Quadrant | BADHDUFLAG | Total packets | Discarded packets |
| A | 0 | 4 | 0 |
| B | 0 | 4 | 0 |
| C | 0 | 4 | 0 |
| D | 0 | 4 | 0 |
| Quadrant | Total seconds | Saturated seconds | Saturation percentage |
|---|---|---|---|
| A | 7447 | 305 | 4.095609% |
| B | 7448 | 282 | 3.786251% |
| C | 7448 | 237 | 3.182062% |
| D | 7448 | 1919 | 25.765306% |
Noise dominated data is calculated using 1-second bins in cleaned event files. If a bin has >2000 counts, and if more than 50% of those come from <1% of pixels, then it is considered to be noise-dominated and hence unusable.
| Quadrant | # 1 sec bins | Bins with >0 counts | Bins with >2000 counts | High rate bins dominated by noise | Noise dominated (total time) | Noise dominated (detector-on time) | Marked lightcurve |
|---|---|---|---|---|---|---|---|
| A | 7792 | 7448 | 67 | 67 | 0.86% | 0.90% | 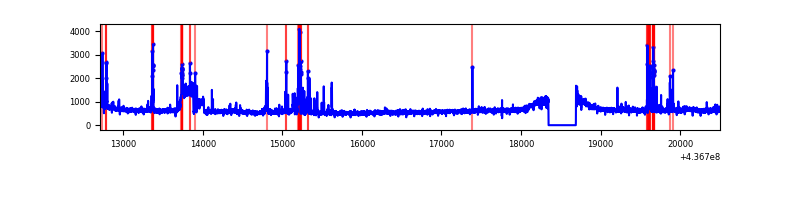 |
| B | 7793 | 7449 | 57 | 57 | 0.73% | 0.77% | 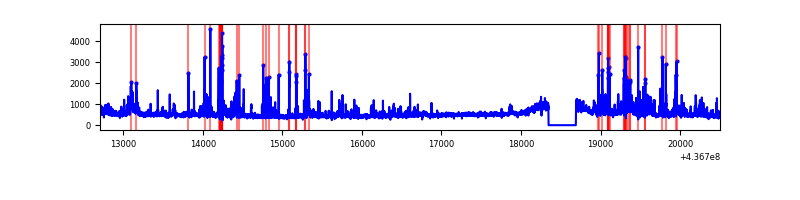 |
| C | 7793 | 7449 | 102 | 102 | 1.31% | 1.37% | 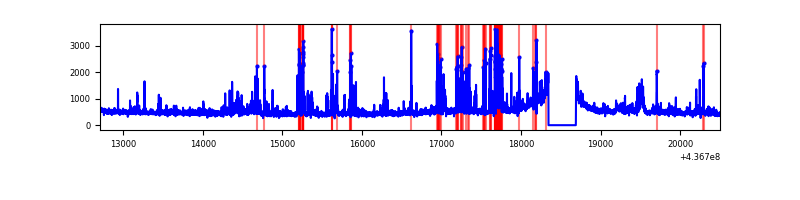 |
| D | 7793 | 7449 | 1699 | 1699 | 21.80% | 22.81% | 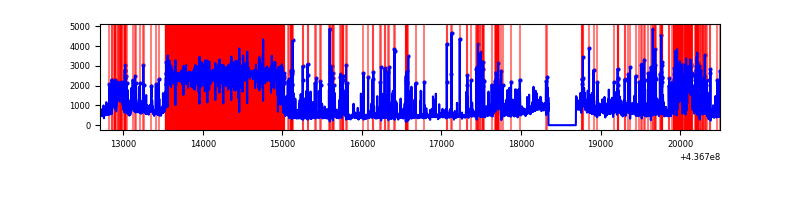 |
Top three noisy pixels from each quadrant. If the there are fewer than three noisy pixels in the level2.evt file, extra rows are filled as -1
| Pixel properties | Quadrant properties | ||||||
|---|---|---|---|---|---|---|---|
| Quadrant | DetID | PixID | Counts | Sigma | Mean | Median | Sigma |
| A | 10 | 83 | 1046384 | 5687.55 | 886 | 868 | 183.8 |
| A | 15 | 223 | 462331 | 2510.33 | 886 | 868 | 183.8 |
| A | 13 | 248 | 110880 | 598.46 | 886 | 868 | 183.8 |
| B | 0 | 200 | 235206 | 1341.38 | 879 | 852 | 174.7 |
| B | 5 | 235 | 216832 | 1236.22 | 879 | 852 | 174.7 |
| B | 4 | 171 | 81548 | 461.88 | 879 | 852 | 174.7 |
| C | 3 | 233 | 331370 | 1630.24 | 857 | 863 | 202.7 |
| C | 15 | 158 | 278987 | 1371.86 | 857 | 863 | 202.7 |
| C | 15 | 174 | 236209 | 1160.85 | 857 | 863 | 202.7 |
| D | 12 | 33 | 3521238 | 17503.97 | 771 | 746 | 201.1 |
| D | 5 | 235 | 613318 | 3045.72 | 771 | 746 | 201.1 |
| D | 1 | 52 | 456866 | 2267.84 | 771 | 746 | 201.1 |
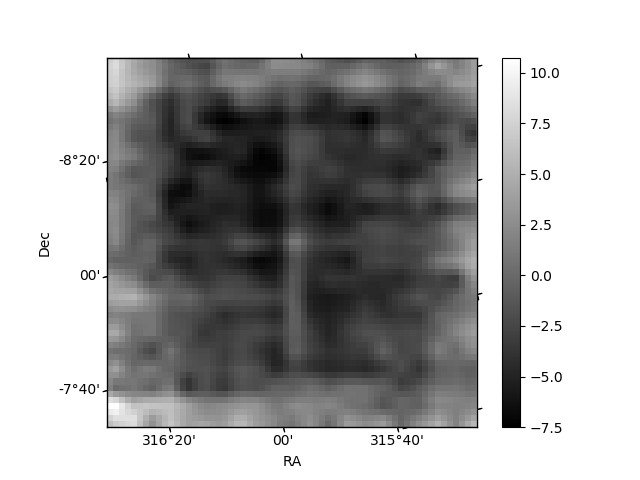
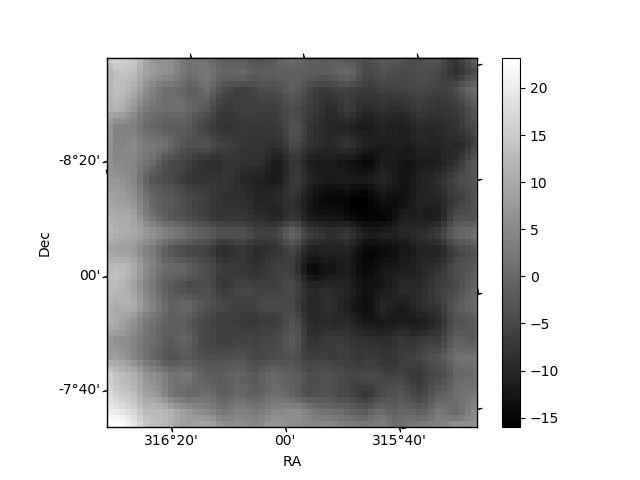
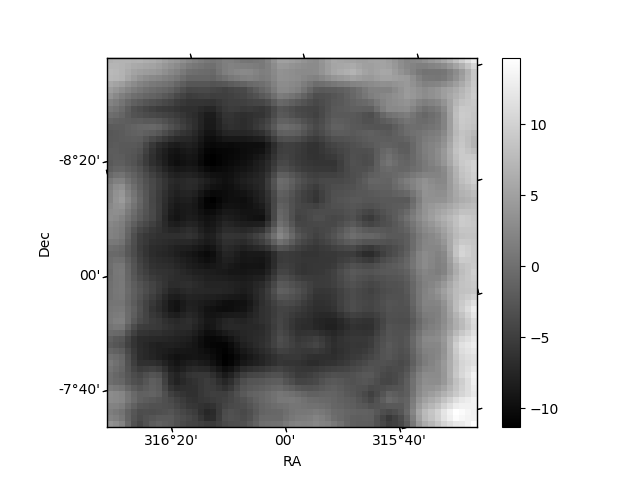
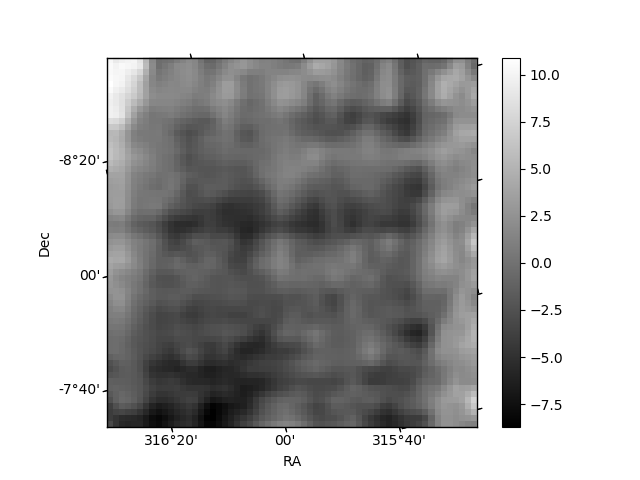
Histogram calculated using DETX and DETY for each event in the final _common_clean file
| Quadrant A |  |
 |
Quadrant B |
|---|---|---|---|
| Quadrant D | 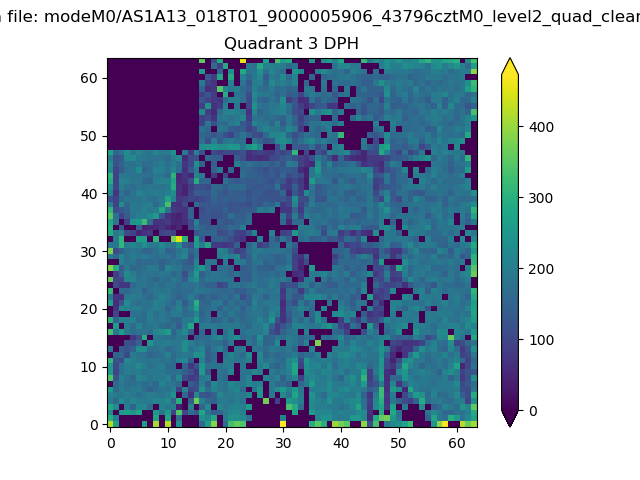 |
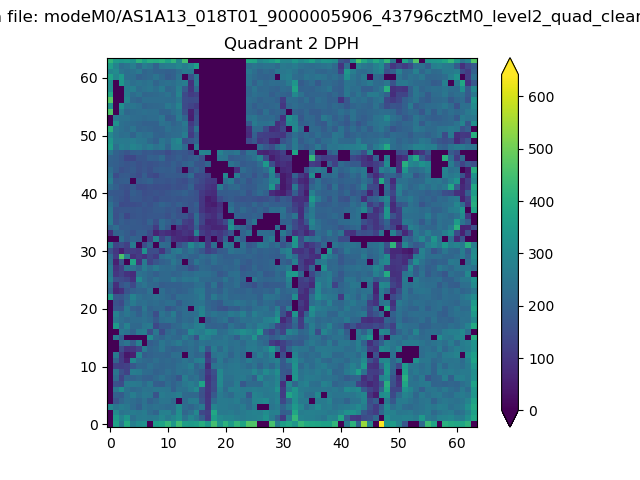 |
Quadrant C |
| Plot type | Count rate plots | Images |
|---|---|---|
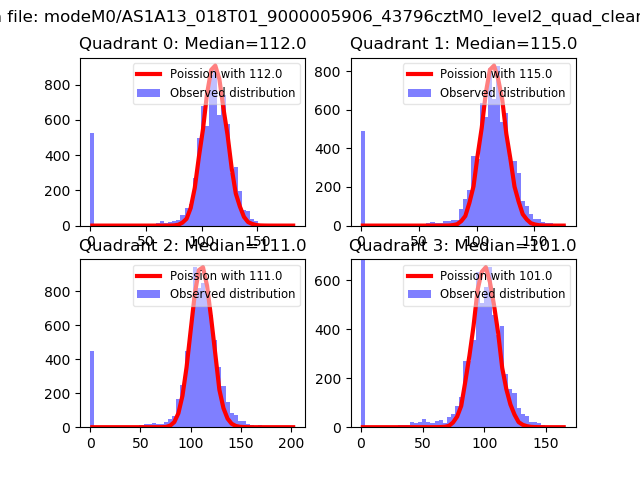
| Comparison with Poisson distribution Blue bars denote a histogram of data divided into 1 sec bins. Red curve is a Poisson curve with rate = median count rate of data. |
 |
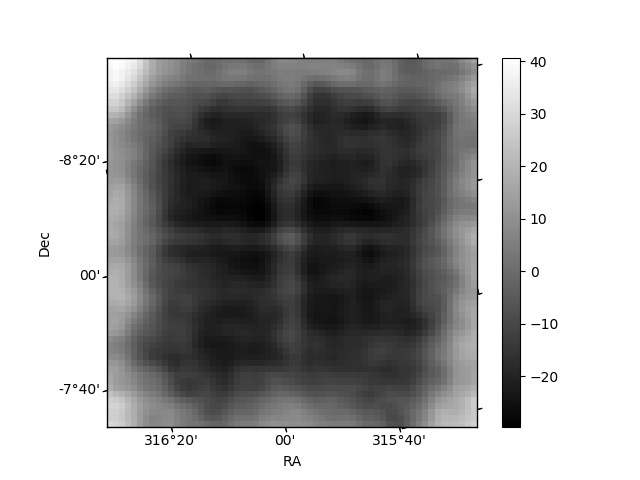 |
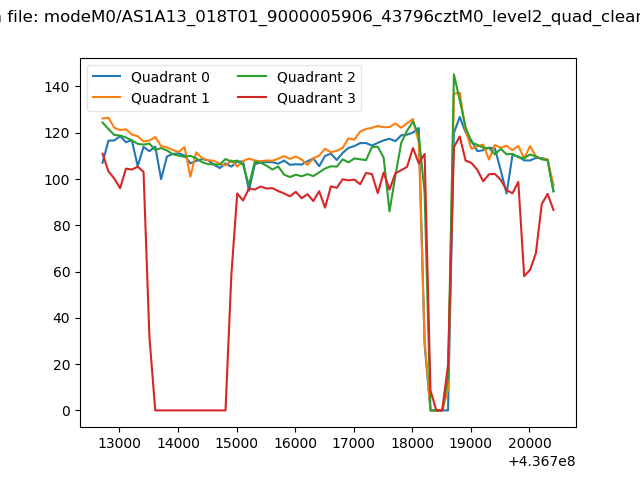
| Quadrant-wise count rates Data is divided into 100 sec bins |
 |
|
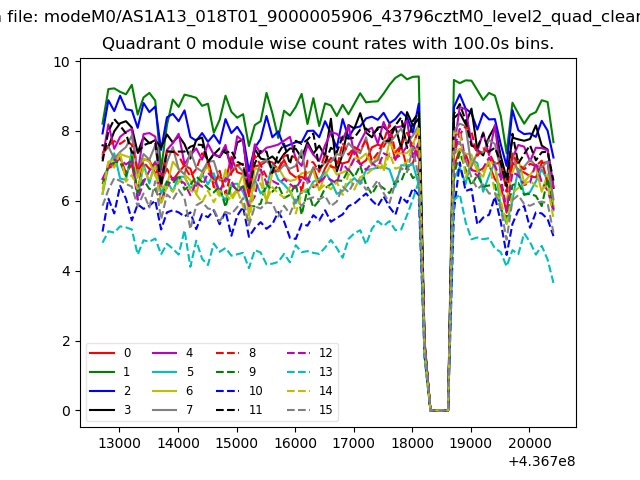
| Module-wise count rates for Quadrant A Data is divided into 100 sec bins |
 |
 |
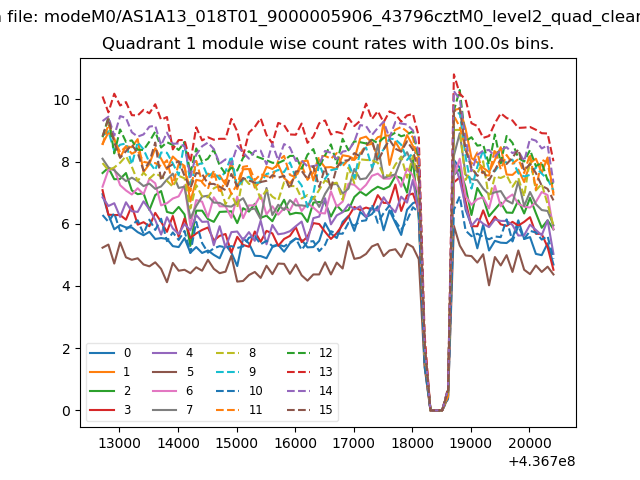
| Module-wise count rates for Quadrant B Data is divided into 100 sec bins |
 |
 |
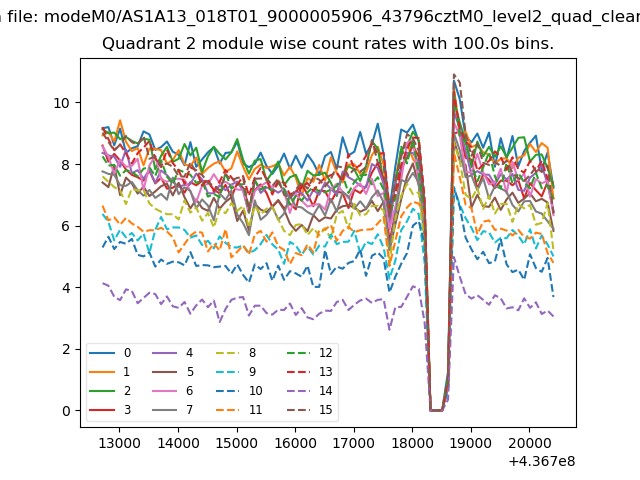
| Module-wise count rates for Quadrant C Data is divided into 100 sec bins |
 |
 |
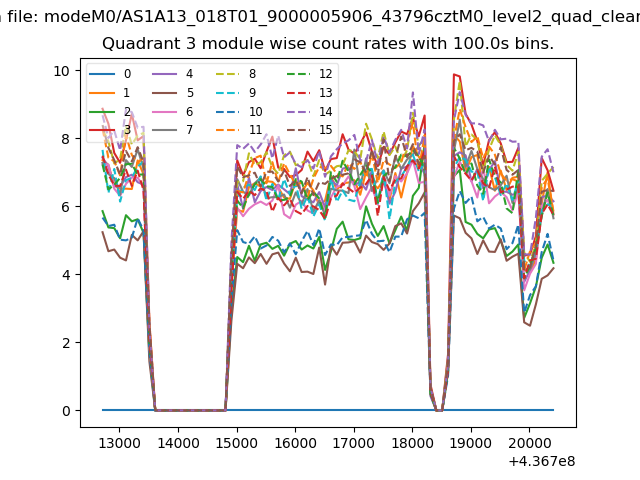
| Module-wise count rates for Quadrant D Data is divided into 100 sec bins |
 |
 |
| Parameter | Plot |
|---|---|
| CZT HV Monitor | 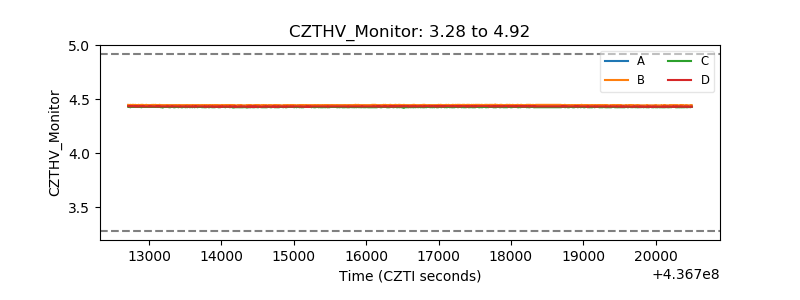 |
| D_VDD | 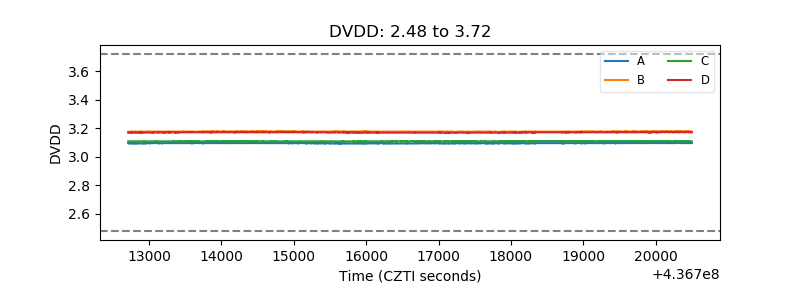 |
| Temperature 1 | 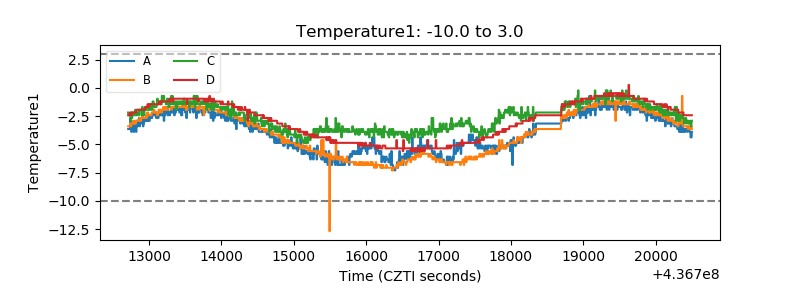 |
| Veto HV Monitor | 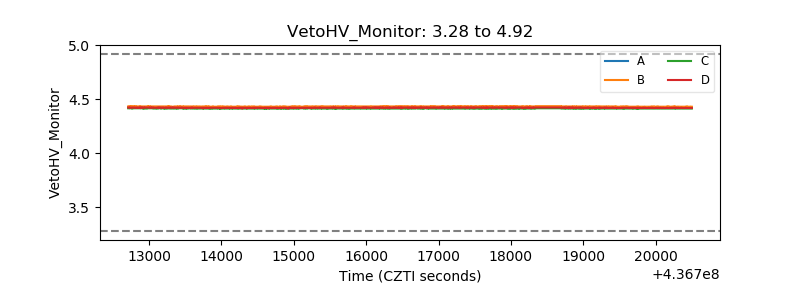 |
| Veto LLD | 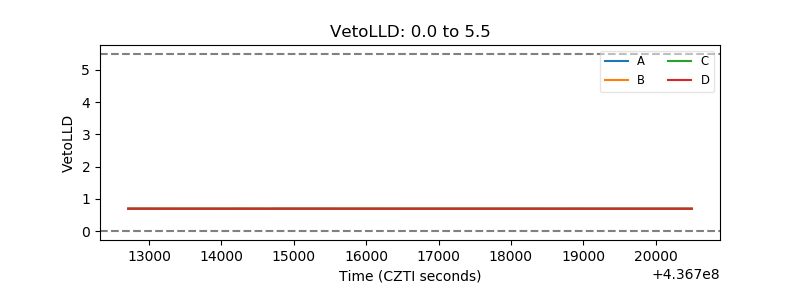 |
| Alpha Counter | 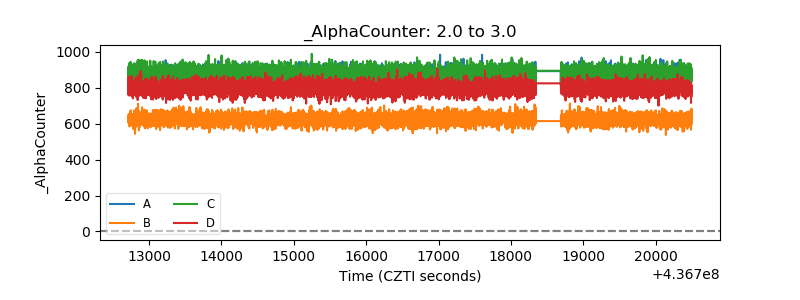 |
| _CPM_Rate | 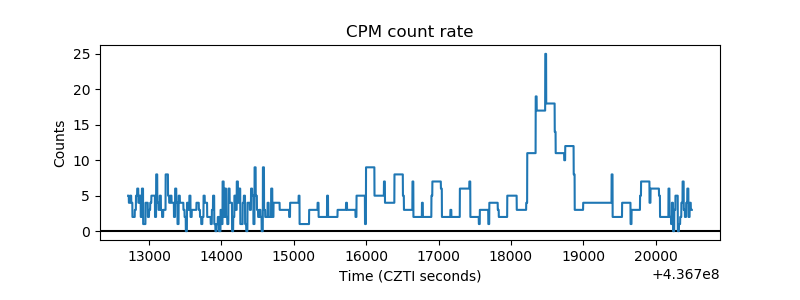 |
| CZT Counter | 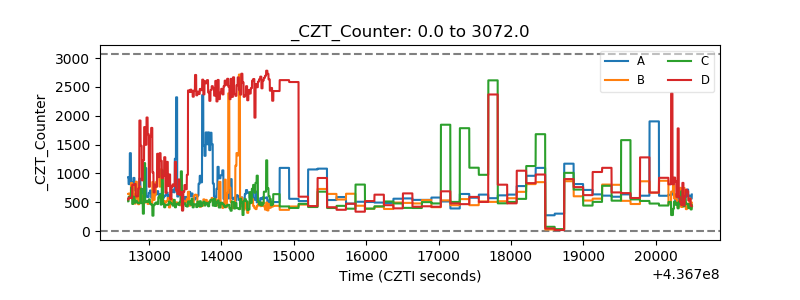 |
| +2.5 Volts monitor | 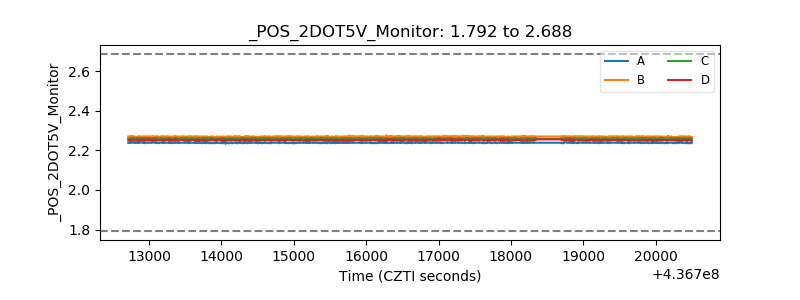 |
| +5 Volts monitor | 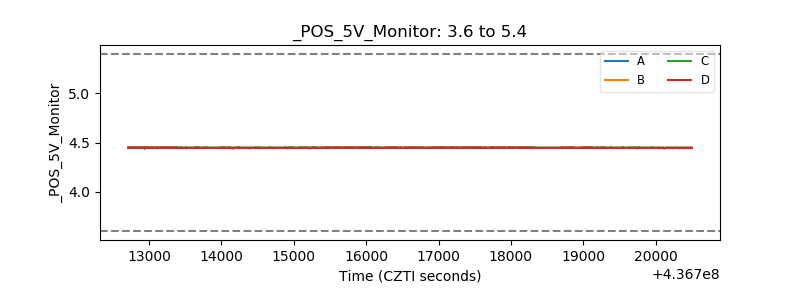 |
| _ROLL_ROT | 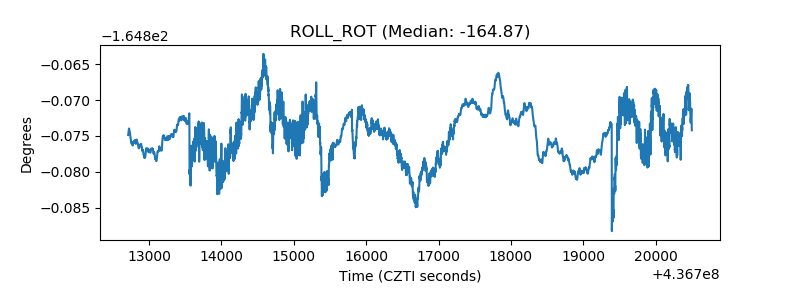 |
| _Roll_DEC | 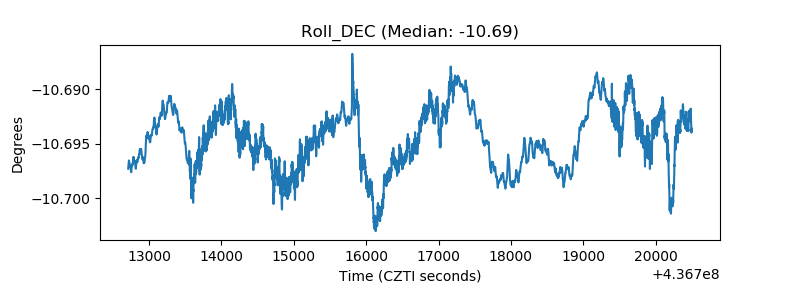 |
| _Roll_RA | 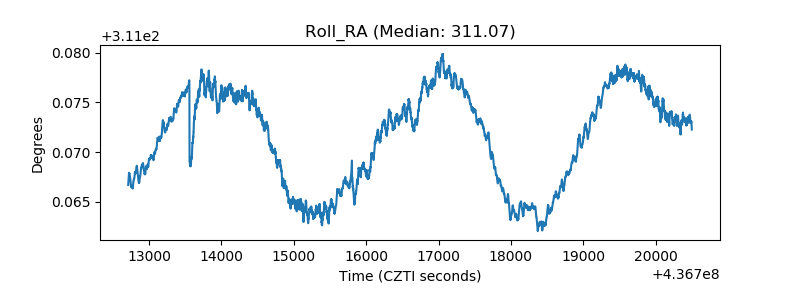 |
| Veto Counter | 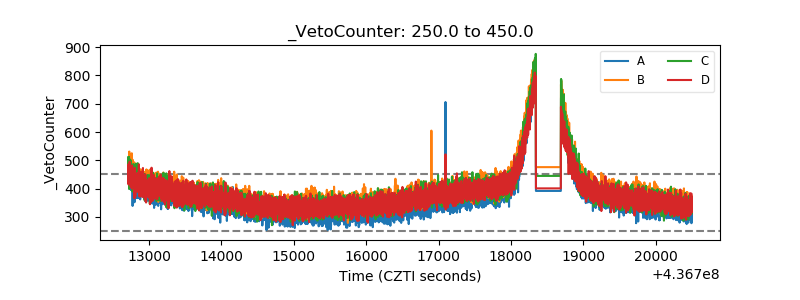 |