| Param | Original file | Final file |
|---|---|---|
| Filename | modeM0/AS1A13_018T01_9000005906_43797cztM0_level2.fits | modeM0/AS1A13_018T01_9000005906_43797cztM0_level2_quad_clean.evt |
| Size (bytes) | 703,416,960 | 117,817,920 |
| Size | 670.8 MB | 112.4 MB |
| Events in quadrant A | 4,841,276 | 838,746 |
| Events in quadrant B | 4,568,881 | 853,249 |
| Events in quadrant C | 8,123,061 | 667,892 |
| Events in quadrant D | 7,918,876 | 680,862 |
| Mode M0 | |||
|---|---|---|---|
| Quadrant | BADHDUFLAG | Total packets | Discarded packets |
| A | 0 | 19832 | 0 |
| B | 0 | 18687 | 0 |
| C | 0 | 29347 | 0 |
| D | 0 | 28773 | 1 |
| Mode SS | |||
|---|---|---|---|
| Quadrant | BADHDUFLAG | Total packets | Discarded packets |
| A | 0 | 150 | 0 |
| B | 0 | 150 | 0 |
| C | 0 | 150 | 0 |
| D | 0 | 150 | 0 |
| Quadrant | Total seconds | Saturated seconds | Saturation percentage |
|---|---|---|---|
| A | 7570 | 79 | 1.043593% |
| B | 7571 | 205 | 2.707700% |
| C | 7571 | 1616 | 21.344604% |
| D | 7570 | 997 | 13.170410% |
Noise dominated data is calculated using 1-second bins in cleaned event files. If a bin has >2000 counts, and if more than 50% of those come from <1% of pixels, then it is considered to be noise-dominated and hence unusable.
| Quadrant | # 1 sec bins | Bins with >0 counts | Bins with >2000 counts | High rate bins dominated by noise | Noise dominated (total time) | Noise dominated (detector-on time) | Marked lightcurve |
|---|---|---|---|---|---|---|---|
| A | 7570 | 7570 | 37 | 37 | 0.49% | 0.49% | 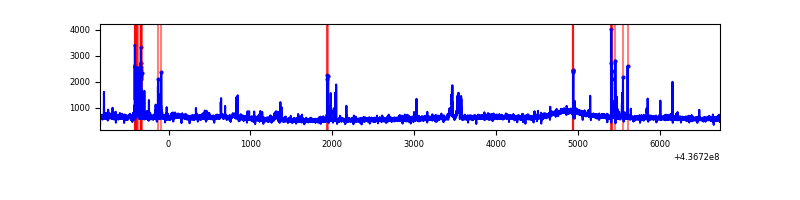 |
| B | 7571 | 7571 | 113 | 113 | 1.49% | 1.49% | 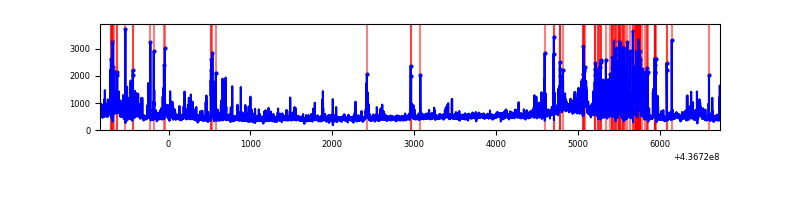 |
| C | 7571 | 7571 | 1480 | 1480 | 19.55% | 19.55% | 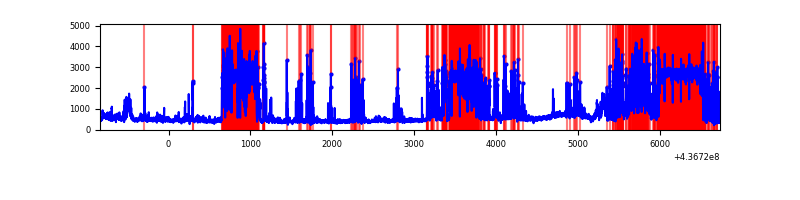 |
| D | 7570 | 7570 | 870 | 870 | 11.49% | 11.49% | 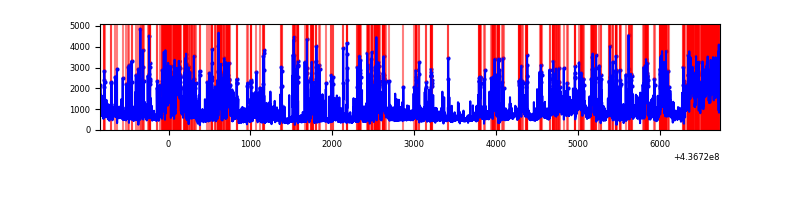 |
Top three noisy pixels from each quadrant. If the there are fewer than three noisy pixels in the level2.evt file, extra rows are filled as -1
| Pixel properties | Quadrant properties | ||||||
|---|---|---|---|---|---|---|---|
| Quadrant | DetID | PixID | Counts | Sigma | Mean | Median | Sigma |
| A | 10 | 83 | 1040393 | 5642.32 | 879 | 859 | 184.2 |
| A | 13 | 248 | 200842 | 1085.46 | 879 | 859 | 184.2 |
| A | 15 | 223 | 172907 | 933.83 | 879 | 859 | 184.2 |
| B | 5 | 235 | 298303 | 1730.37 | 870 | 845 | 171.9 |
| B | 0 | 200 | 160610 | 929.38 | 870 | 845 | 171.9 |
| B | 4 | 170 | 150567 | 870.96 | 870 | 845 | 171.9 |
| C | 15 | 174 | 2608520 | 14487.43 | 766 | 771 | 180.0 |
| C | 15 | 157 | 1145208 | 6357.95 | 766 | 771 | 180.0 |
| C | 15 | 158 | 635816 | 3528.01 | 766 | 771 | 180.0 |
| D | 12 | 33 | 1422978 | 6854.68 | 818 | 792 | 207.5 |
| D | 5 | 235 | 1081246 | 5207.59 | 818 | 792 | 207.5 |
| D | 1 | 52 | 776038 | 3736.55 | 818 | 792 | 207.5 |
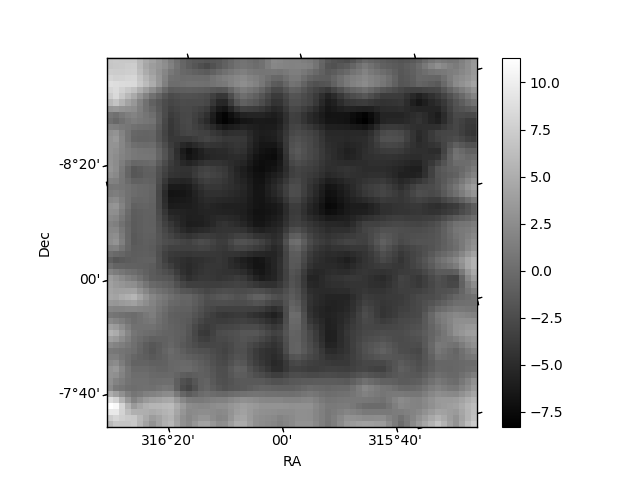
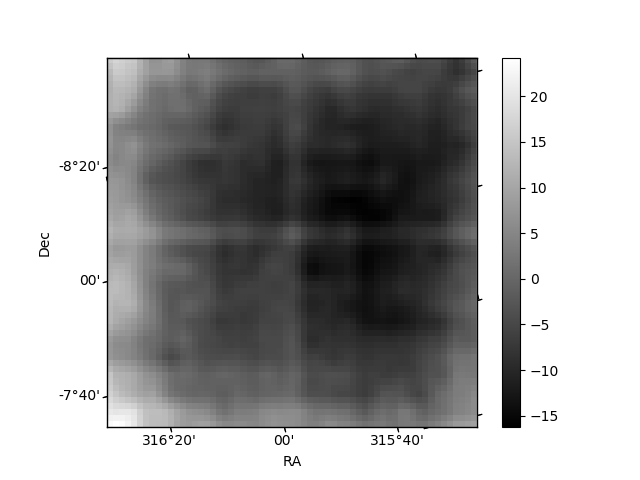
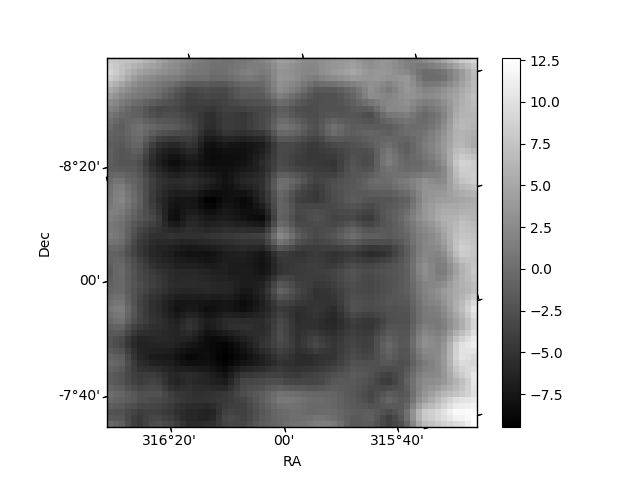
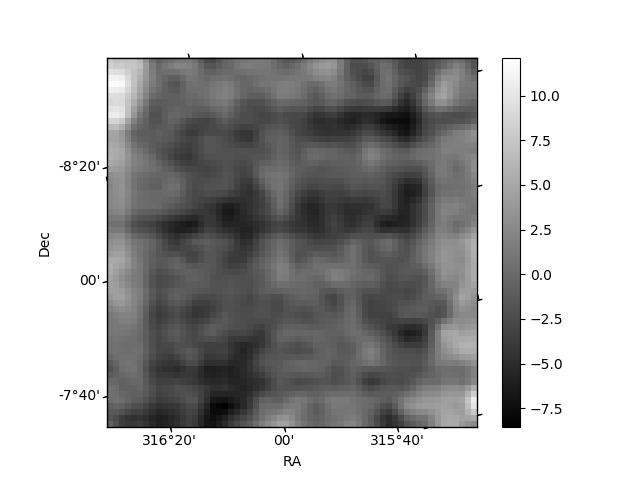
Histogram calculated using DETX and DETY for each event in the final _common_clean file
| Quadrant A | 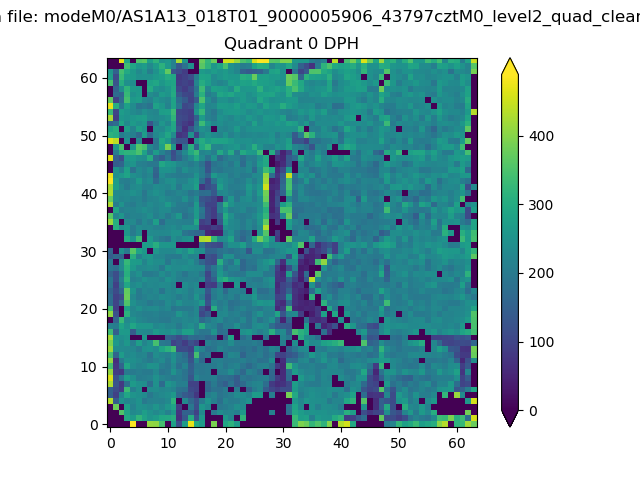 |
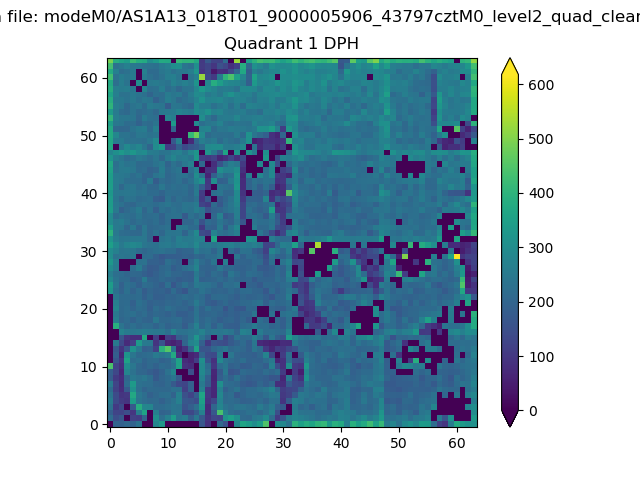 |
Quadrant B |
|---|---|---|---|
| Quadrant D | 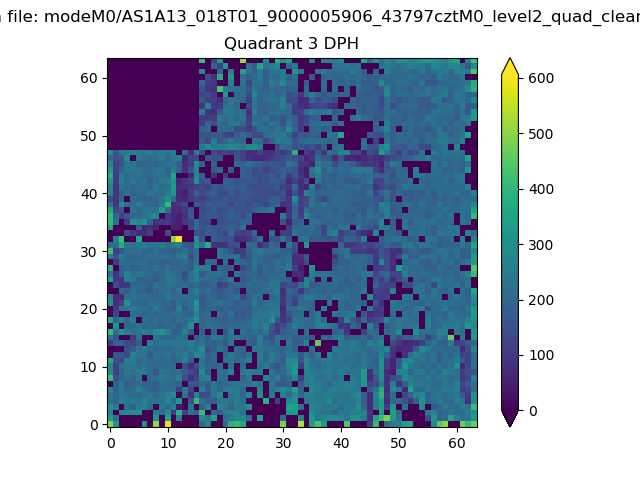 |
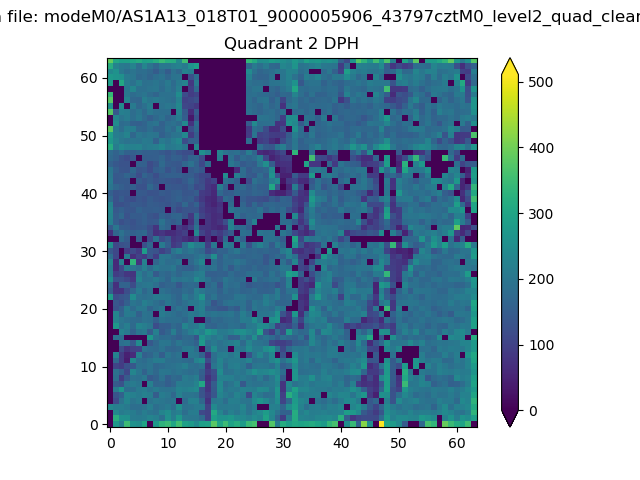 |
Quadrant C |
| Plot type | Count rate plots | Images |
|---|---|---|
| Comparison with Poisson distribution Blue bars denote a histogram of data divided into 1 sec bins. Red curve is a Poisson curve with rate = median count rate of data. |
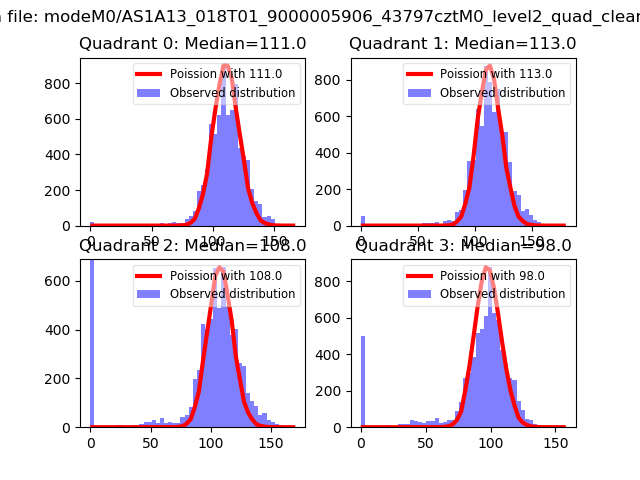 |
 |
| Quadrant-wise count rates Data is divided into 100 sec bins |
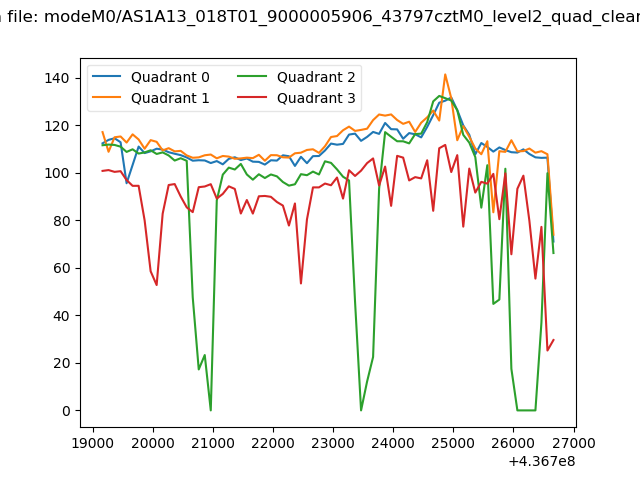 |
|
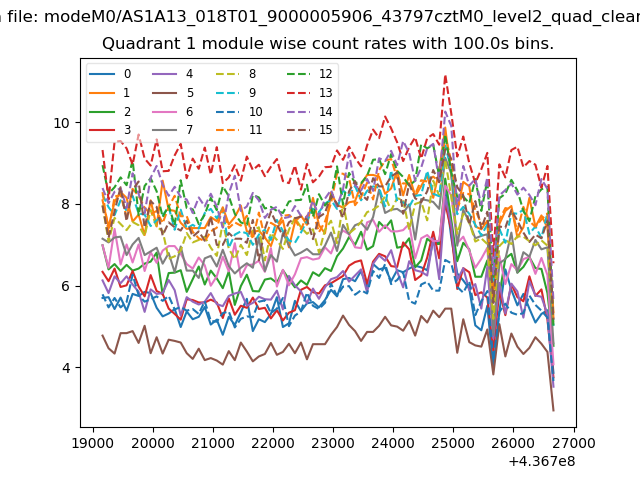
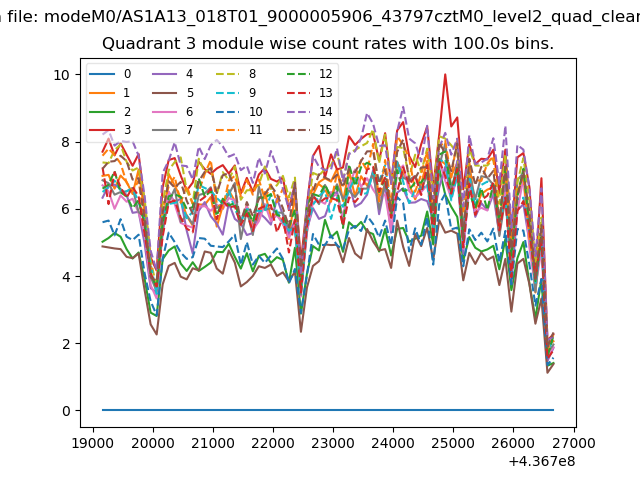
| Module-wise count rates for Quadrant A Data is divided into 100 sec bins |
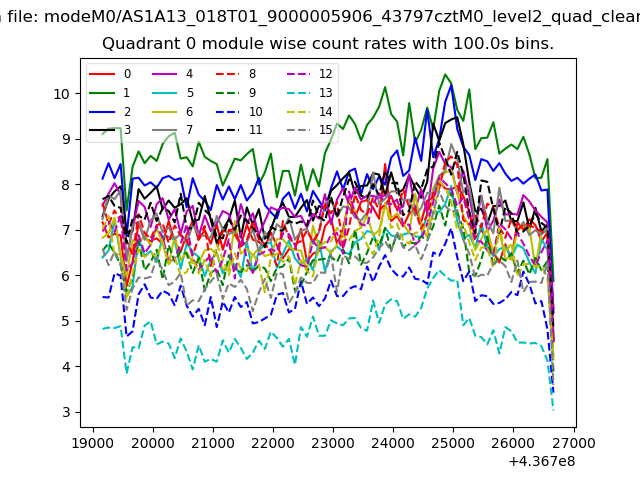 |
 |
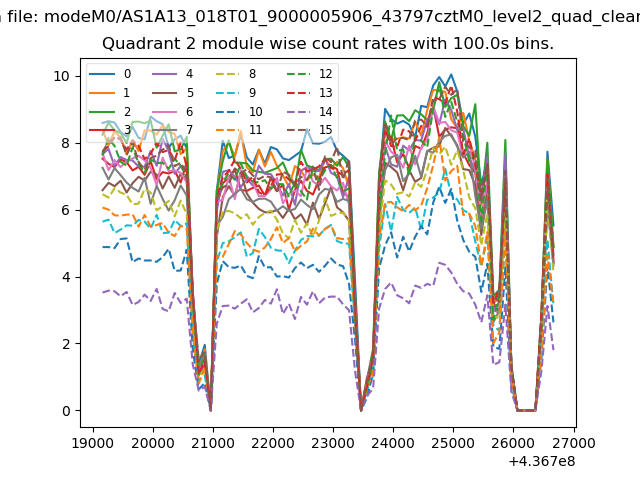
| Module-wise count rates for Quadrant B Data is divided into 100 sec bins |
 |
 |
| Module-wise count rates for Quadrant C Data is divided into 100 sec bins |
 |
 |
| Module-wise count rates for Quadrant D Data is divided into 100 sec bins |
 |
 |
| Parameter | Plot |
|---|---|
| CZT HV Monitor | 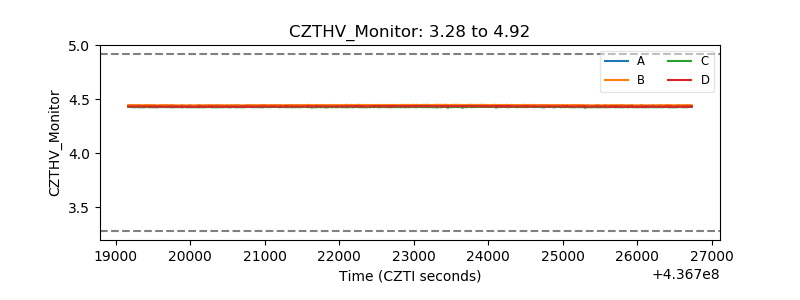 |
| D_VDD | 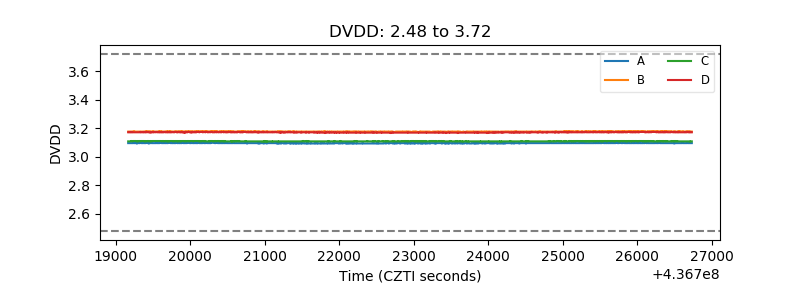 |
| Temperature 1 | 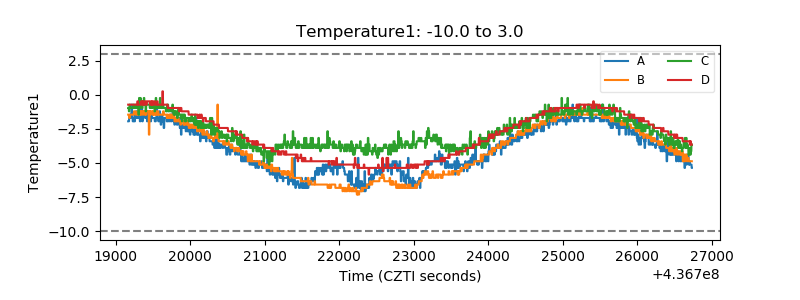 |
| Veto HV Monitor | 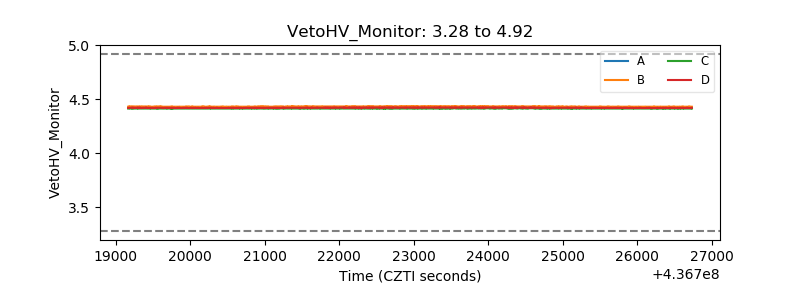 |
| Veto LLD | 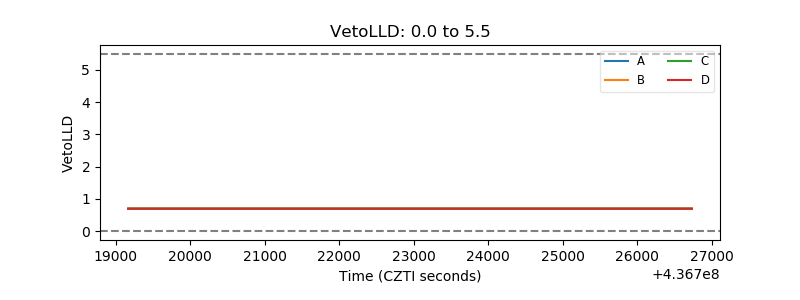 |
| Alpha Counter | 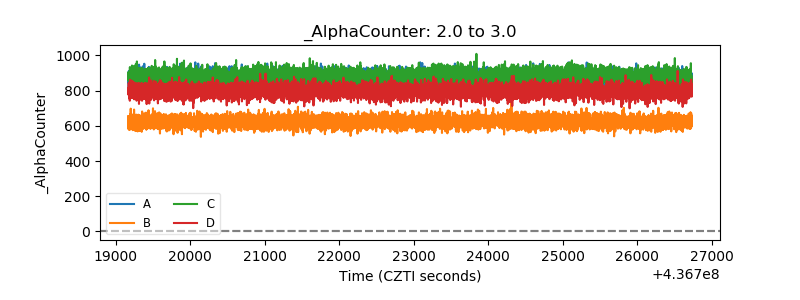 |
| _CPM_Rate | 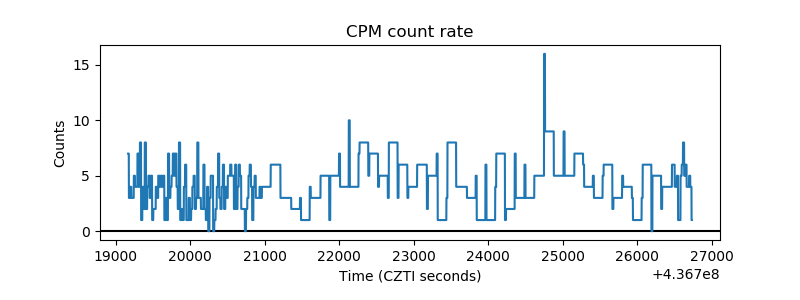 |
| CZT Counter | 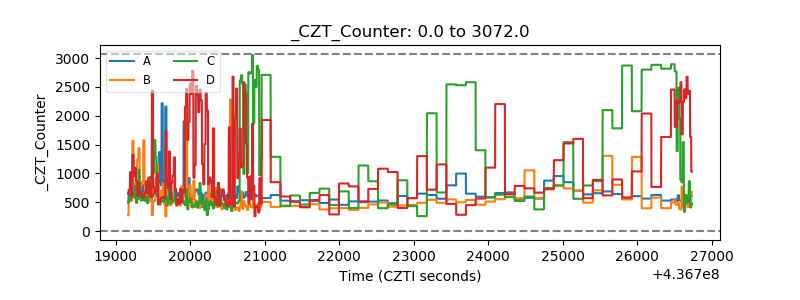 |
| +2.5 Volts monitor | 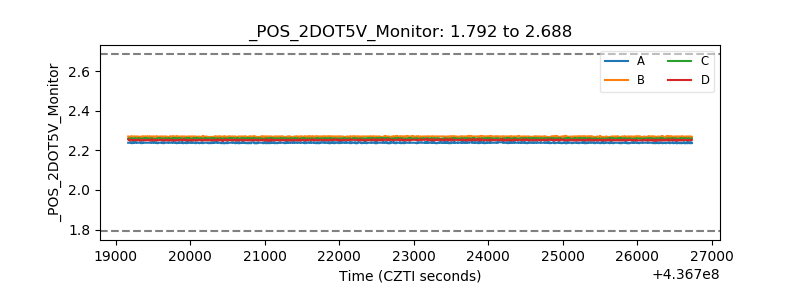 |
| +5 Volts monitor | 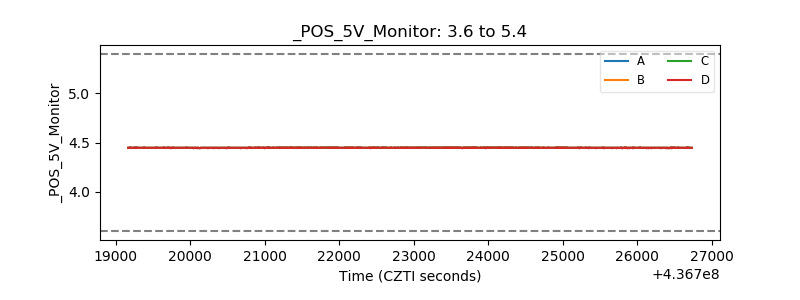 |
| _ROLL_ROT | 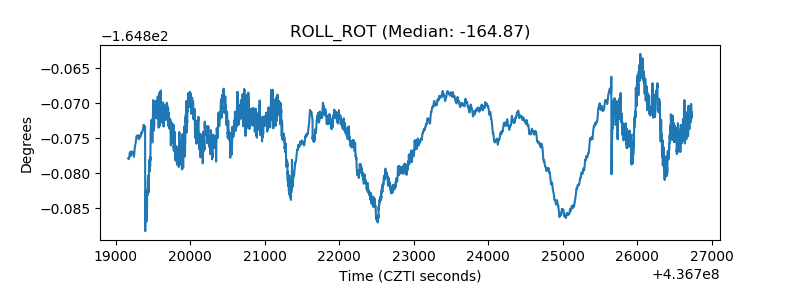 |
| _Roll_DEC | 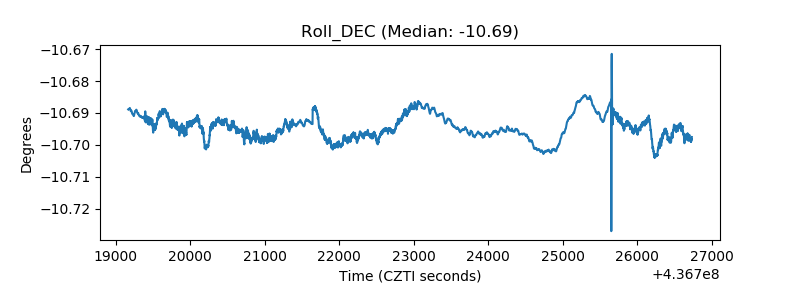 |
| _Roll_RA |  |
| Veto Counter | 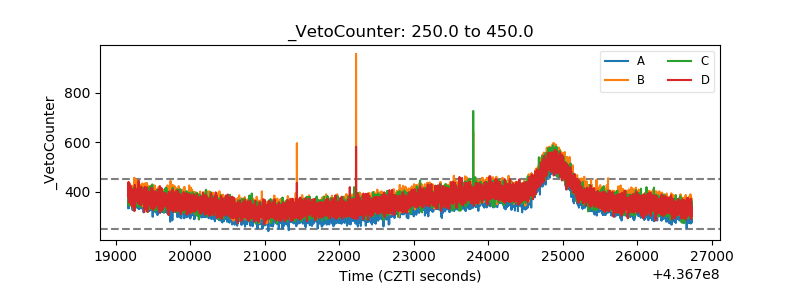 |