| Param | Original file | Final file |
|---|---|---|
| Filename | modeM0/AS1A13_018T01_9000005906_43798cztM0_level2.fits | modeM0/AS1A13_018T01_9000005906_43798cztM0_level2_quad_clean.evt |
| Size (bytes) | 728,795,520 | 113,520,960 |
| Size | 695.0 MB | 108.3 MB |
| Events in quadrant A | 4,685,472 | 812,822 |
| Events in quadrant B | 4,360,373 | 823,660 |
| Events in quadrant C | 8,772,050 | 662,896 |
| Events in quadrant D | 8,585,174 | 620,762 |
| Mode M0 | |||
|---|---|---|---|
| Quadrant | BADHDUFLAG | Total packets | Discarded packets |
| A | 0 | 18926 | 0 |
| B | 0 | 18015 | 0 |
| C | 0 | 31212 | 0 |
| D | 0 | 30661 | 0 |
| Mode SS | |||
|---|---|---|---|
| Quadrant | BADHDUFLAG | Total packets | Discarded packets |
| A | 0 | 148 | 0 |
| B | 0 | 148 | 0 |
| C | 0 | 148 | 0 |
| D | 0 | 148 | 0 |
| Quadrant | Total seconds | Saturated seconds | Saturation percentage |
|---|---|---|---|
| A | 7428 | 78 | 1.050081% |
| B | 7428 | 235 | 3.163705% |
| C | 7428 | 1524 | 20.516963% |
| D | 7428 | 1346 | 18.120625% |
Noise dominated data is calculated using 1-second bins in cleaned event files. If a bin has >2000 counts, and if more than 50% of those come from <1% of pixels, then it is considered to be noise-dominated and hence unusable.
| Quadrant | # 1 sec bins | Bins with >0 counts | Bins with >2000 counts | High rate bins dominated by noise | Noise dominated (total time) | Noise dominated (detector-on time) | Marked lightcurve |
|---|---|---|---|---|---|---|---|
| A | 7428 | 7428 | 43 | 43 | 0.58% | 0.58% | 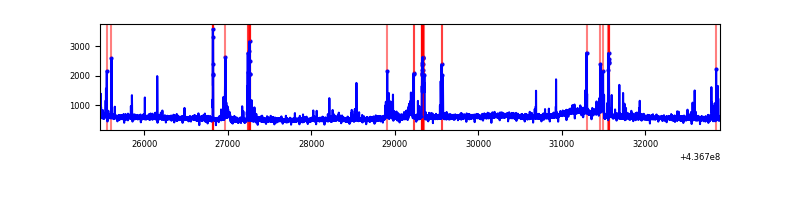 |
| B | 7428 | 7428 | 137 | 137 | 1.84% | 1.84% | 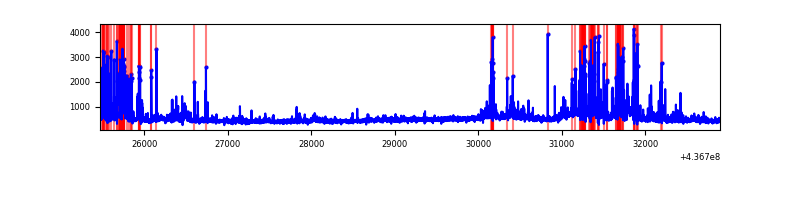 |
| C | 7428 | 7428 | 1394 | 1394 | 18.77% | 18.77% | 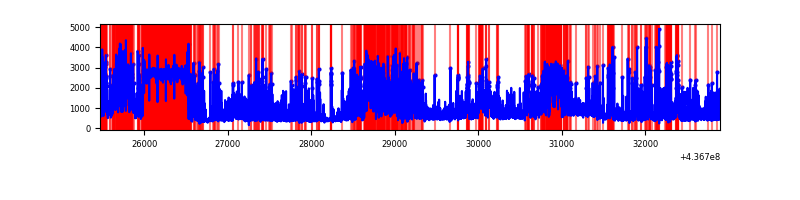 |
| D | 7428 | 7428 | 1058 | 1058 | 14.24% | 14.24% | 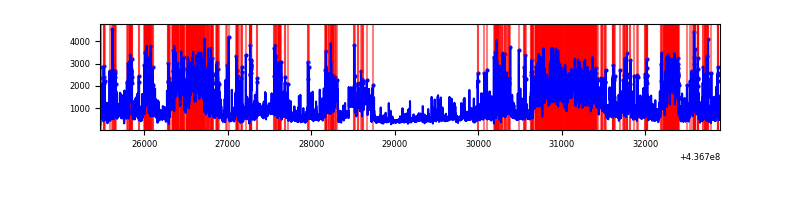 |
Top three noisy pixels from each quadrant. If the there are fewer than three noisy pixels in the level2.evt file, extra rows are filled as -1
| Pixel properties | Quadrant properties | ||||||
|---|---|---|---|---|---|---|---|
| Quadrant | DetID | PixID | Counts | Sigma | Mean | Median | Sigma |
| A | 10 | 83 | 1039513 | 5874.01 | 845 | 828 | 176.8 |
| A | 15 | 223 | 249871 | 1408.4 | 845 | 828 | 176.8 |
| A | 13 | 248 | 97864 | 548.76 | 845 | 828 | 176.8 |
| B | 5 | 235 | 287660 | 1733.87 | 838 | 813 | 165.4 |
| B | 0 | 200 | 117933 | 707.94 | 838 | 813 | 165.4 |
| B | 15 | 36 | 116078 | 696.73 | 838 | 813 | 165.4 |
| C | 15 | 174 | 3032501 | 17125.43 | 752 | 756 | 177.0 |
| C | 15 | 158 | 1911055 | 10790.71 | 752 | 756 | 177.0 |
| C | 3 | 233 | 344118 | 1939.55 | 752 | 756 | 177.0 |
| D | 12 | 33 | 2576151 | 12846.1 | 775 | 752 | 200.5 |
| D | 5 | 222 | 781093 | 3892.34 | 775 | 752 | 200.5 |
| D | 1 | 52 | 540625 | 2692.89 | 775 | 752 | 200.5 |
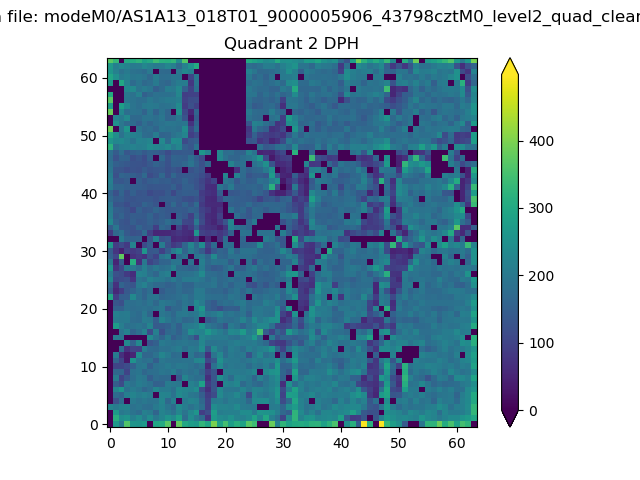
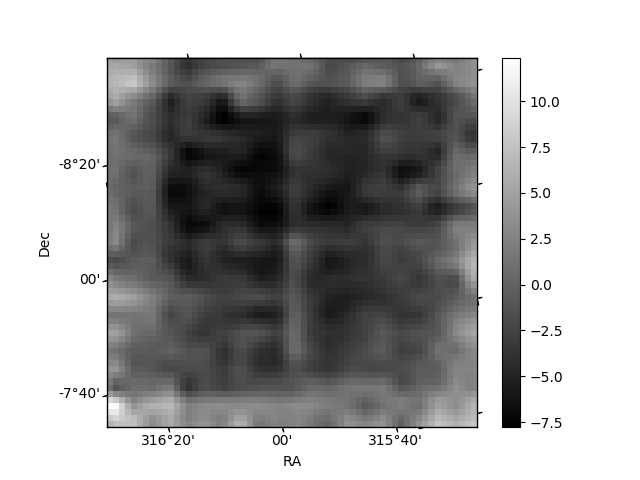
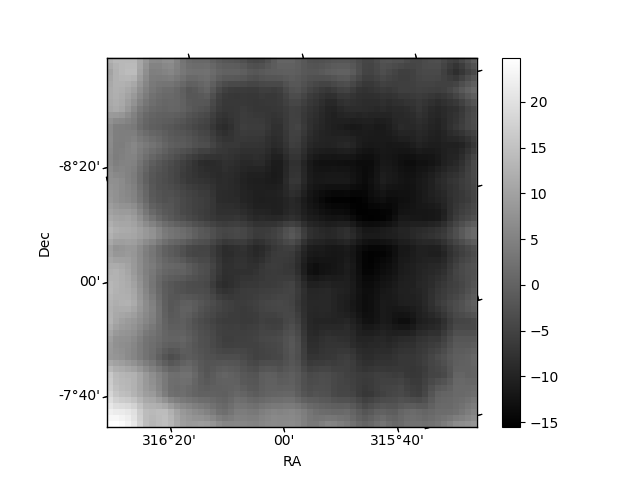
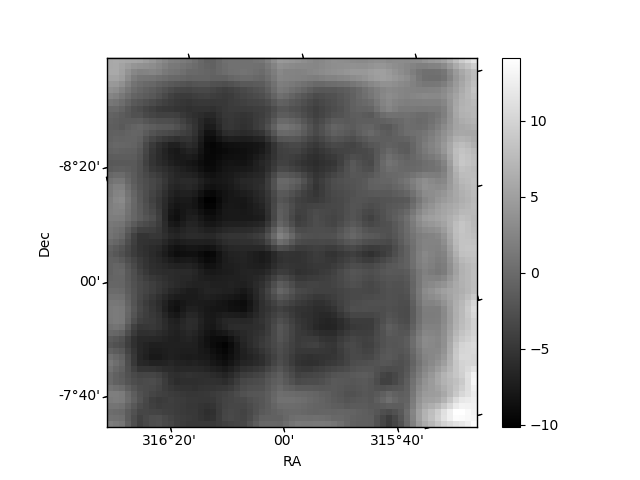
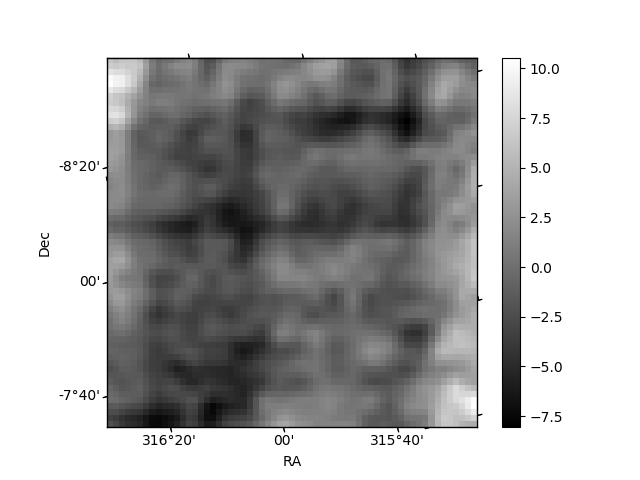
Histogram calculated using DETX and DETY for each event in the final _common_clean file
| Quadrant A |  |
 |
Quadrant B |
|---|---|---|---|
| Quadrant D | 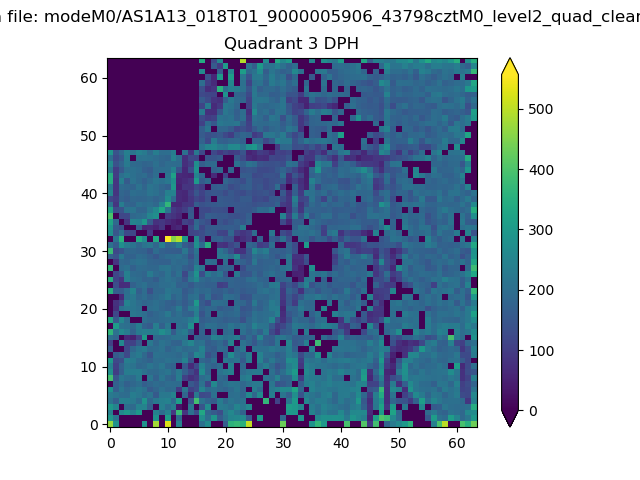 |
 |
Quadrant C |
| Plot type | Count rate plots | Images |
|---|---|---|
| Comparison with Poisson distribution Blue bars denote a histogram of data divided into 1 sec bins. Red curve is a Poisson curve with rate = median count rate of data. |
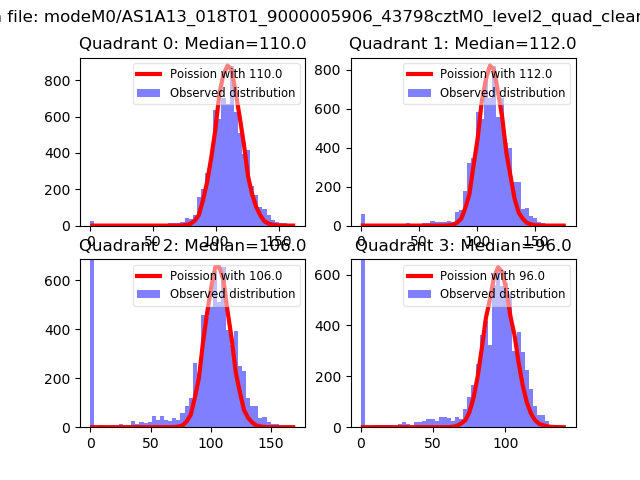 |
 |
| Quadrant-wise count rates Data is divided into 100 sec bins |
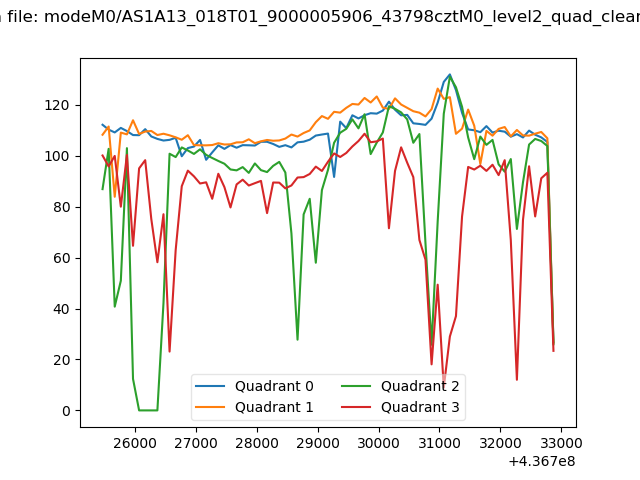 |
|
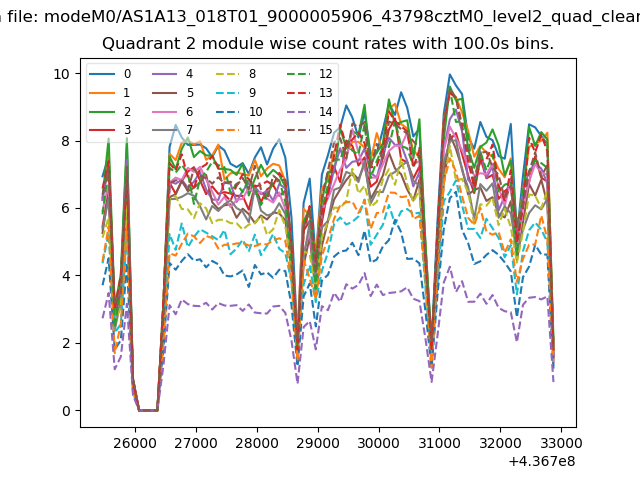
| Module-wise count rates for Quadrant A Data is divided into 100 sec bins |
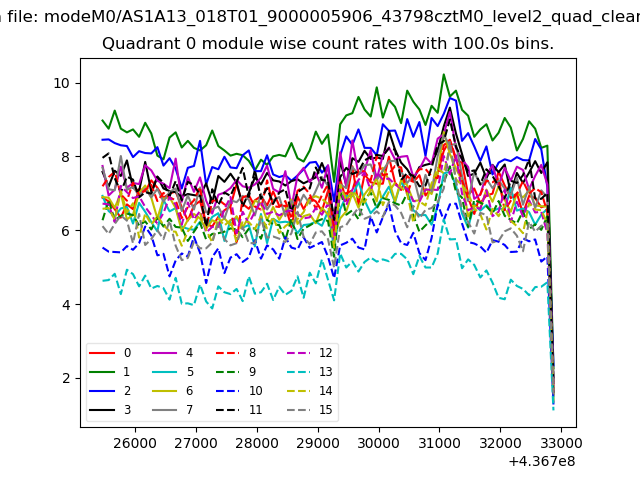 |
 |
| Module-wise count rates for Quadrant B Data is divided into 100 sec bins |
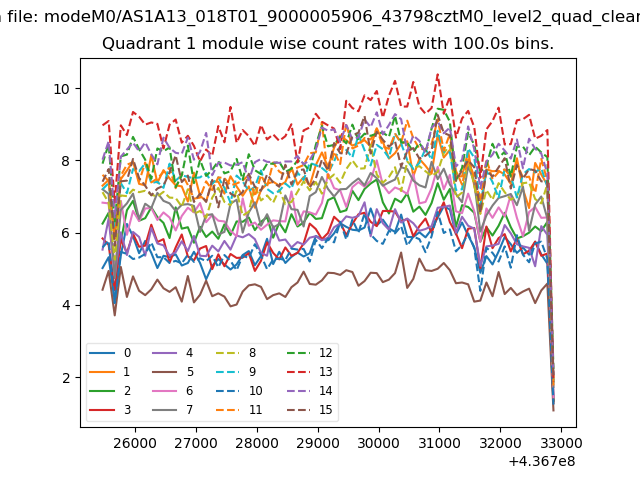 |
 |
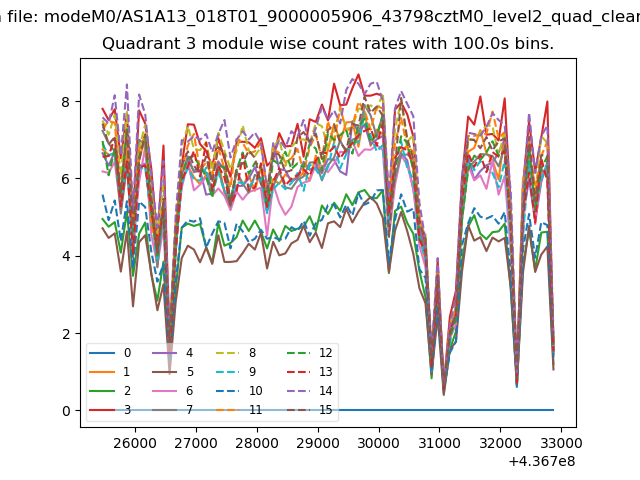
| Module-wise count rates for Quadrant C Data is divided into 100 sec bins |
 |
 |
| Module-wise count rates for Quadrant D Data is divided into 100 sec bins |
 |
 |
| Parameter | Plot |
|---|---|
| CZT HV Monitor | 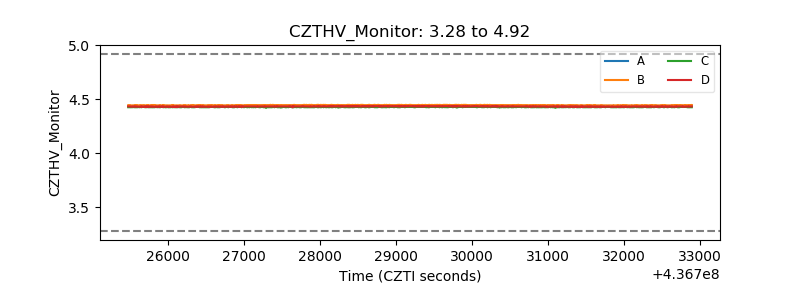 |
| D_VDD | 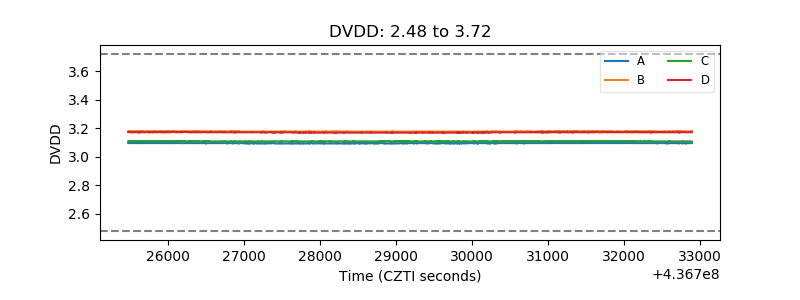 |
| Temperature 1 | 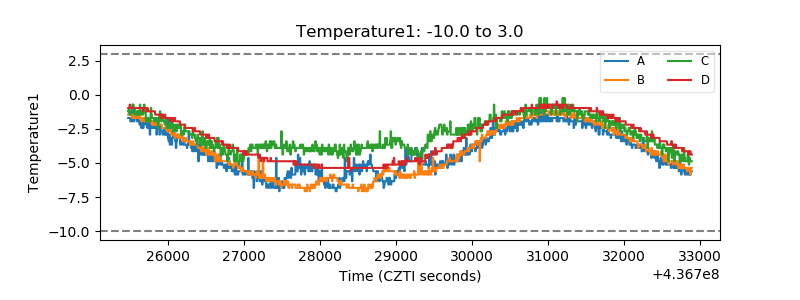 |
| Veto HV Monitor | 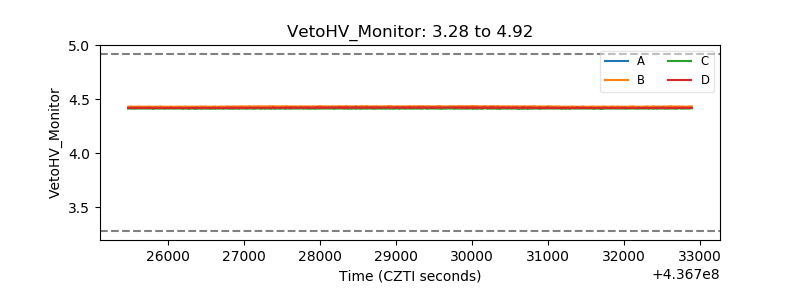 |
| Veto LLD | 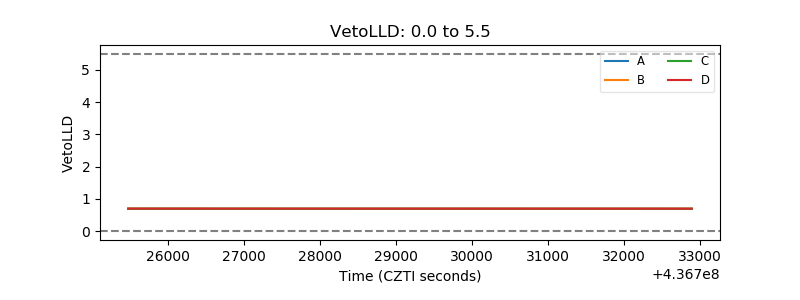 |
| Alpha Counter | 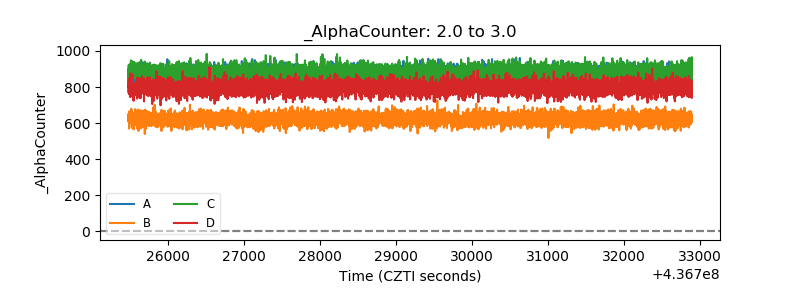 |
| _CPM_Rate | 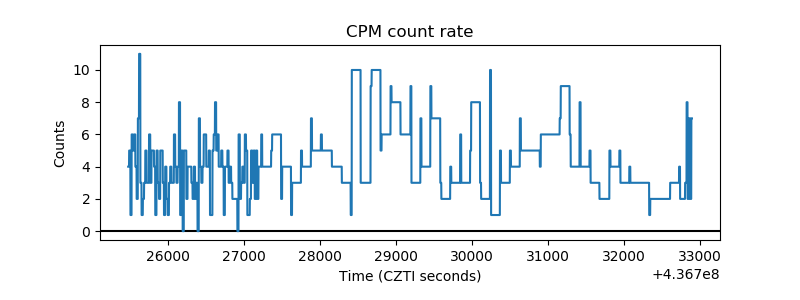 |
| CZT Counter | 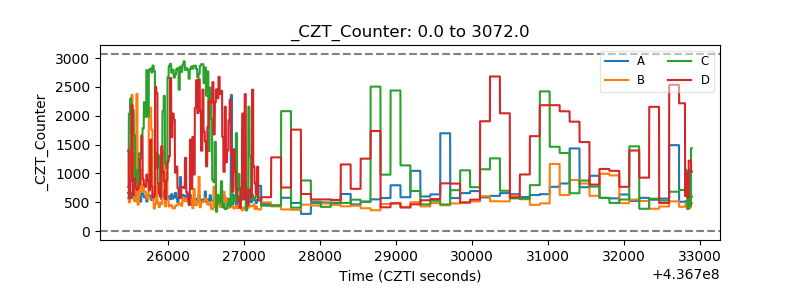 |
| +2.5 Volts monitor | 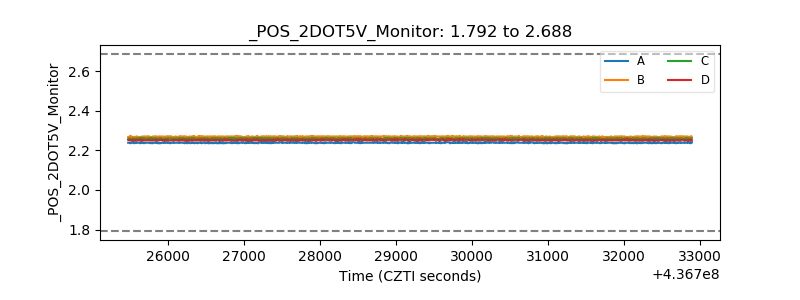 |
| +5 Volts monitor | 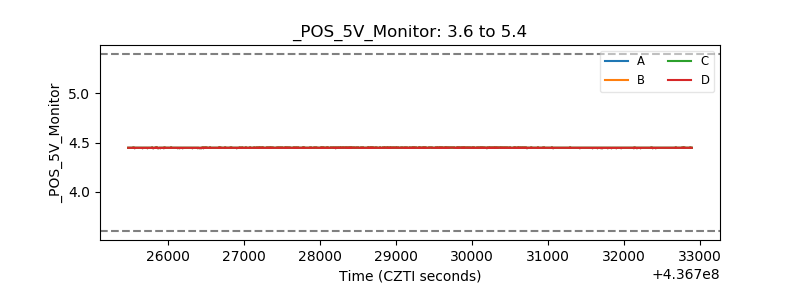 |
| _ROLL_ROT | 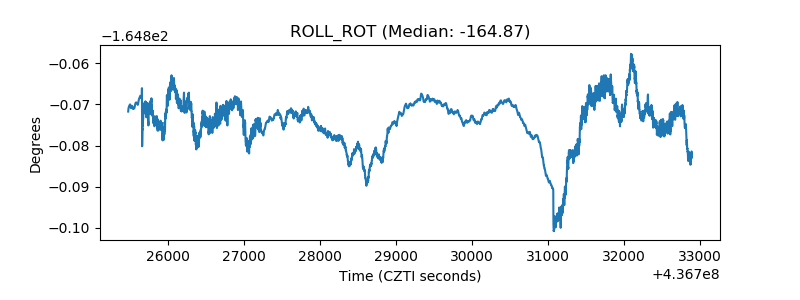 |
| _Roll_DEC | 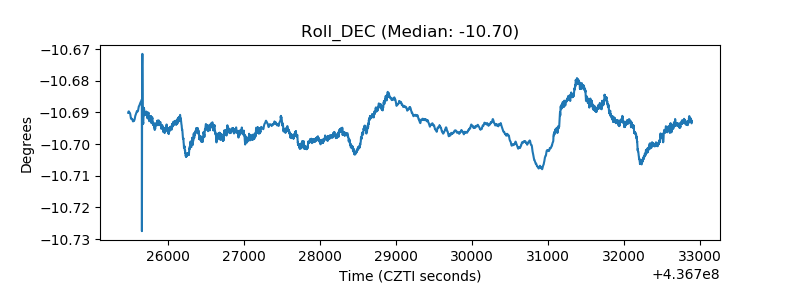 |
| _Roll_RA | 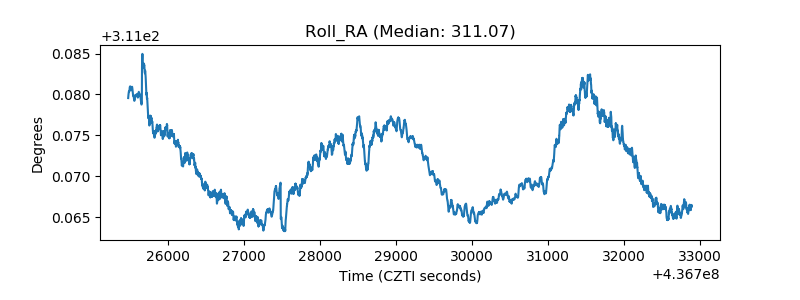 |
| Veto Counter | 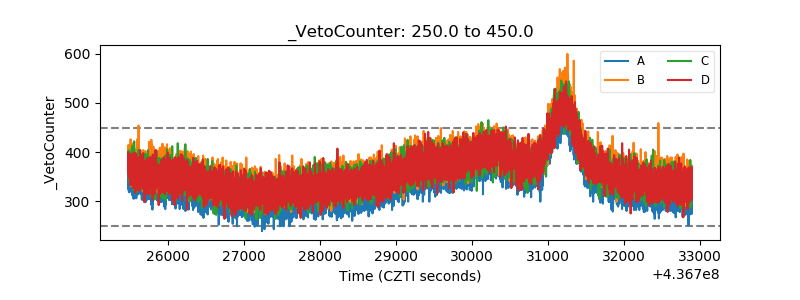 |