| Param | Original file | Final file |
|---|---|---|
| Filename | modeM0/AS1A13_018T01_9000005906_43801cztM0_level2.fits | modeM0/AS1A13_018T01_9000005906_43801cztM0_level2_quad_clean.evt |
| Size (bytes) | 2,035,837,440 | 285,249,600 |
| Size | 1.9 GB | 272.0 MB |
| Events in quadrant A | 15,079,690 | 1,991,944 |
| Events in quadrant B | 12,061,935 | 2,118,042 |
| Events in quadrant C | 25,262,668 | 1,585,048 |
| Events in quadrant D | 21,422,056 | 1,569,971 |
| Mode M0 | |||
|---|---|---|---|
| Quadrant | BADHDUFLAG | Total packets | Discarded packets |
| A | 0 | 57822 | 2 |
| B | 0 | 49228 | 2 |
| C | 0 | 88789 | 2 |
| D | 0 | 77362 | 2 |
| Mode SS | |||
|---|---|---|---|
| Quadrant | BADHDUFLAG | Total packets | Discarded packets |
| A | 0 | 402 | 0 |
| B | 0 | 402 | 0 |
| C | 0 | 402 | 0 |
| D | 0 | 402 | 0 |
| Mode M9 | |||
|---|---|---|---|
| Quadrant | BADHDUFLAG | Total packets | Discarded packets |
| A | 0 | 11 | 0 |
| B | 0 | 11 | 0 |
| C | 0 | 11 | 0 |
| D | 0 | 11 | 0 |
| Quadrant | Total seconds | Saturated seconds | Saturation percentage |
|---|---|---|---|
| A | 19891 | 1379 | 6.932784% |
| B | 19892 | 998 | 5.017092% |
| C | 19892 | 5398 | 27.136537% |
| D | 19892 | 3496 | 17.574904% |
Noise dominated data is calculated using 1-second bins in cleaned event files. If a bin has >2000 counts, and if more than 50% of those come from <1% of pixels, then it is considered to be noise-dominated and hence unusable.
| Quadrant | # 1 sec bins | Bins with >0 counts | Bins with >2000 counts | High rate bins dominated by noise | Noise dominated (total time) | Noise dominated (detector-on time) | Marked lightcurve |
|---|---|---|---|---|---|---|---|
| A | 21001 | 19893 | 800 | 800 | 3.81% | 4.02% | 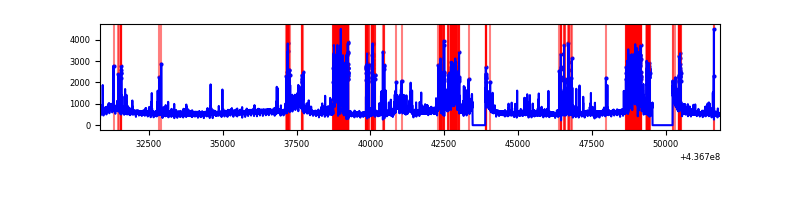 |
| B | 21002 | 19894 | 527 | 527 | 2.51% | 2.65% | 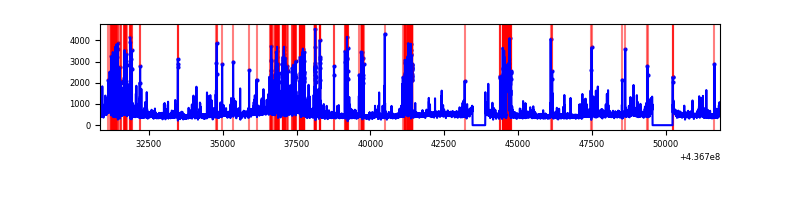 |
| C | 21002 | 19893 | 4719 | 4719 | 22.47% | 23.72% | 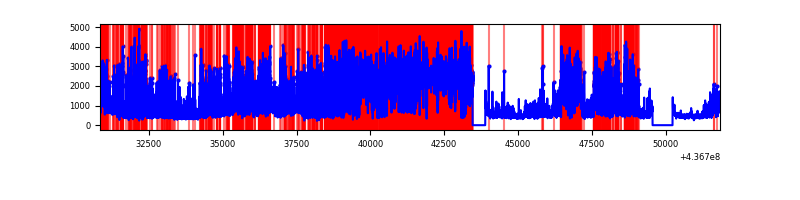 |
| D | 21002 | 19894 | 2594 | 2594 | 12.35% | 13.04% | 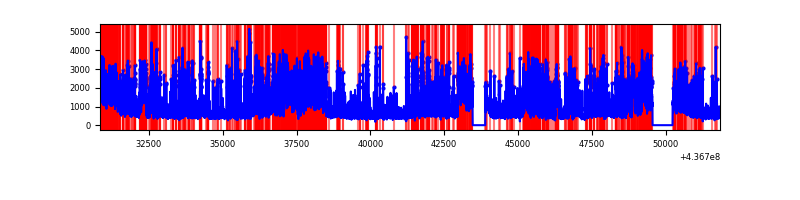 |
Top three noisy pixels from each quadrant. If the there are fewer than three noisy pixels in the level2.evt file, extra rows are filled as -1
| Pixel properties | Quadrant properties | ||||||
|---|---|---|---|---|---|---|---|
| Quadrant | DetID | PixID | Counts | Sigma | Mean | Median | Sigma |
| A | 15 | 223 | 3290593 | 7059.83 | 2245 | 2200 | 465.8 |
| A | 10 | 83 | 2717442 | 5829.34 | 2245 | 2200 | 465.8 |
| A | 13 | 248 | 277808 | 591.7 | 2245 | 2200 | 465.8 |
| B | 5 | 235 | 1000132 | 2276.56 | 2246 | 2181 | 438.4 |
| B | 0 | 200 | 945842 | 2152.71 | 2246 | 2181 | 438.4 |
| B | 4 | 170 | 304260 | 689.11 | 2246 | 2181 | 438.4 |
| C | 15 | 174 | 13009562 | 27952.45 | 1982 | 1992 | 465.3 |
| C | 15 | 158 | 2743465 | 5891.25 | 1982 | 1992 | 465.3 |
| C | 3 | 233 | 860082 | 1843.98 | 1982 | 1992 | 465.3 |
| D | 12 | 33 | 6493228 | 11937.53 | 2100 | 2032 | 543.8 |
| D | 5 | 235 | 1339611 | 2459.85 | 2100 | 2032 | 543.8 |
| D | 12 | 2 | 696452 | 1277.06 | 2100 | 2032 | 543.8 |
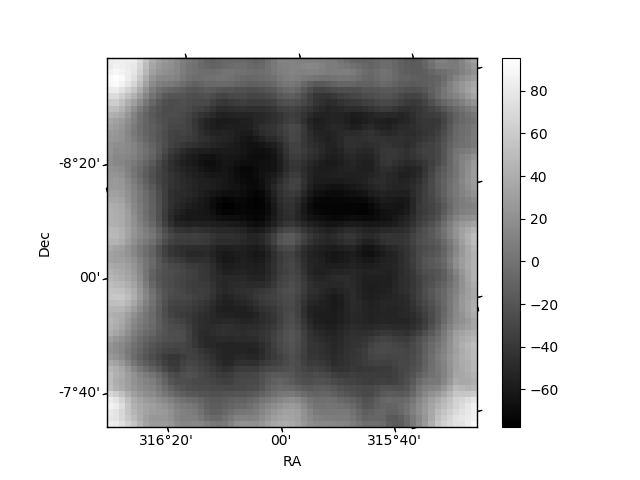
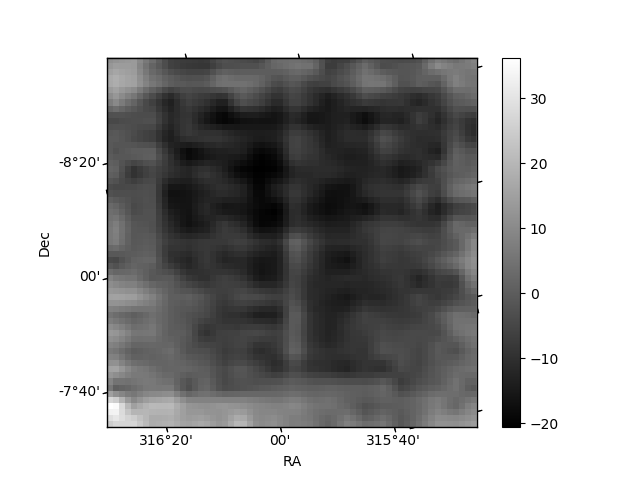
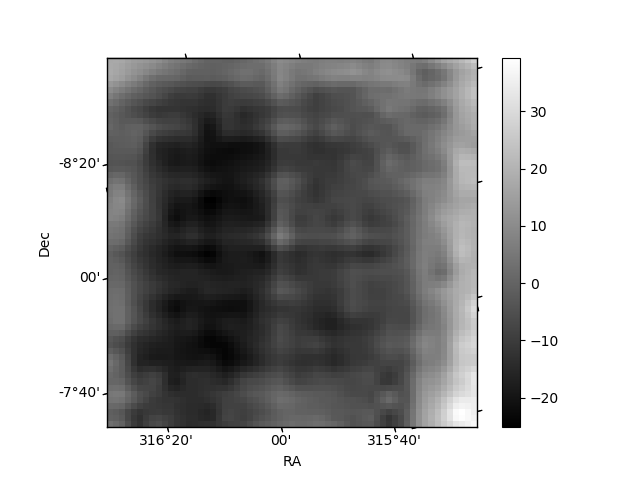
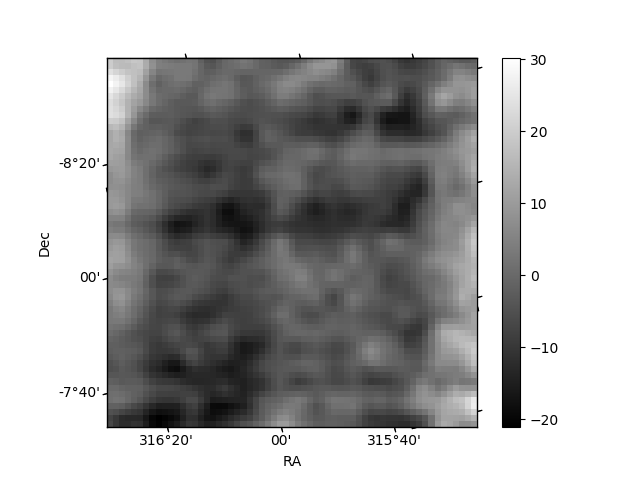
Histogram calculated using DETX and DETY for each event in the final _common_clean file
| Quadrant A | 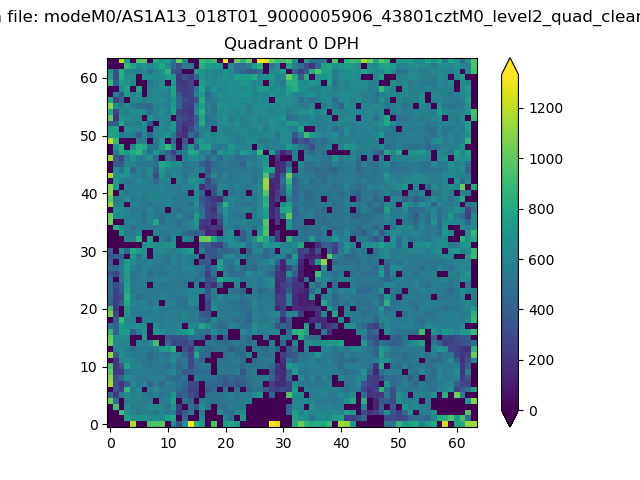 |
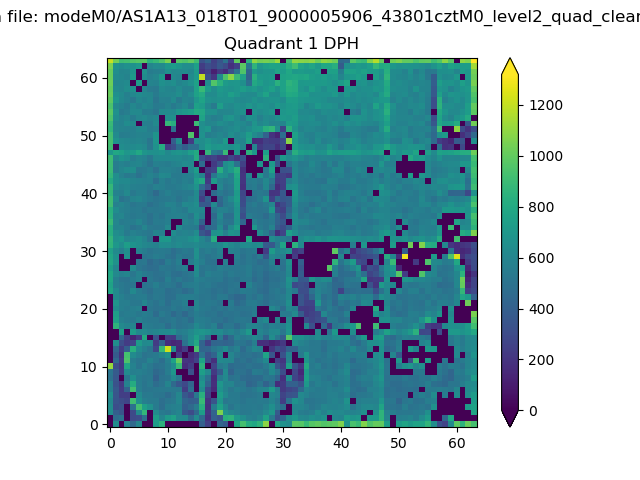 |
Quadrant B |
|---|---|---|---|
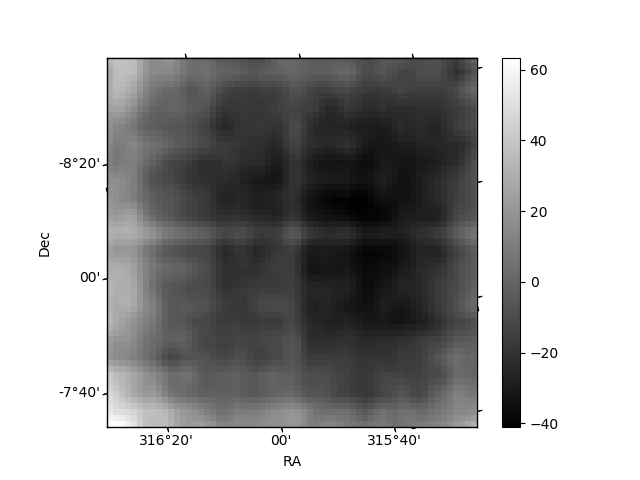
| Quadrant D | 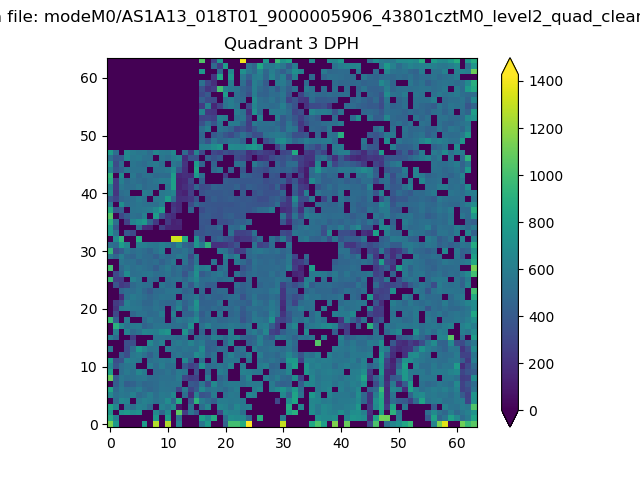 |
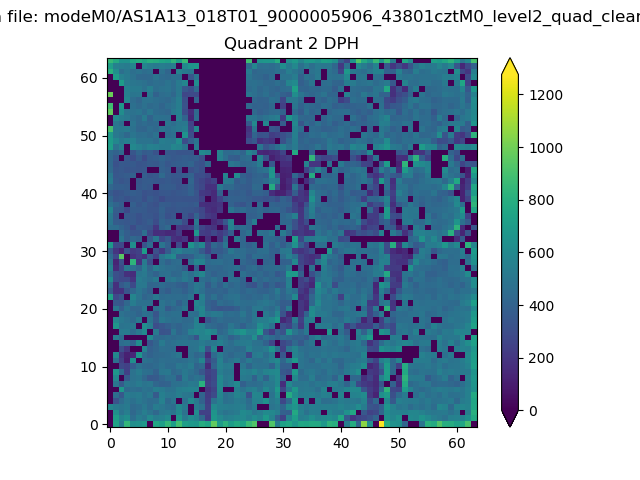 |
Quadrant C |
| Plot type | Count rate plots | Images |
|---|---|---|
| Comparison with Poisson distribution Blue bars denote a histogram of data divided into 1 sec bins. Red curve is a Poisson curve with rate = median count rate of data. |
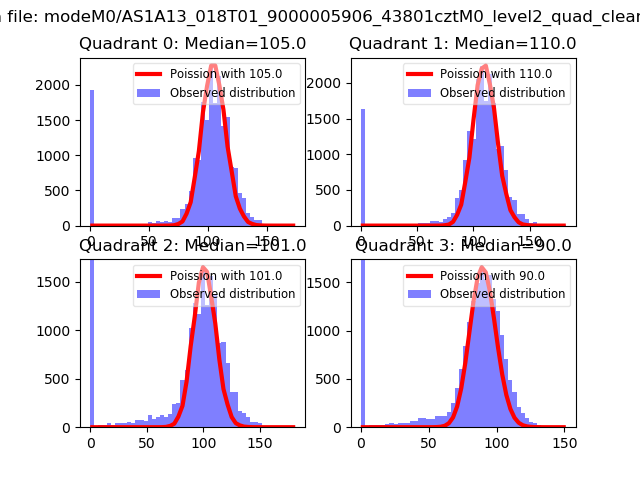 |
 |
| Quadrant-wise count rates Data is divided into 100 sec bins |
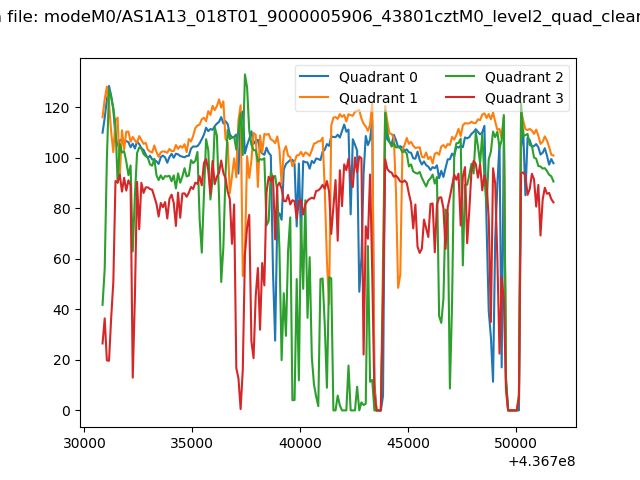 |
|
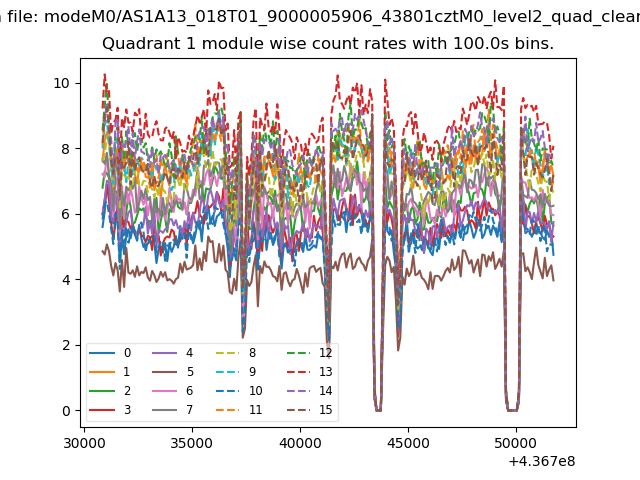
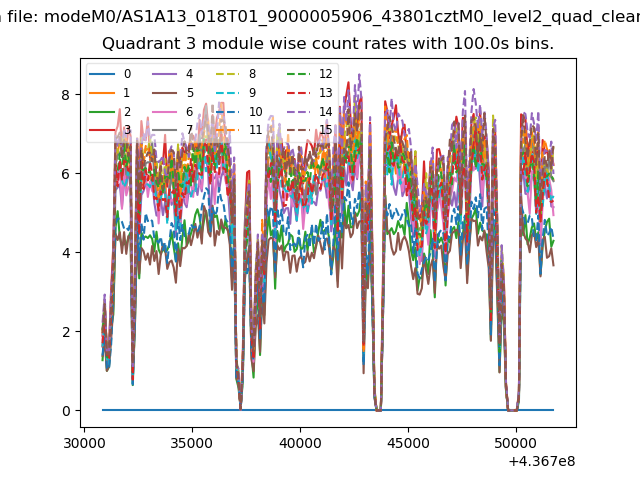
| Module-wise count rates for Quadrant A Data is divided into 100 sec bins |
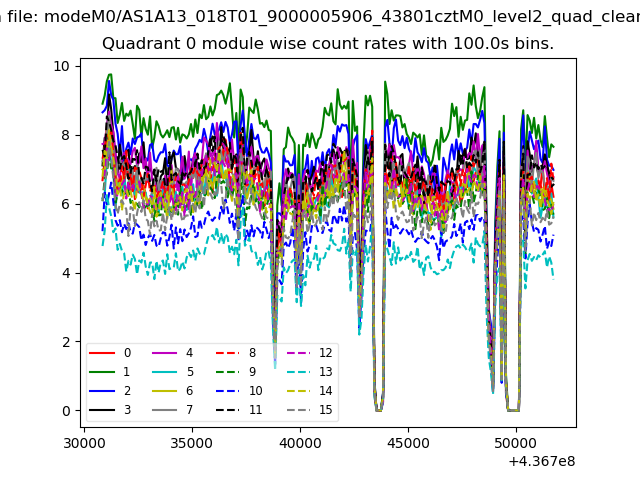 |
 |
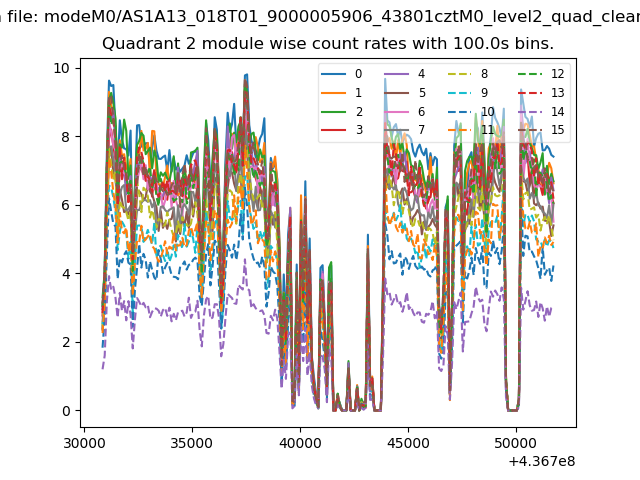
| Module-wise count rates for Quadrant B Data is divided into 100 sec bins |
 |
 |
| Module-wise count rates for Quadrant C Data is divided into 100 sec bins |
 |
 |
| Module-wise count rates for Quadrant D Data is divided into 100 sec bins |
 |
 |
| Parameter | Plot |
|---|---|
| CZT HV Monitor | 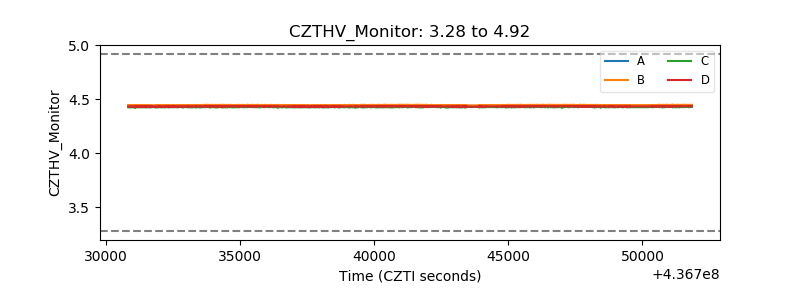 |
| D_VDD | 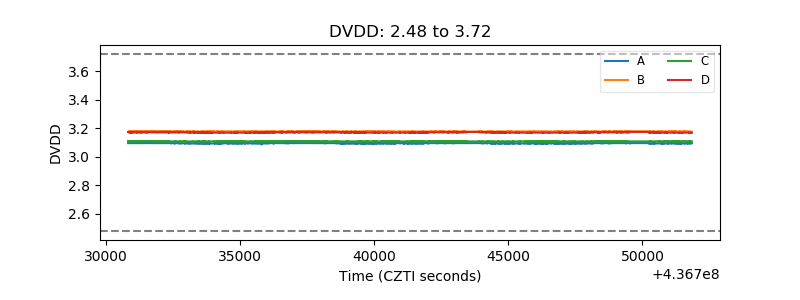 |
| Temperature 1 | 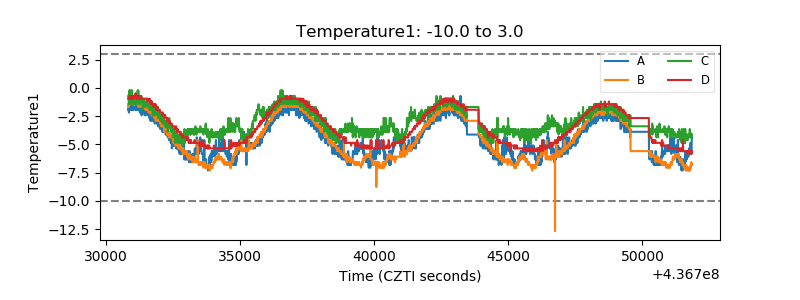 |
| Veto HV Monitor | 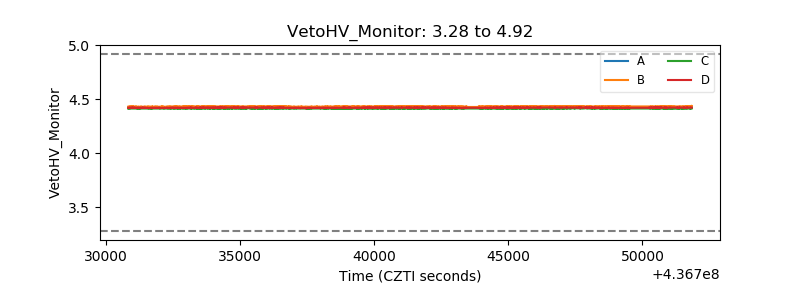 |
| Veto LLD |  |
| Alpha Counter | 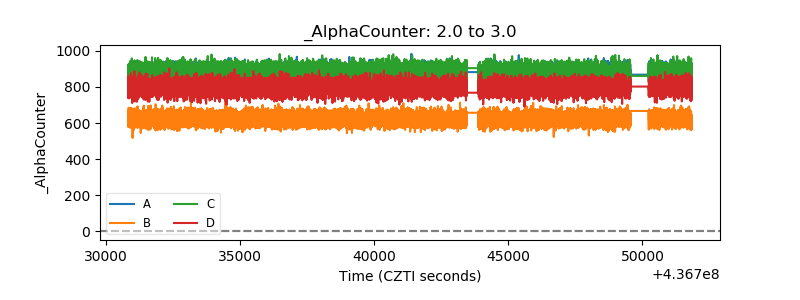 |
| _CPM_Rate | 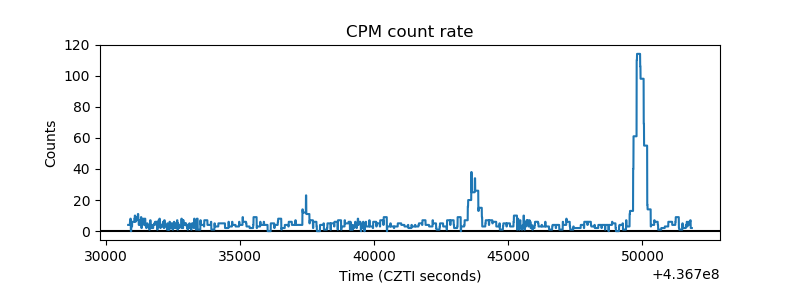 |
| CZT Counter | 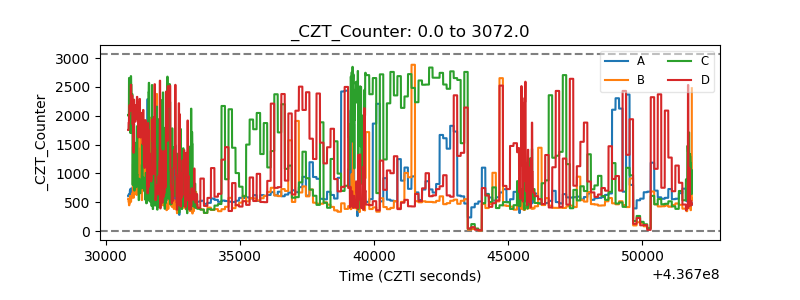 |
| +2.5 Volts monitor | 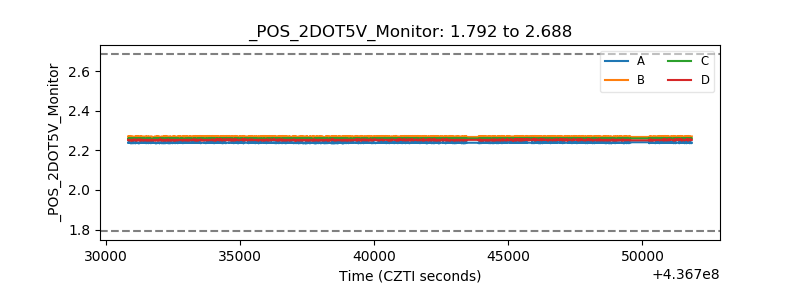 |
| +5 Volts monitor | 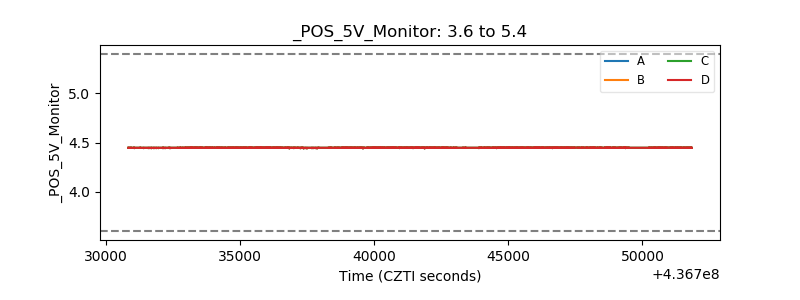 |
| _ROLL_ROT | 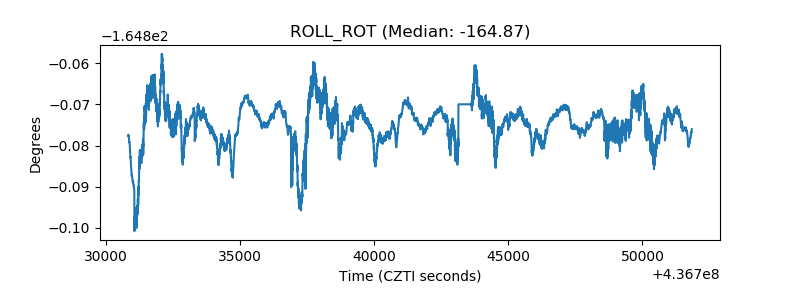 |
| _Roll_DEC | 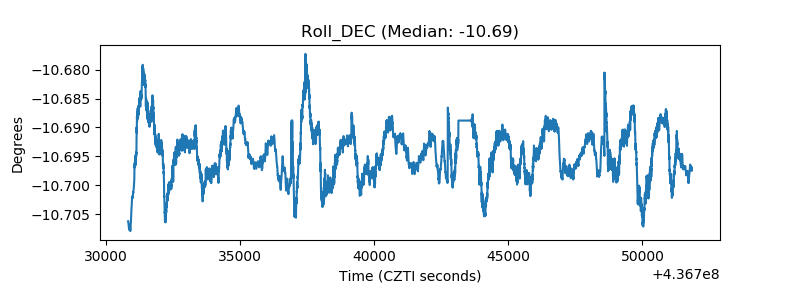 |
| _Roll_RA | 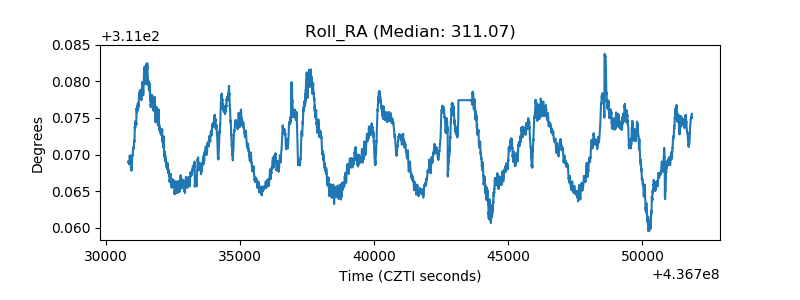 |
| Veto Counter | 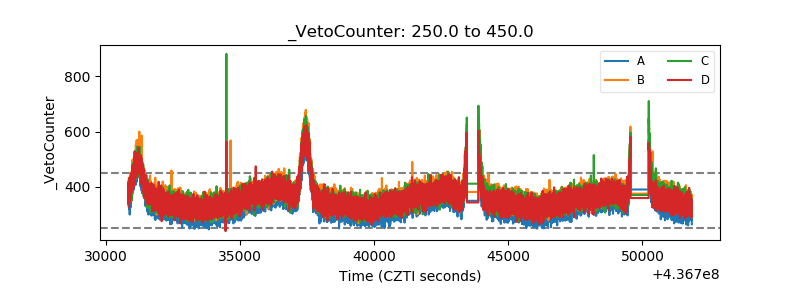 |