| Param | Original file | Final file |
|---|---|---|
| Filename | modeM0/AS1A13_018T01_9000005906_43802cztM0_level2.fits | modeM0/AS1A13_018T01_9000005906_43802cztM0_level2_quad_clean.evt |
| Size (bytes) | 684,480,960 | 107,746,560 |
| Size | 652.8 MB | 102.8 MB |
| Events in quadrant A | 6,088,265 | 703,968 |
| Events in quadrant B | 3,621,155 | 796,161 |
| Events in quadrant C | 8,269,423 | 626,177 |
| Events in quadrant D | 6,804,451 | 637,497 |
| Mode M0 | |||
|---|---|---|---|
| Quadrant | BADHDUFLAG | Total packets | Discarded packets |
| A | 0 | 22675 | 2 |
| B | 0 | 15437 | 2 |
| C | 0 | 29395 | 2 |
| D | 0 | 25188 | 2 |
| Mode SS | |||
|---|---|---|---|
| Quadrant | BADHDUFLAG | Total packets | Discarded packets |
| A | 0 | 148 | 0 |
| B | 0 | 148 | 0 |
| C | 0 | 148 | 0 |
| D | 0 | 148 | 0 |
| Mode M9 | |||
|---|---|---|---|
| Quadrant | BADHDUFLAG | Total packets | Discarded packets |
| A | 0 | 15 | 0 |
| B | 0 | 15 | 0 |
| C | 0 | 15 | 0 |
| D | 0 | 15 | 0 |
| Quadrant | Total seconds | Saturated seconds | Saturation percentage |
|---|---|---|---|
| A | 7153 | 754 | 10.541032% |
| B | 7153 | 102 | 1.425975% |
| C | 7153 | 1538 | 21.501468% |
| D | 7153 | 806 | 11.267999% |
Noise dominated data is calculated using 1-second bins in cleaned event files. If a bin has >2000 counts, and if more than 50% of those come from <1% of pixels, then it is considered to be noise-dominated and hence unusable.
| Quadrant | # 1 sec bins | Bins with >0 counts | Bins with >2000 counts | High rate bins dominated by noise | Noise dominated (total time) | Noise dominated (detector-on time) | Marked lightcurve |
|---|---|---|---|---|---|---|---|
| A | 8688 | 7154 | 484 | 484 | 5.57% | 6.77% | 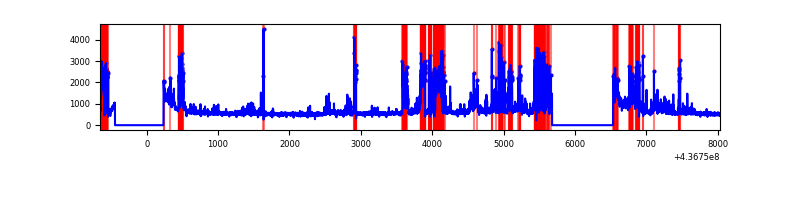 |
| B | 8688 | 7155 | 19 | 19 | 0.22% | 0.27% | 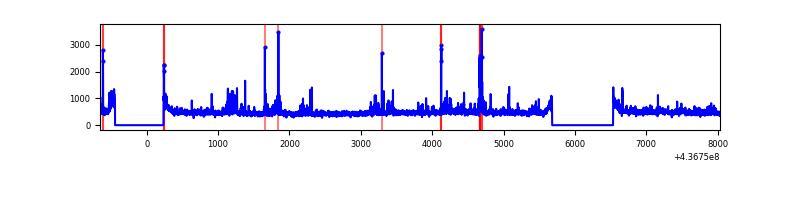 |
| C | 8688 | 7154 | 1399 | 1399 | 16.10% | 19.56% | 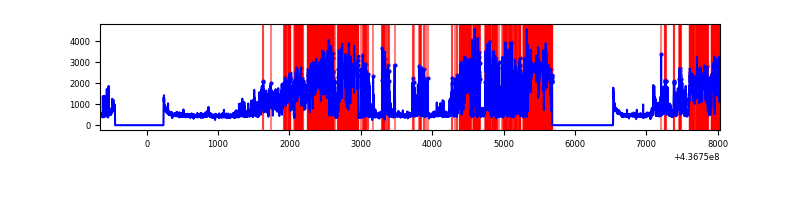 |
| D | 8688 | 7155 | 635 | 635 | 7.31% | 8.87% | 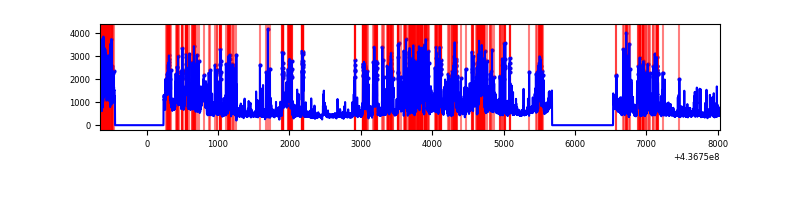 |
Top three noisy pixels from each quadrant. If the there are fewer than three noisy pixels in the level2.evt file, extra rows are filled as -1
| Pixel properties | Quadrant properties | ||||||
|---|---|---|---|---|---|---|---|
| Quadrant | DetID | PixID | Counts | Sigma | Mean | Median | Sigma |
| A | 15 | 223 | 1522271 | 9415.37 | 779 | 764 | 161.6 |
| A | 10 | 83 | 1041775 | 6441.97 | 779 | 764 | 161.6 |
| A | 13 | 248 | 303573 | 1873.84 | 779 | 764 | 161.6 |
| B | 0 | 200 | 107257 | 654.57 | 821 | 798 | 162.6 |
| B | 4 | 170 | 63341 | 384.55 | 821 | 798 | 162.6 |
| B | 0 | 213 | 53571 | 324.48 | 821 | 798 | 162.6 |
| C | 15 | 174 | 4502595 | 25605.14 | 737 | 743 | 175.8 |
| C | 15 | 158 | 327577 | 1858.93 | 737 | 743 | 175.8 |
| C | 15 | 190 | 279460 | 1585.26 | 737 | 743 | 175.8 |
| D | 12 | 33 | 2328744 | 11826.47 | 776 | 753 | 196.8 |
| D | 13 | 249 | 260013 | 1317.07 | 776 | 753 | 196.8 |
| D | 5 | 235 | 219943 | 1113.51 | 776 | 753 | 196.8 |
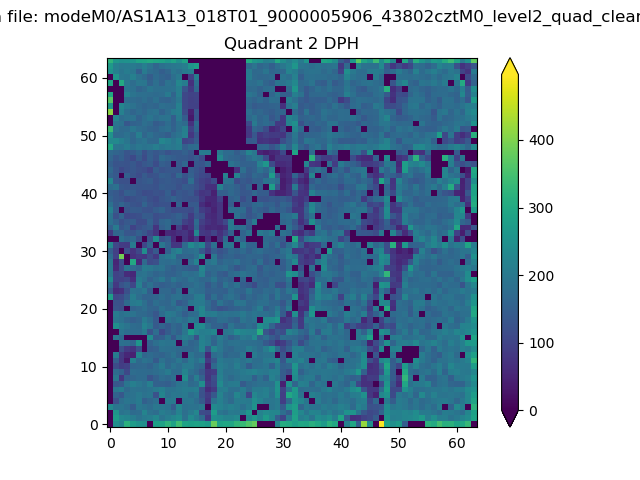
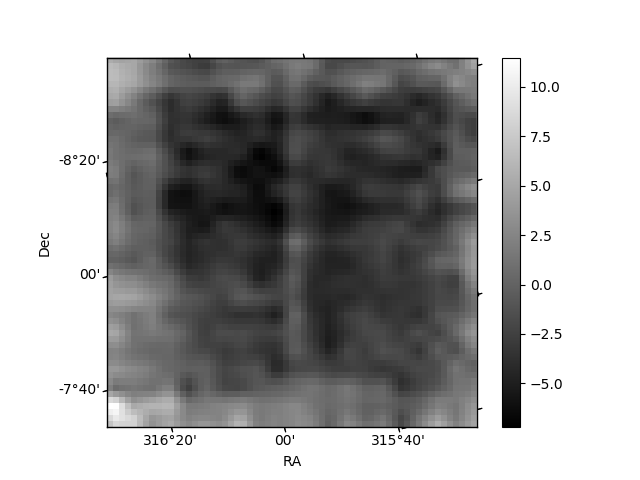
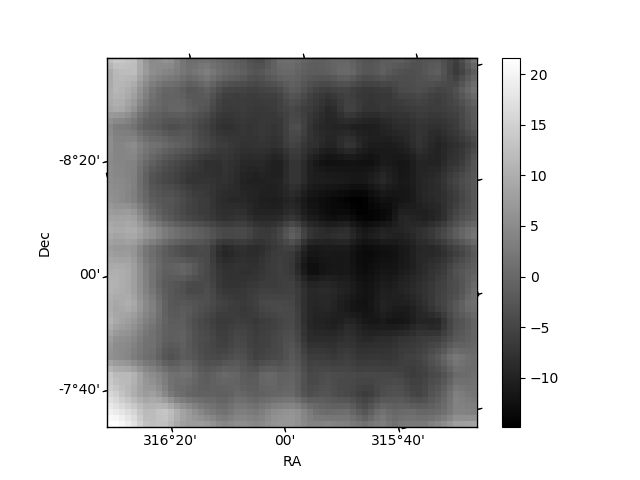
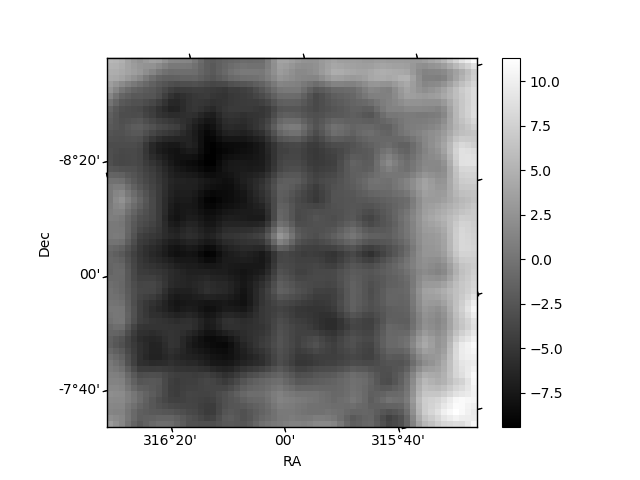
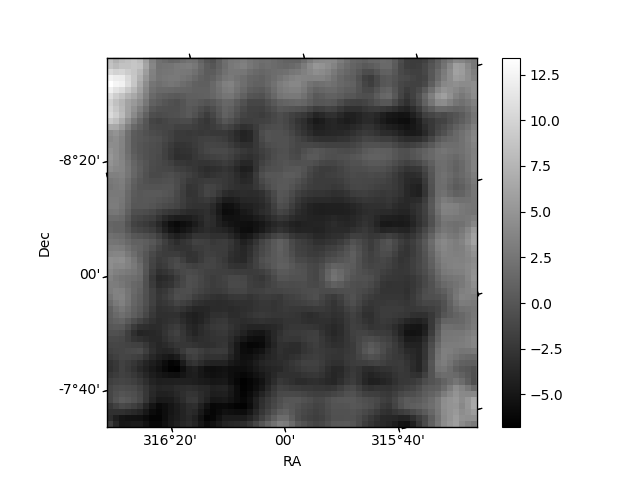
Histogram calculated using DETX and DETY for each event in the final _common_clean file
| Quadrant A | 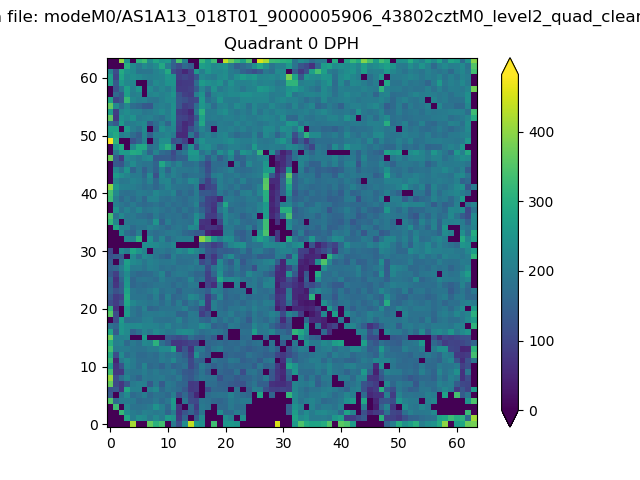 |
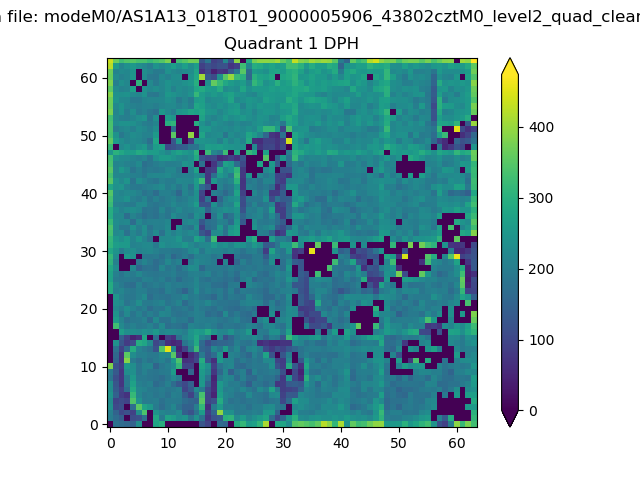 |
Quadrant B |
|---|---|---|---|
| Quadrant D | 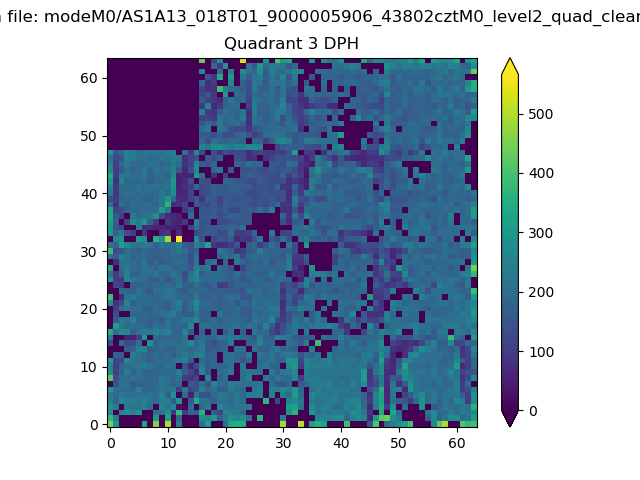 |
 |
Quadrant C |
| Plot type | Count rate plots | Images |
|---|---|---|
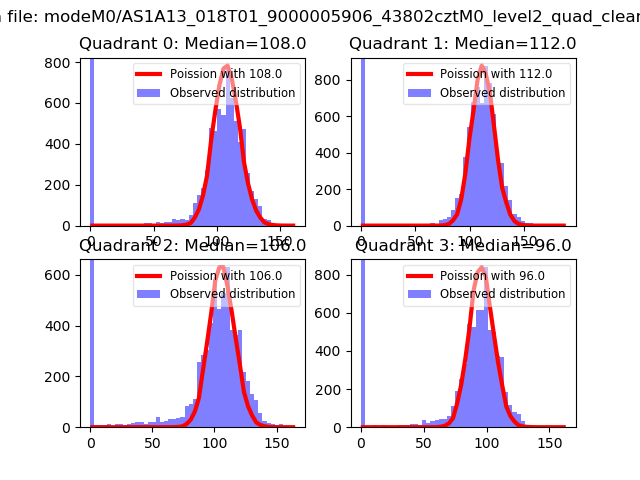
| Comparison with Poisson distribution Blue bars denote a histogram of data divided into 1 sec bins. Red curve is a Poisson curve with rate = median count rate of data. |
 |
 |
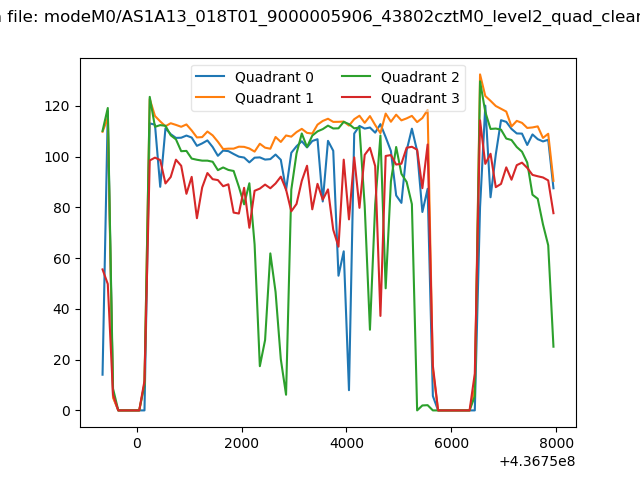
| Quadrant-wise count rates Data is divided into 100 sec bins |
 |
|
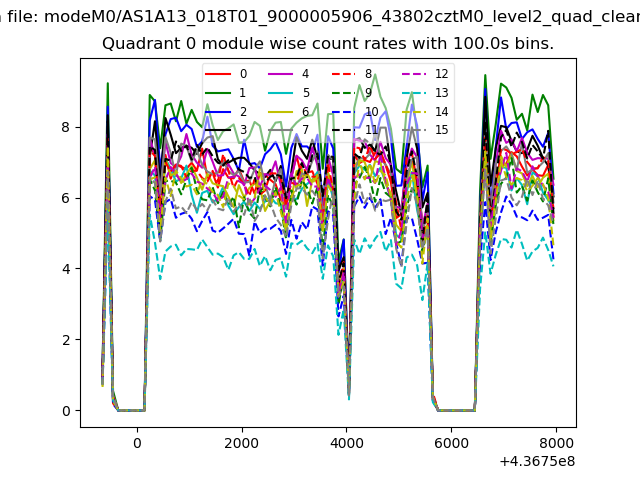
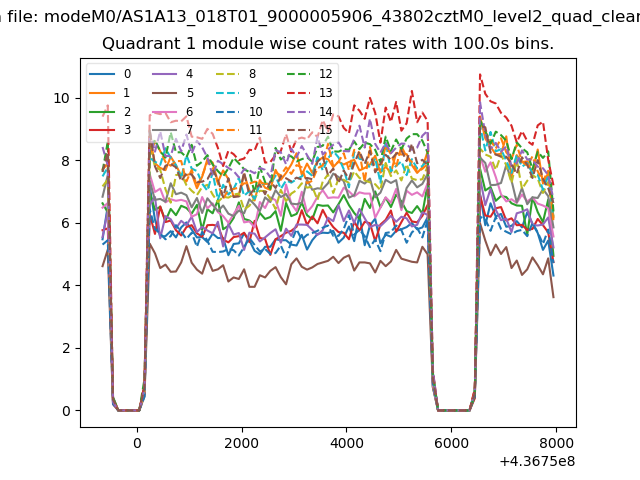
| Module-wise count rates for Quadrant A Data is divided into 100 sec bins |
 |
 |
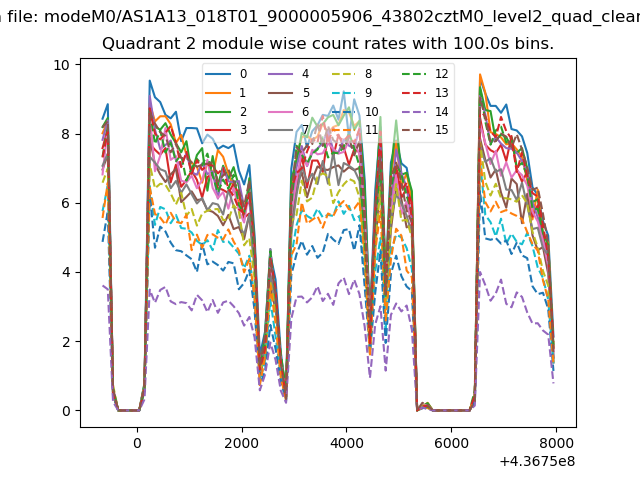
| Module-wise count rates for Quadrant B Data is divided into 100 sec bins |
 |
 |
| Module-wise count rates for Quadrant C Data is divided into 100 sec bins |
 |
 |
| Module-wise count rates for Quadrant D Data is divided into 100 sec bins |
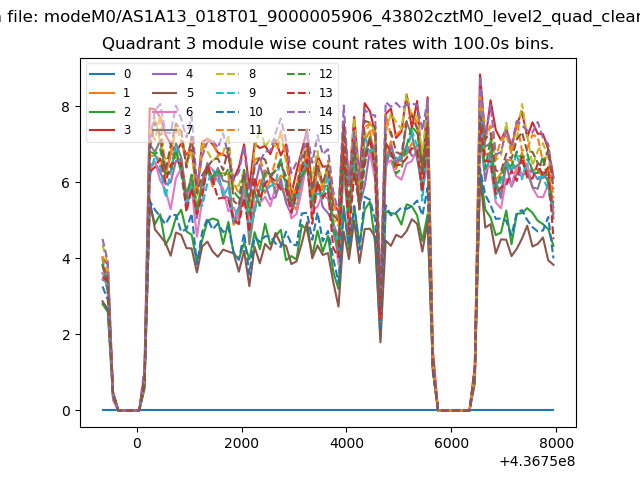 |
 |
| Parameter | Plot |
|---|---|
| CZT HV Monitor | 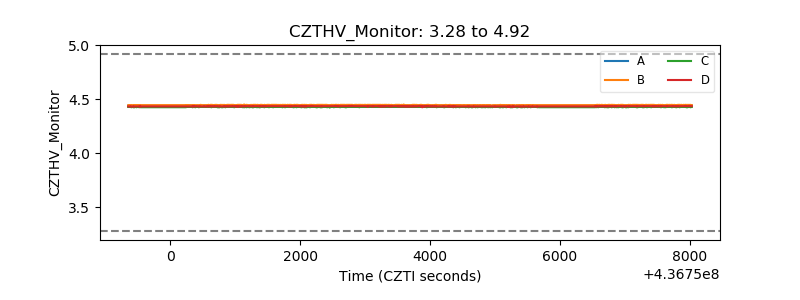 |
| D_VDD | 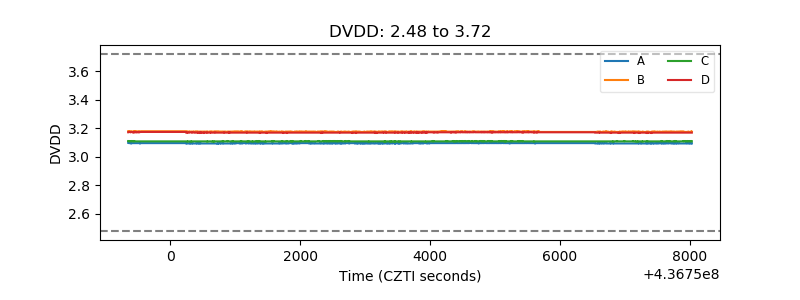 |
| Temperature 1 | 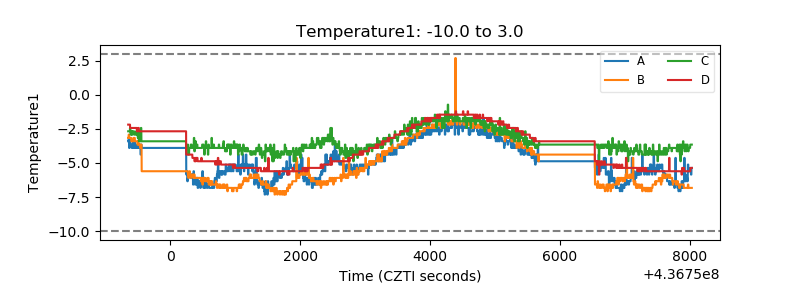 |
| Veto HV Monitor |  |
| Veto LLD | 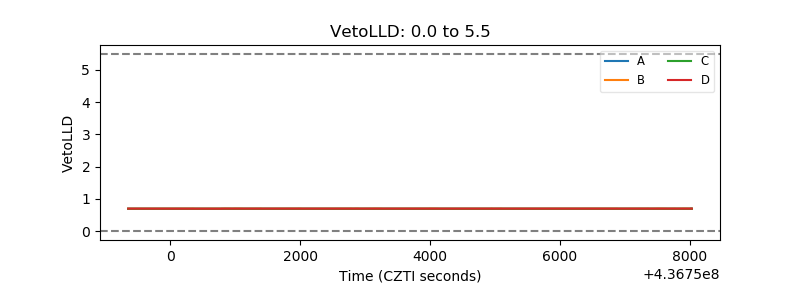 |
| Alpha Counter | 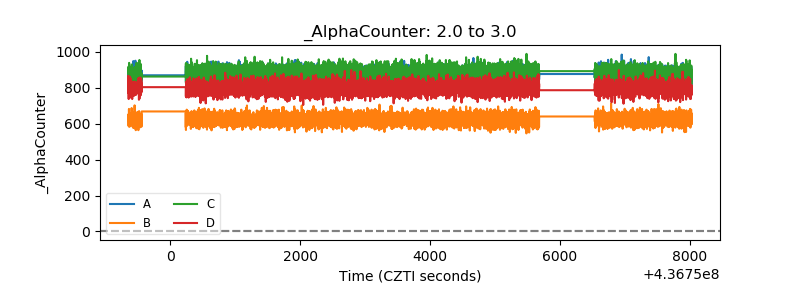 |
| _CPM_Rate | 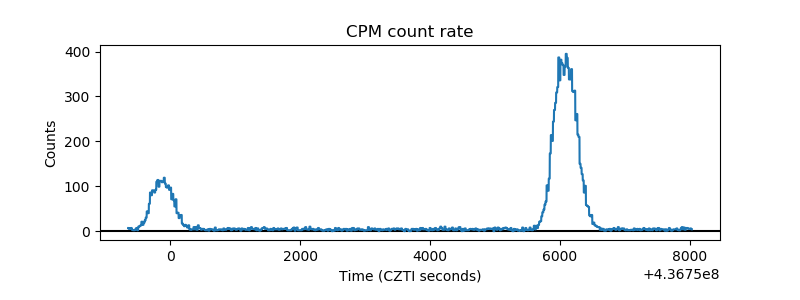 |
| CZT Counter | 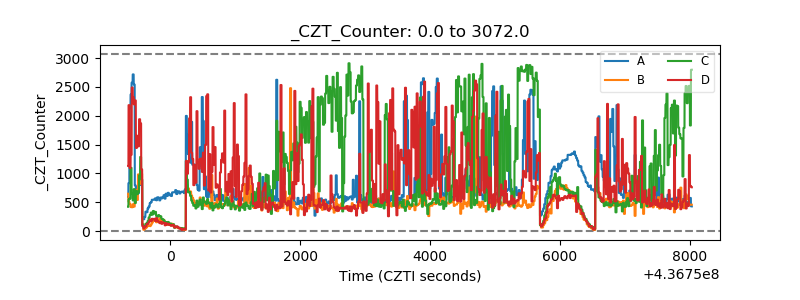 |
| +2.5 Volts monitor | 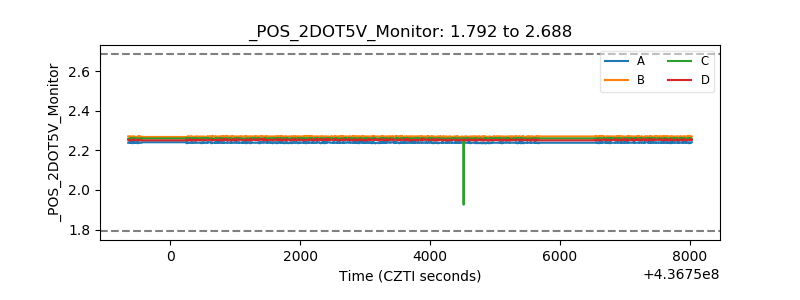 |
| +5 Volts monitor | 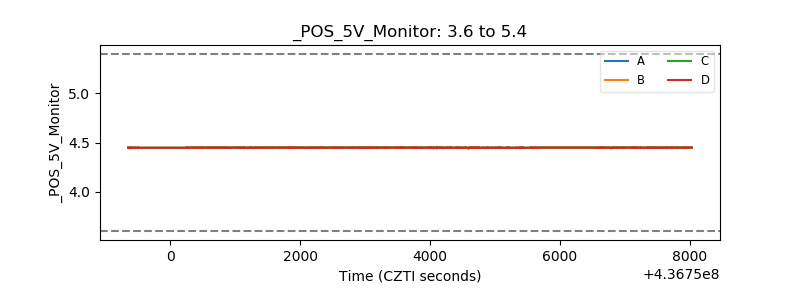 |
| _ROLL_ROT | 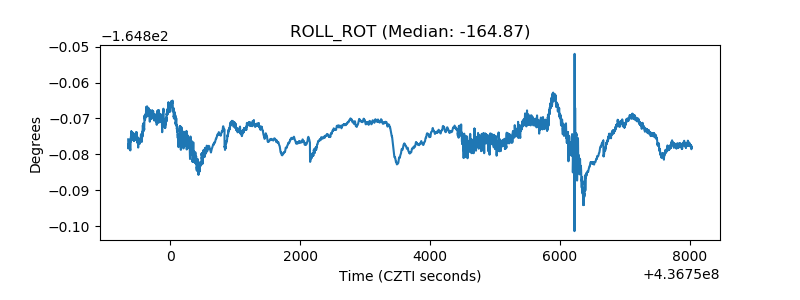 |
| _Roll_DEC | 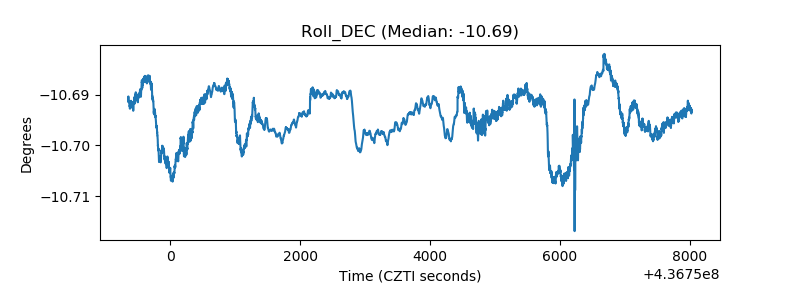 |
| _Roll_RA | 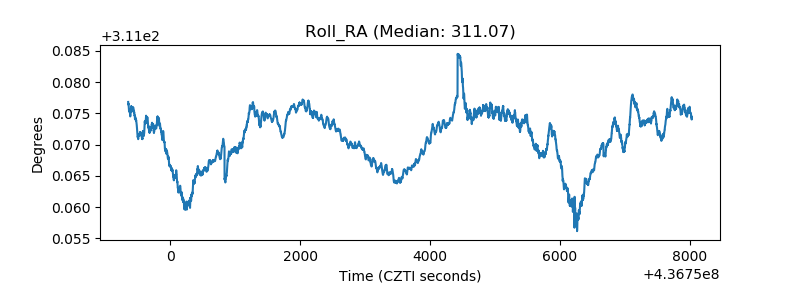 |
| Veto Counter | 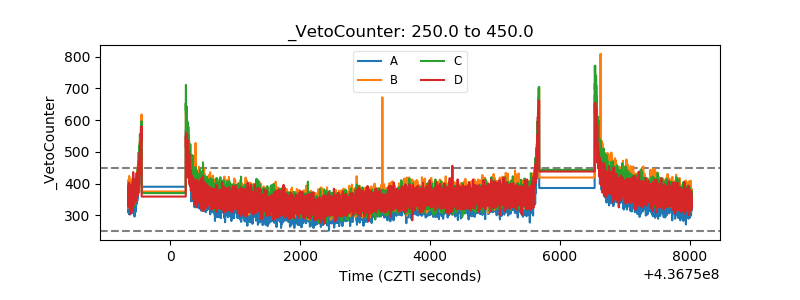 |