| Param | Original file | Final file |
|---|---|---|
| Filename | modeM0/AS1A13_018T01_9000005906_43803cztM0_level2.fits | modeM0/AS1A13_018T01_9000005906_43803cztM0_level2_quad_clean.evt |
| Size (bytes) | 608,670,720 | 104,057,280 |
| Size | 580.5 MB | 99.2 MB |
| Events in quadrant A | 4,925,675 | 723,625 |
| Events in quadrant B | 3,487,879 | 774,410 |
| Events in quadrant C | 8,329,326 | 538,206 |
| Events in quadrant D | 5,268,127 | 647,363 |
| Mode M0 | |||
|---|---|---|---|
| Quadrant | BADHDUFLAG | Total packets | Discarded packets |
| A | 0 | 19009 | 2 |
| B | 0 | 14665 | 2 |
| C | 0 | 29184 | 2 |
| D | 0 | 20271 | 3 |
| Mode SS | |||
|---|---|---|---|
| Quadrant | BADHDUFLAG | Total packets | Discarded packets |
| A | 0 | 136 | 0 |
| B | 0 | 136 | 0 |
| C | 0 | 136 | 0 |
| D | 0 | 136 | 0 |
| Mode M9 | |||
|---|---|---|---|
| Quadrant | BADHDUFLAG | Total packets | Discarded packets |
| A | 0 | 11 | 0 |
| B | 0 | 12 | 0 |
| C | 0 | 12 | 0 |
| D | 0 | 12 | 0 |
| Quadrant | Total seconds | Saturated seconds | Saturation percentage |
|---|---|---|---|
| A | 6703 | 319 | 4.759063% |
| B | 6703 | 99 | 1.476951% |
| C | 6703 | 2064 | 30.792183% |
| D | 6702 | 406 | 6.057893% |
Noise dominated data is calculated using 1-second bins in cleaned event files. If a bin has >2000 counts, and if more than 50% of those come from <1% of pixels, then it is considered to be noise-dominated and hence unusable.
| Quadrant | # 1 sec bins | Bins with >0 counts | Bins with >2000 counts | High rate bins dominated by noise | Noise dominated (total time) | Noise dominated (detector-on time) | Marked lightcurve |
|---|---|---|---|---|---|---|---|
| A | 7723 | 6705 | 154 | 154 | 1.99% | 2.30% | 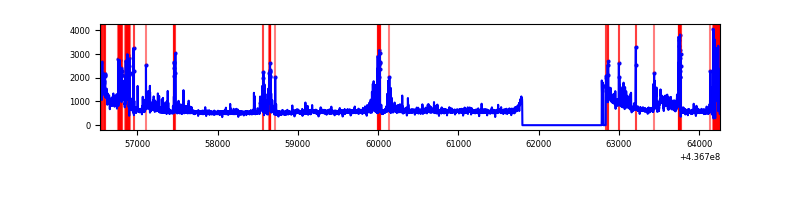 |
| B | 7723 | 6705 | 19 | 19 | 0.25% | 0.28% | 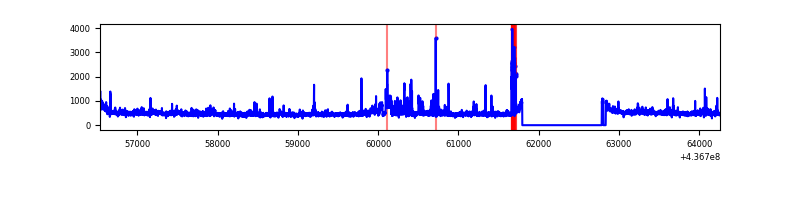 |
| C | 7723 | 6705 | 1951 | 1951 | 25.26% | 29.10% | 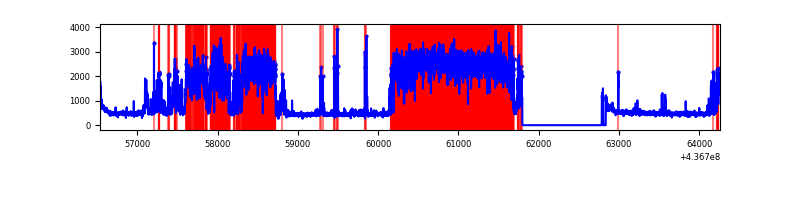 |
| D | 7722 | 6704 | 283 | 283 | 3.66% | 4.22% | 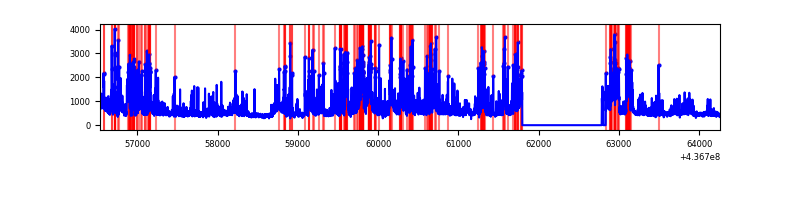 |
Top three noisy pixels from each quadrant. If the there are fewer than three noisy pixels in the level2.evt file, extra rows are filled as -1
| Pixel properties | Quadrant properties | ||||||
|---|---|---|---|---|---|---|---|
| Quadrant | DetID | PixID | Counts | Sigma | Mean | Median | Sigma |
| A | 10 | 83 | 1014426 | 6401.11 | 768 | 754 | 158.4 |
| A | 15 | 223 | 826510 | 5214.46 | 768 | 754 | 158.4 |
| A | 13 | 248 | 40640 | 251.87 | 768 | 754 | 158.4 |
| B | 5 | 235 | 144807 | 926.07 | 784 | 762 | 155.5 |
| B | 4 | 170 | 81403 | 518.45 | 784 | 762 | 155.5 |
| B | 0 | 183 | 47681 | 301.65 | 784 | 762 | 155.5 |
| C | 15 | 174 | 4984165 | 29872.83 | 710 | 714 | 166.8 |
| C | 15 | 190 | 162083 | 967.31 | 710 | 714 | 166.8 |
| C | 14 | 254 | 160253 | 956.34 | 710 | 714 | 166.8 |
| D | 12 | 33 | 1476281 | 7695.77 | 752 | 730 | 191.7 |
| D | 13 | 249 | 178619 | 927.78 | 752 | 730 | 191.7 |
| D | 12 | 233 | 126054 | 653.63 | 752 | 730 | 191.7 |
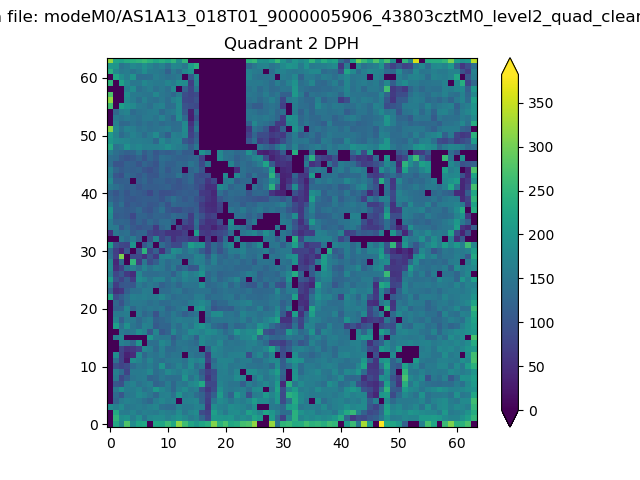
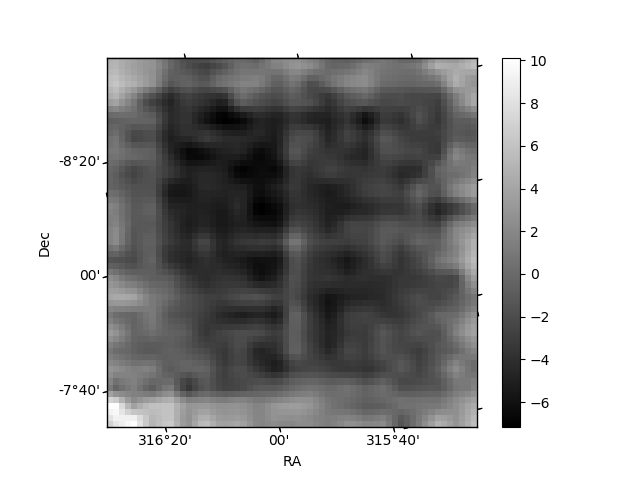
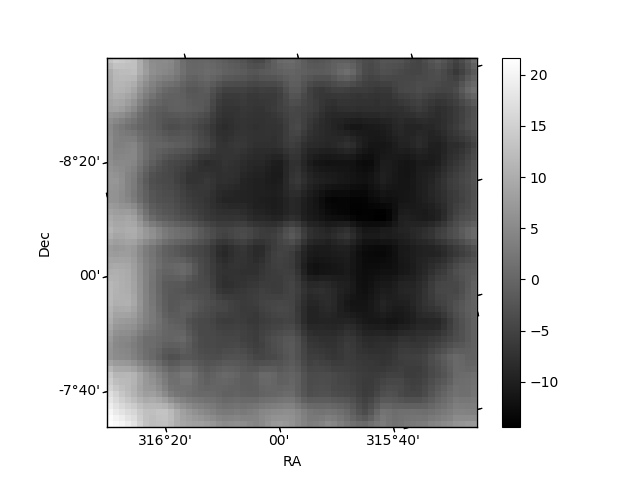
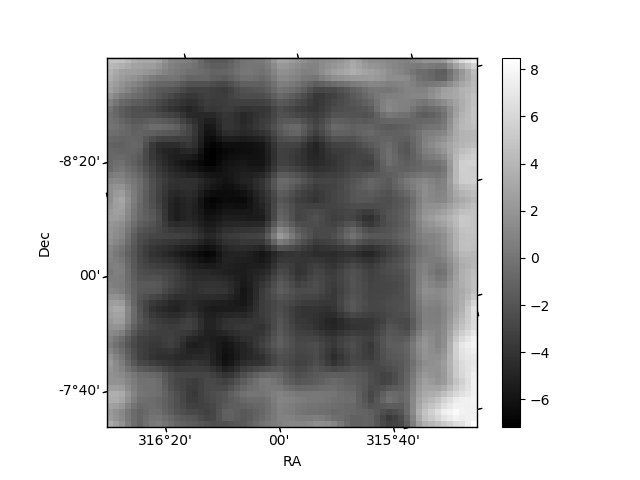
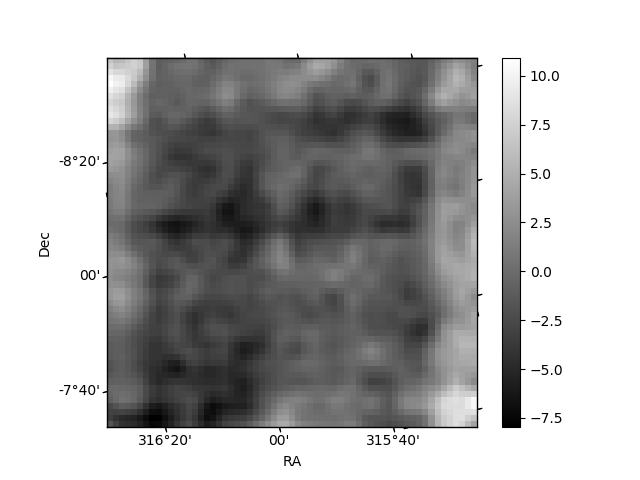
Histogram calculated using DETX and DETY for each event in the final _common_clean file
| Quadrant A | 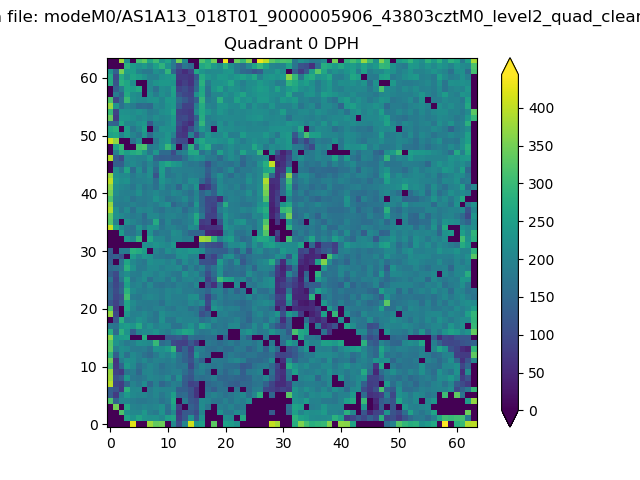 |
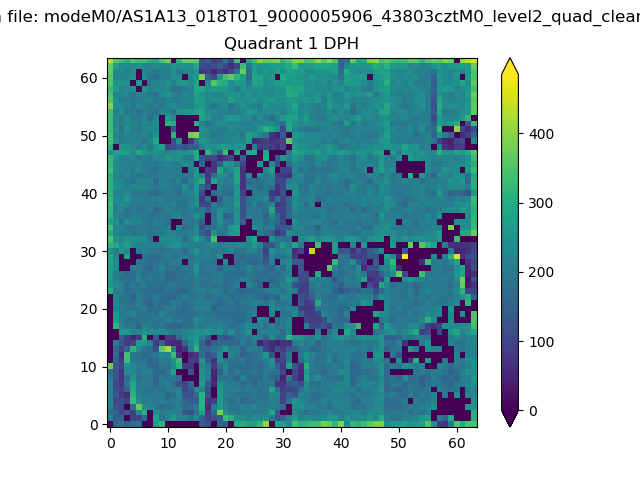 |
Quadrant B |
|---|---|---|---|
| Quadrant D | 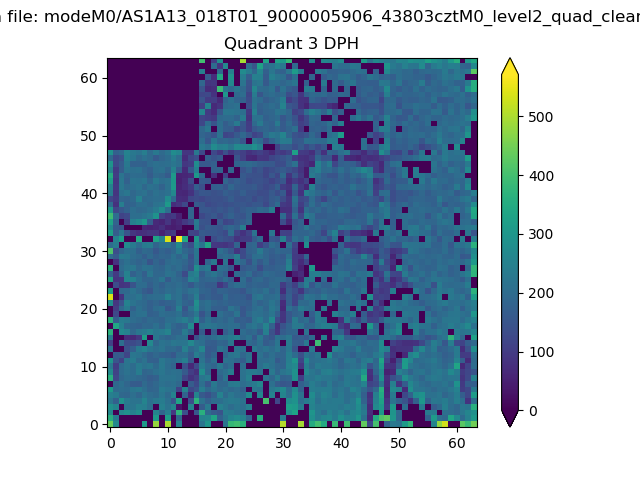 |
 |
Quadrant C |
| Plot type | Count rate plots | Images |
|---|---|---|
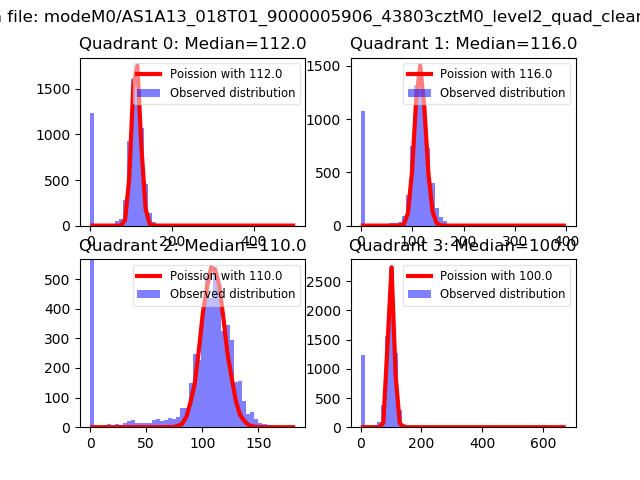
| Comparison with Poisson distribution Blue bars denote a histogram of data divided into 1 sec bins. Red curve is a Poisson curve with rate = median count rate of data. |
 |
 |
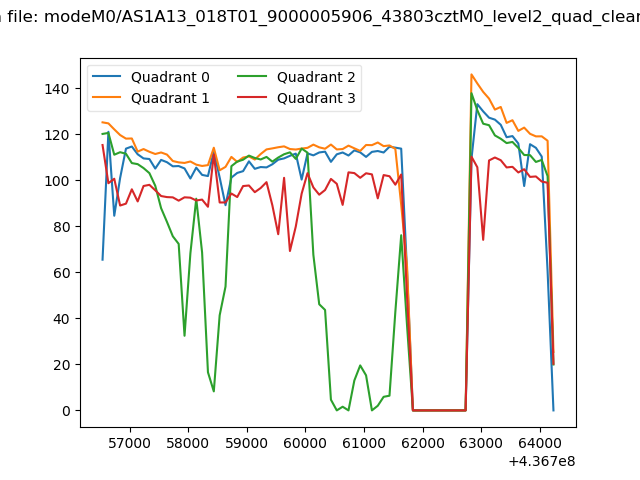
| Quadrant-wise count rates Data is divided into 100 sec bins |
 |
|
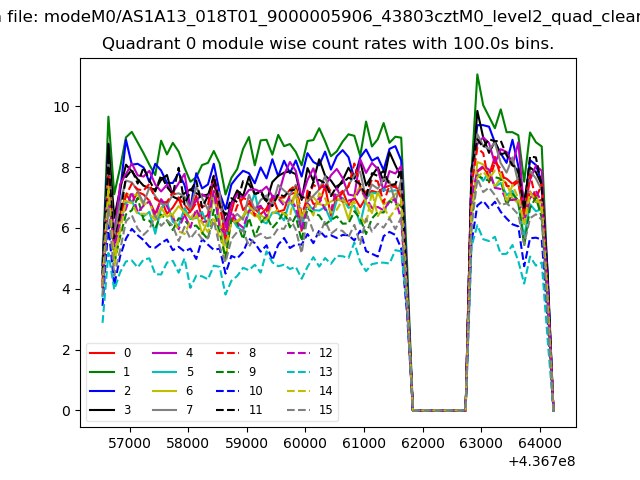
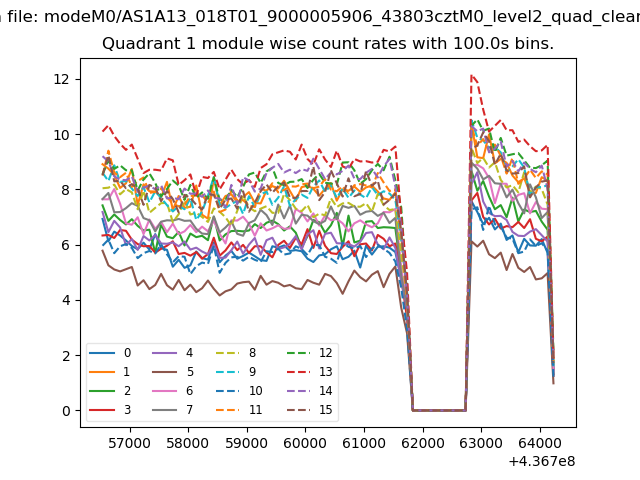
| Module-wise count rates for Quadrant A Data is divided into 100 sec bins |
 |
 |
| Module-wise count rates for Quadrant B Data is divided into 100 sec bins |
 |
 |
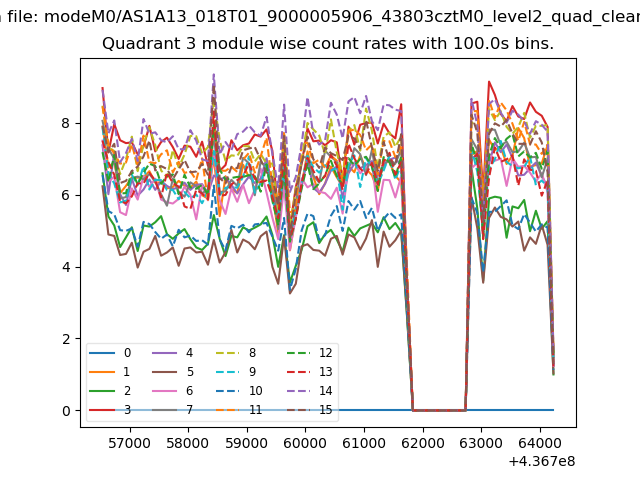
| Module-wise count rates for Quadrant C Data is divided into 100 sec bins |
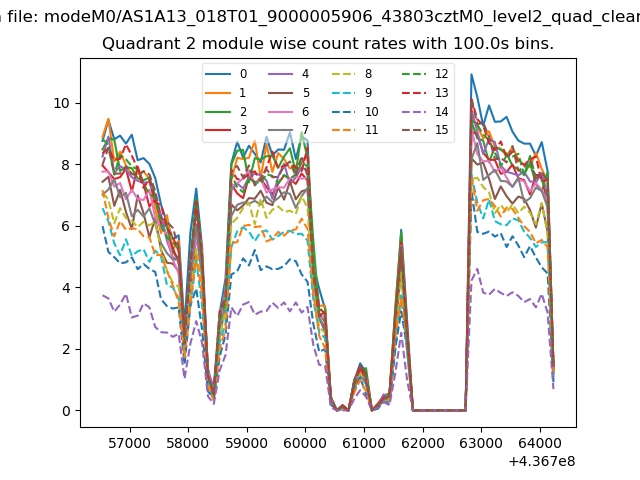 |
 |
| Module-wise count rates for Quadrant D Data is divided into 100 sec bins |
 |
 |
| Parameter | Plot |
|---|---|
| CZT HV Monitor | 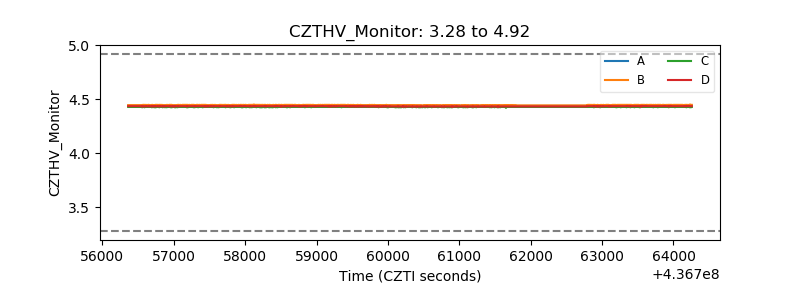 |
| D_VDD | 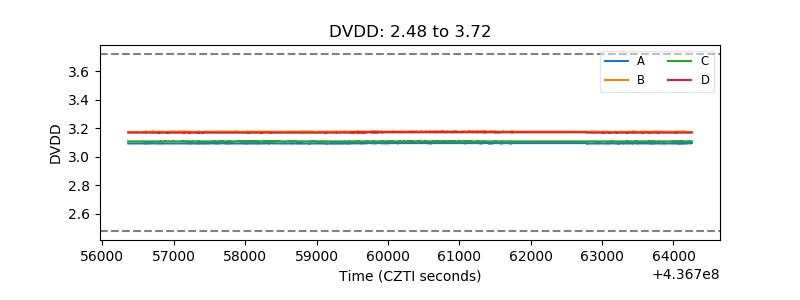 |
| Temperature 1 | 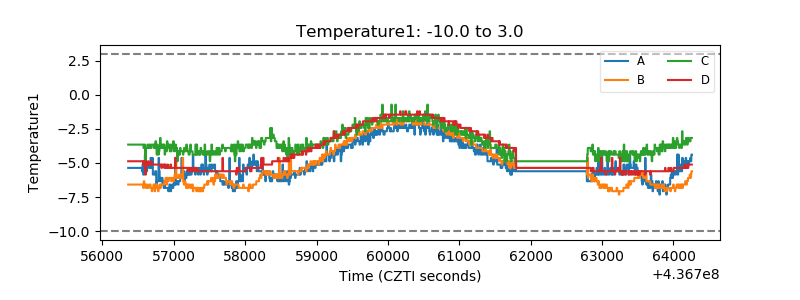 |
| Veto HV Monitor | 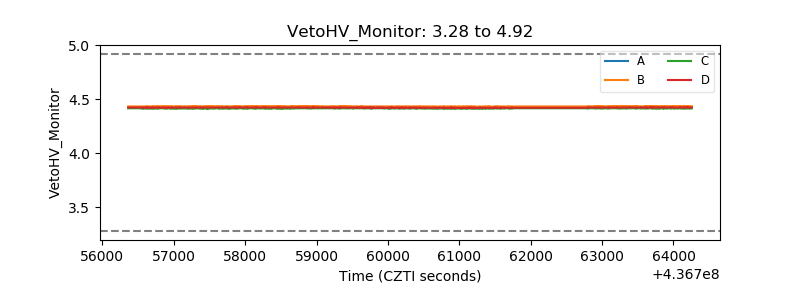 |
| Veto LLD | 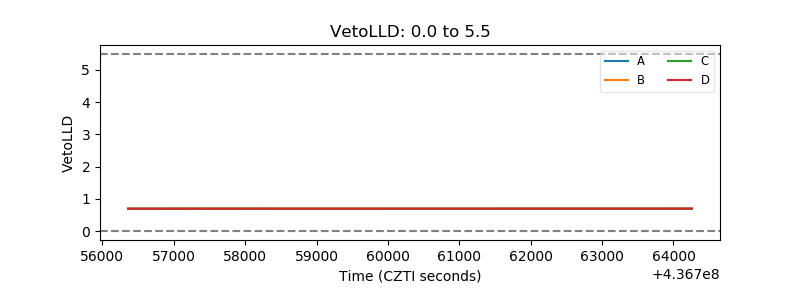 |
| Alpha Counter | 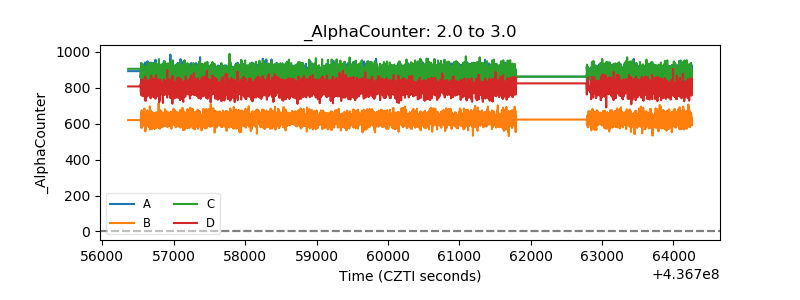 |
| _CPM_Rate | 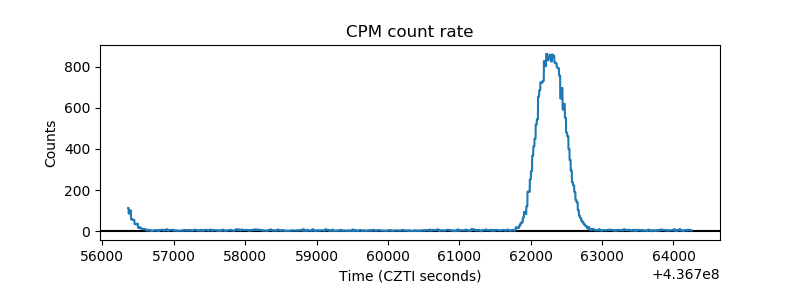 |
| CZT Counter | 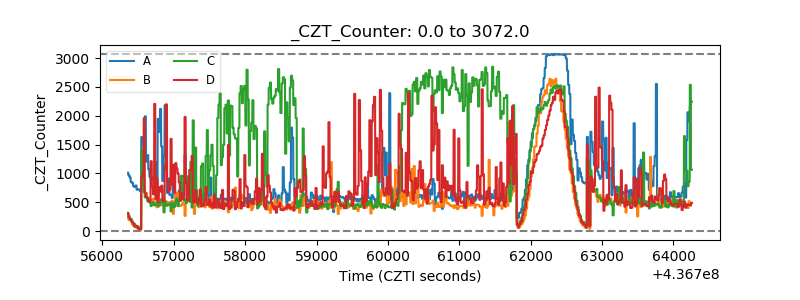 |
| +2.5 Volts monitor |  |
| +5 Volts monitor | 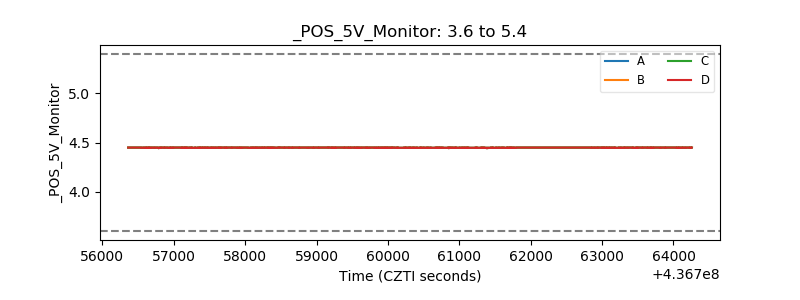 |
| _ROLL_ROT | 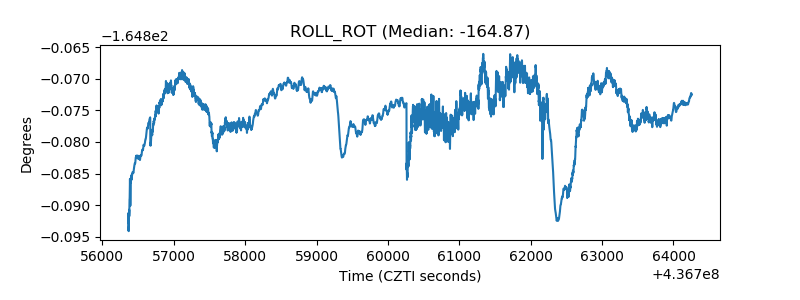 |
| _Roll_DEC | 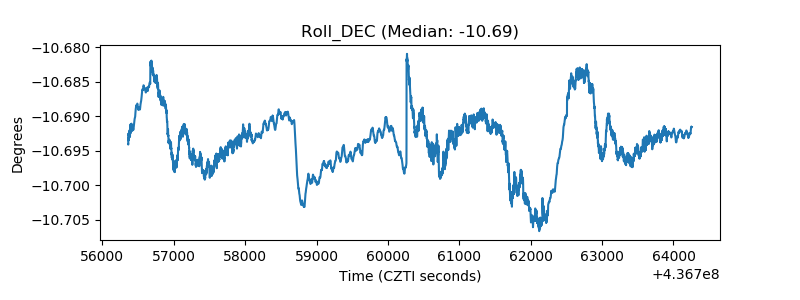 |
| _Roll_RA | 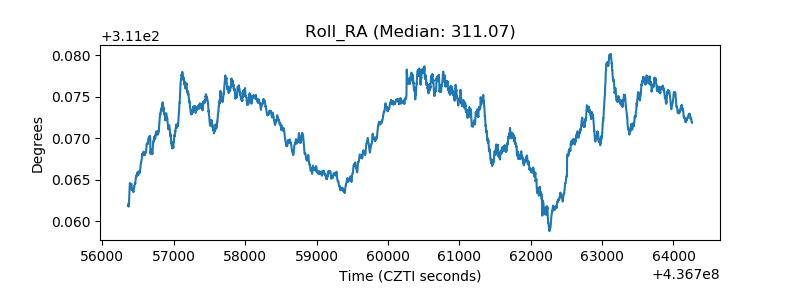 |
| Veto Counter | 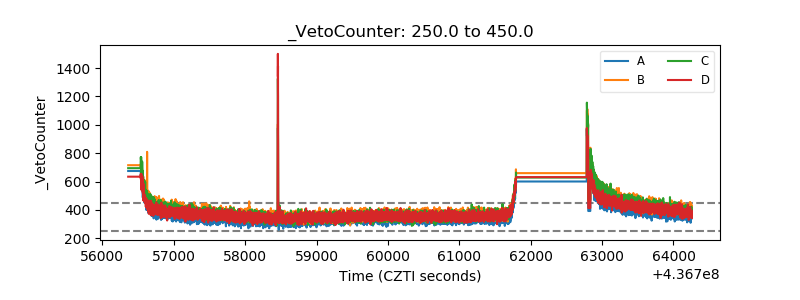 |