| Param | Original file | Final file |
|---|---|---|
| Filename | modeM0/AS1A13_018T01_9000005906_43805cztM0_level2.fits | modeM0/AS1A13_018T01_9000005906_43805cztM0_level2_quad_clean.evt |
| Size (bytes) | 620,824,320 | 102,248,640 |
| Size | 592.1 MB | 97.5 MB |
| Events in quadrant A | 5,757,230 | 677,113 |
| Events in quadrant B | 3,304,235 | 777,176 |
| Events in quadrant C | 8,090,427 | 572,737 |
| Events in quadrant D | 5,340,693 | 629,385 |
| Mode M0 | |||
|---|---|---|---|
| Quadrant | BADHDUFLAG | Total packets | Discarded packets |
| A | 0 | 21482 | 1 |
| B | 0 | 13730 | 1 |
| C | 0 | 28136 | 1 |
| D | 0 | 20097 | 1 |
| Mode SS | |||
|---|---|---|---|
| Quadrant | BADHDUFLAG | Total packets | Discarded packets |
| A | 0 | 128 | 0 |
| B | 0 | 128 | 0 |
| C | 0 | 128 | 0 |
| D | 0 | 128 | 0 |
| Mode M9 | |||
|---|---|---|---|
| Quadrant | BADHDUFLAG | Total packets | Discarded packets |
| A | 0 | 11 | 0 |
| B | 0 | 11 | 0 |
| C | 0 | 11 | 0 |
| D | 0 | 11 | 0 |
| Quadrant | Total seconds | Saturated seconds | Saturation percentage |
|---|---|---|---|
| A | 6301 | 719 | 11.410887% |
| B | 6301 | 91 | 1.444215% |
| C | 6302 | 1728 | 27.419867% |
| D | 6302 | 529 | 8.394161% |
Noise dominated data is calculated using 1-second bins in cleaned event files. If a bin has >2000 counts, and if more than 50% of those come from <1% of pixels, then it is considered to be noise-dominated and hence unusable.
| Quadrant | # 1 sec bins | Bins with >0 counts | Bins with >2000 counts | High rate bins dominated by noise | Noise dominated (total time) | Noise dominated (detector-on time) | Marked lightcurve |
|---|---|---|---|---|---|---|---|
| A | 7416 | 6302 | 500 | 500 | 6.74% | 7.93% | 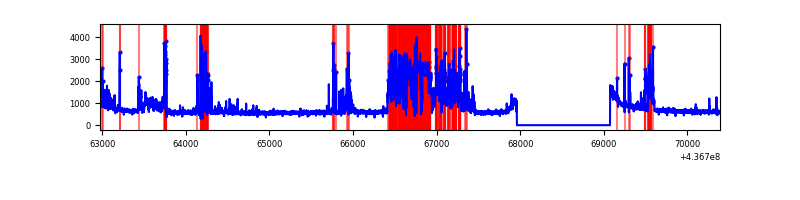 |
| B | 7416 | 6301 | 13 | 13 | 0.18% | 0.21% | 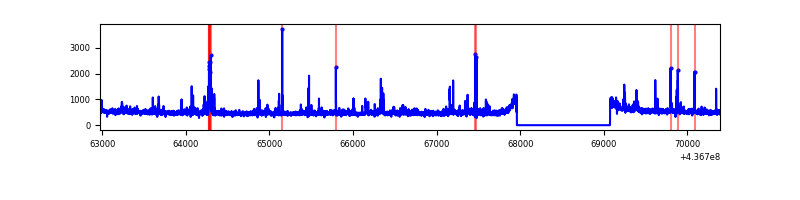 |
| C | 7417 | 6303 | 1700 | 1700 | 22.92% | 26.97% | 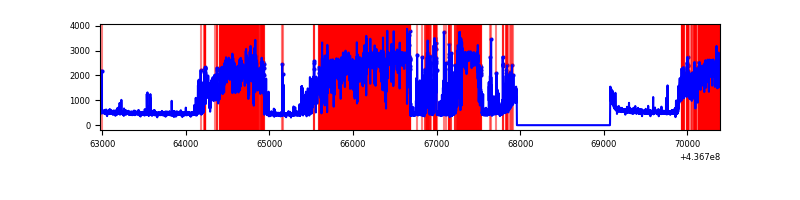 |
| D | 7417 | 6302 | 408 | 408 | 5.50% | 6.47% | 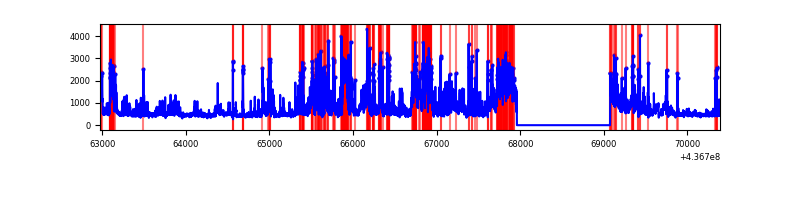 |
Top three noisy pixels from each quadrant. If the there are fewer than three noisy pixels in the level2.evt file, extra rows are filled as -1
| Pixel properties | Quadrant properties | ||||||
|---|---|---|---|---|---|---|---|
| Quadrant | DetID | PixID | Counts | Sigma | Mean | Median | Sigma |
| A | 15 | 223 | 1888335 | 12692.62 | 724 | 710 | 148.7 |
| A | 10 | 83 | 909789 | 6112.76 | 724 | 710 | 148.7 |
| A | 13 | 248 | 94012 | 627.37 | 724 | 710 | 148.7 |
| B | 5 | 172 | 60104 | 392.86 | 766 | 746 | 151.1 |
| B | 0 | 200 | 40493 | 263.07 | 766 | 746 | 151.1 |
| B | 5 | 235 | 36385 | 235.88 | 766 | 746 | 151.1 |
| C | 15 | 174 | 4883232 | 30362.04 | 684 | 687 | 160.8 |
| C | 15 | 190 | 231364 | 1434.46 | 684 | 687 | 160.8 |
| C | 15 | 158 | 156195 | 967.02 | 684 | 687 | 160.8 |
| D | 12 | 33 | 1199274 | 6586.45 | 726 | 706 | 182.0 |
| D | 12 | 233 | 222705 | 1219.94 | 726 | 706 | 182.0 |
| D | 1 | 52 | 221825 | 1215.11 | 726 | 706 | 182.0 |
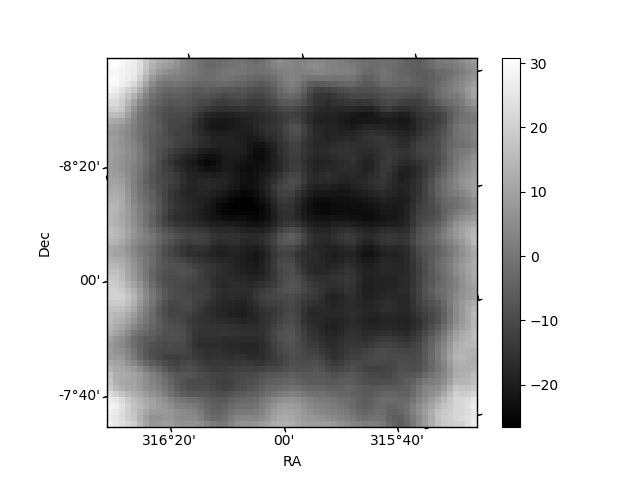
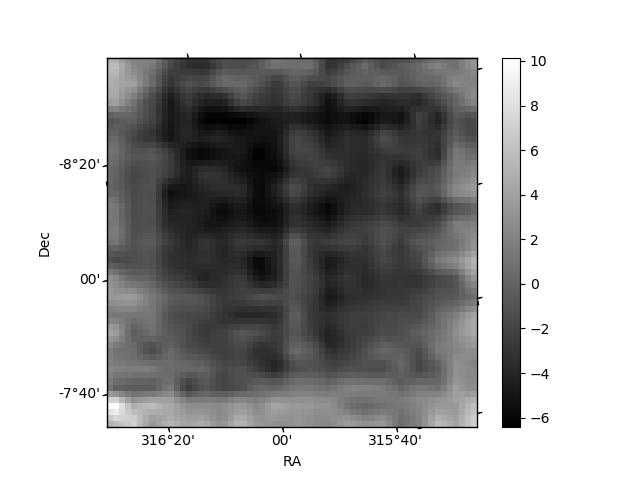
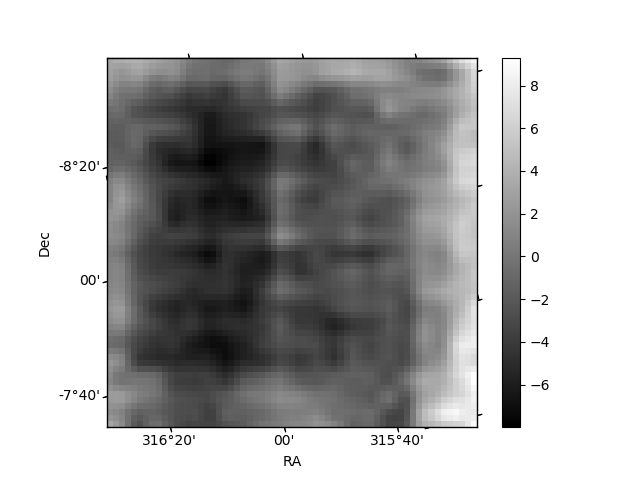
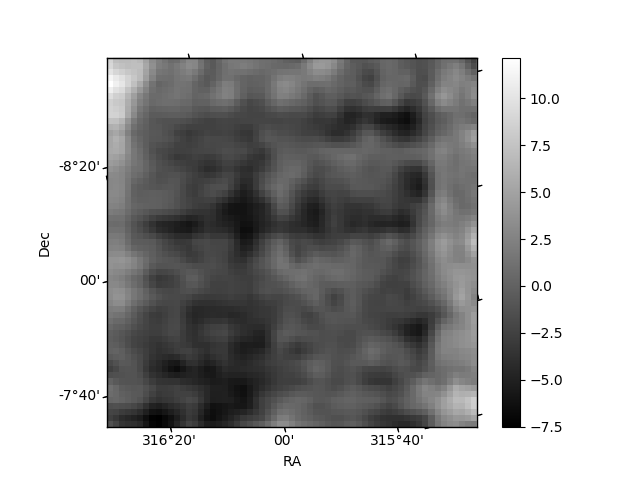
Histogram calculated using DETX and DETY for each event in the final _common_clean file
| Quadrant A | 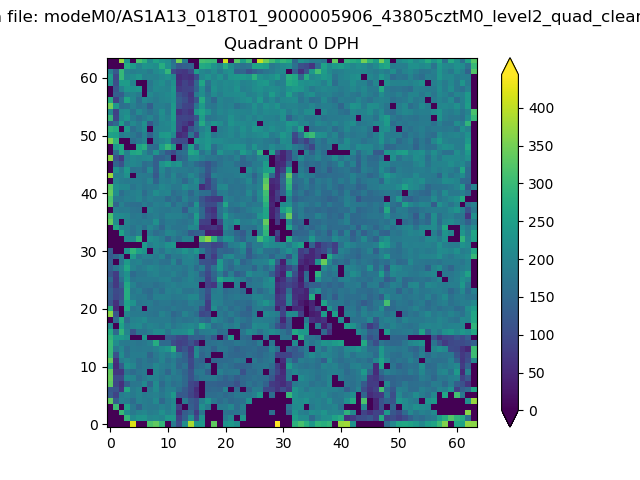 |
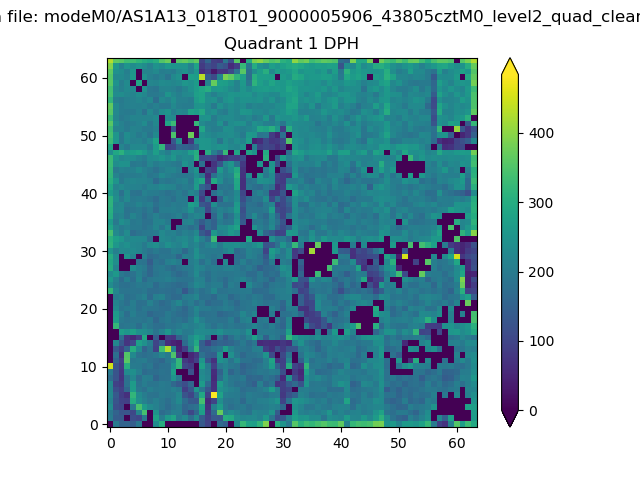 |
Quadrant B |
|---|---|---|---|
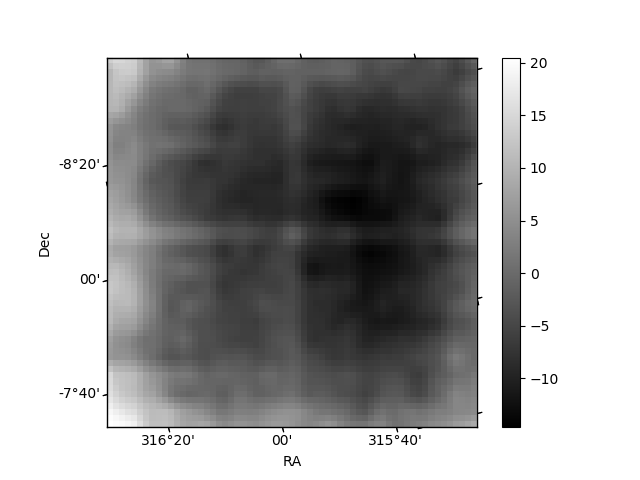
| Quadrant D | 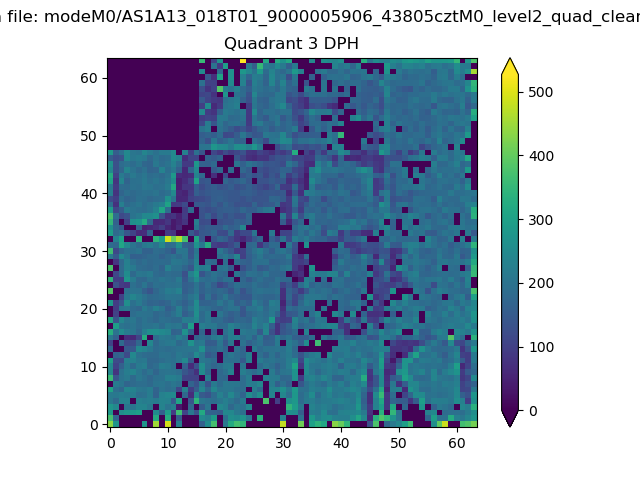 |
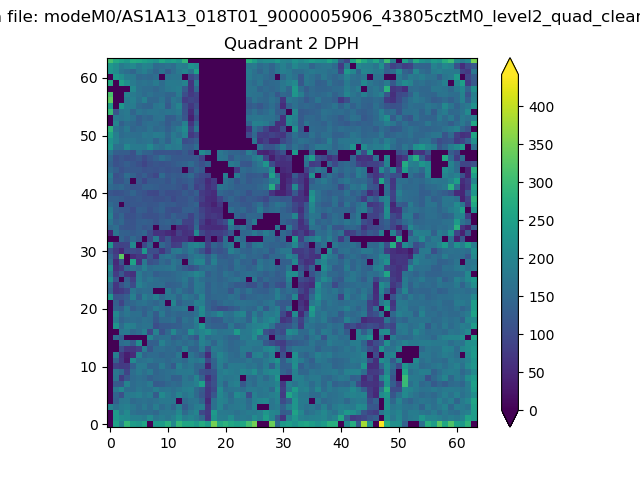 |
Quadrant C |
| Plot type | Count rate plots | Images |
|---|---|---|
| Comparison with Poisson distribution Blue bars denote a histogram of data divided into 1 sec bins. Red curve is a Poisson curve with rate = median count rate of data. |
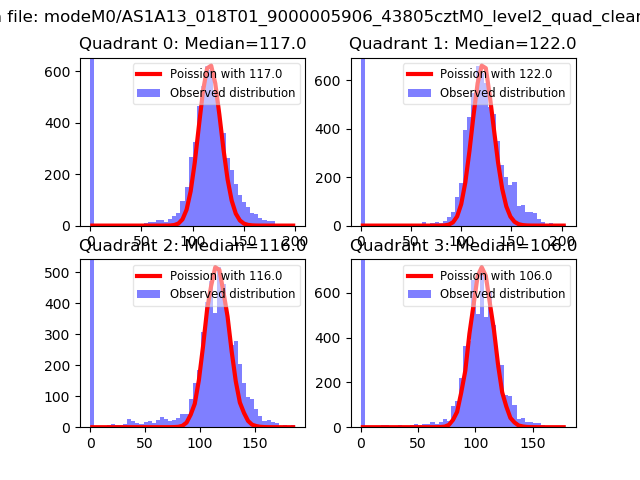 |
 |
| Quadrant-wise count rates Data is divided into 100 sec bins |
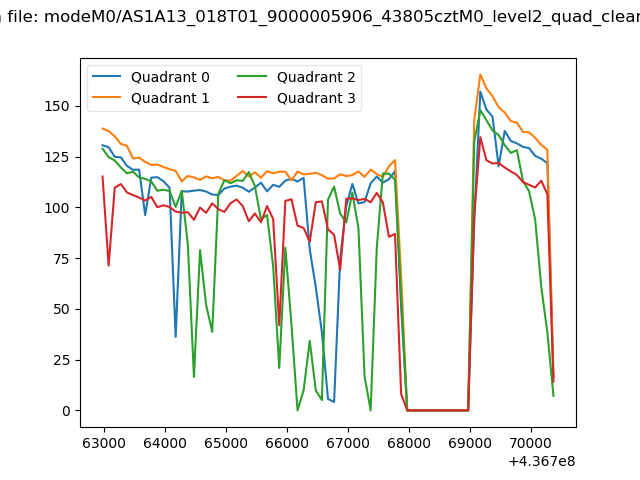 |
|
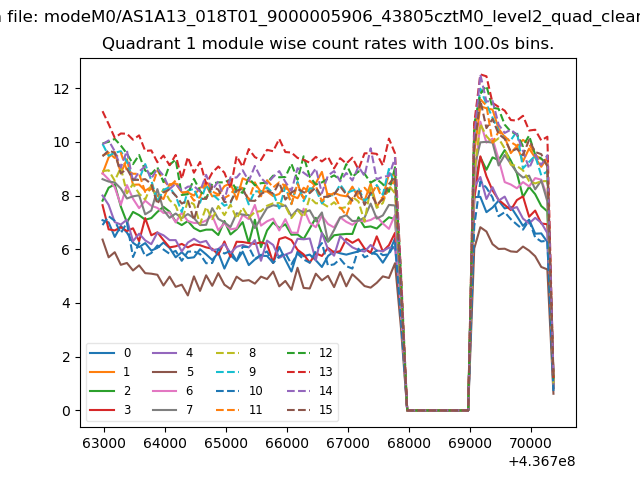
| Module-wise count rates for Quadrant A Data is divided into 100 sec bins |
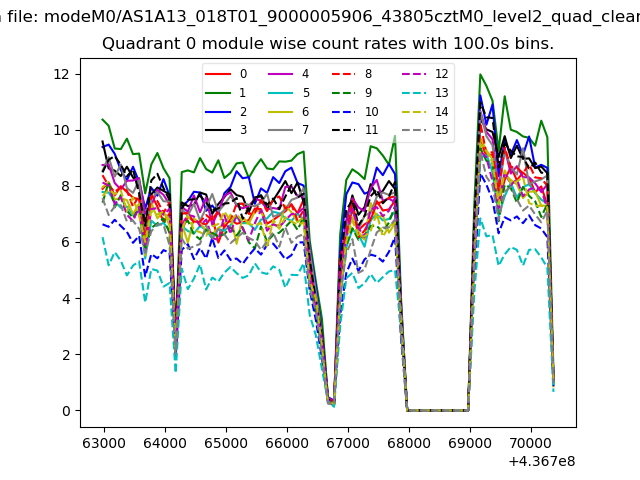 |
 |
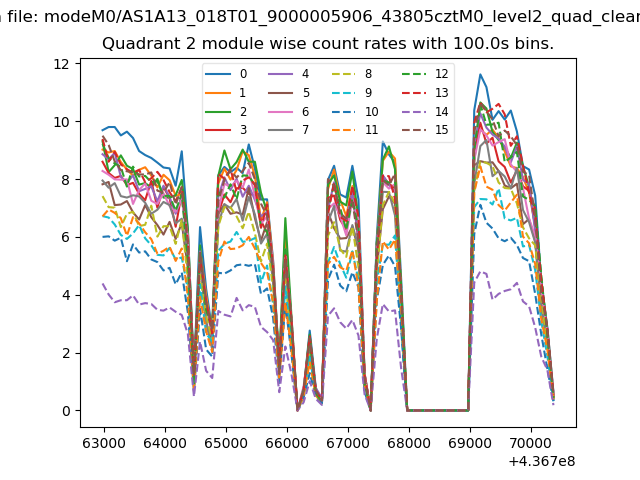
| Module-wise count rates for Quadrant B Data is divided into 100 sec bins |
 |
 |
| Module-wise count rates for Quadrant C Data is divided into 100 sec bins |
 |
 |
| Module-wise count rates for Quadrant D Data is divided into 100 sec bins |
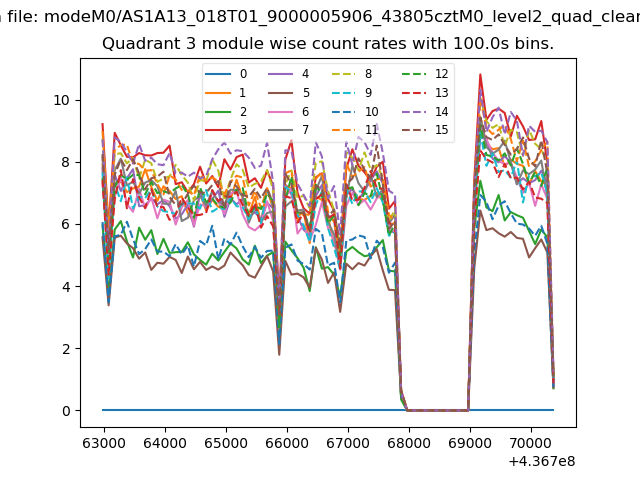 |
 |
| Parameter | Plot |
|---|---|
| CZT HV Monitor | 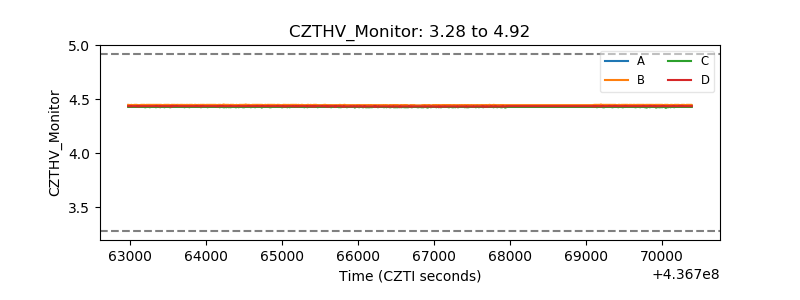 |
| D_VDD | 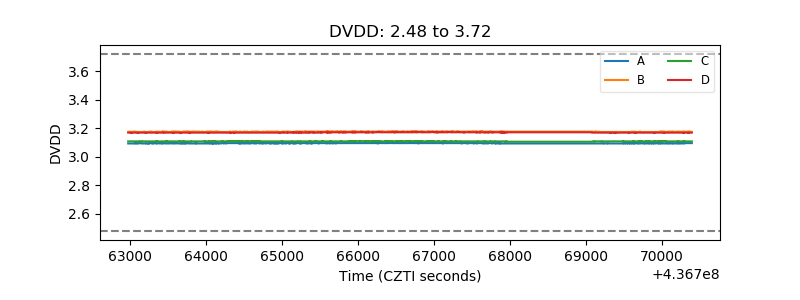 |
| Temperature 1 | 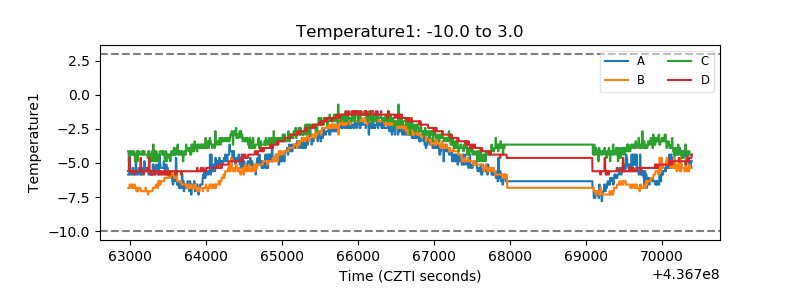 |
| Veto HV Monitor |  |
| Veto LLD | 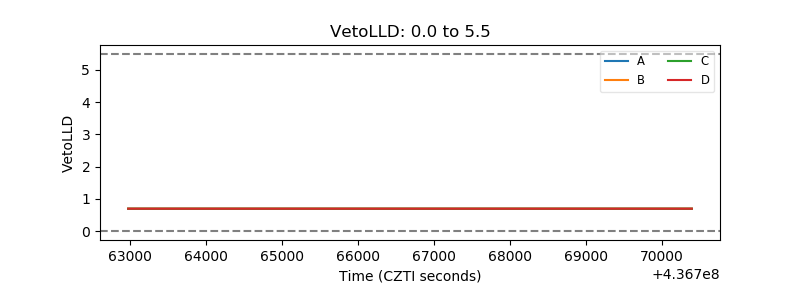 |
| Alpha Counter | 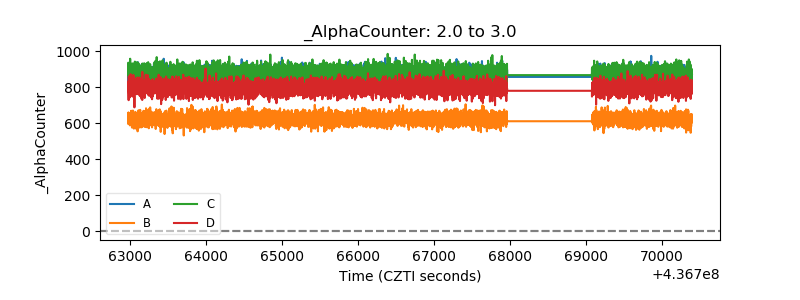 |
| _CPM_Rate | 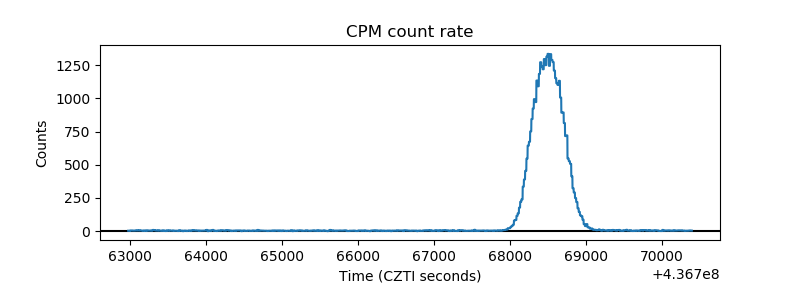 |
| CZT Counter | 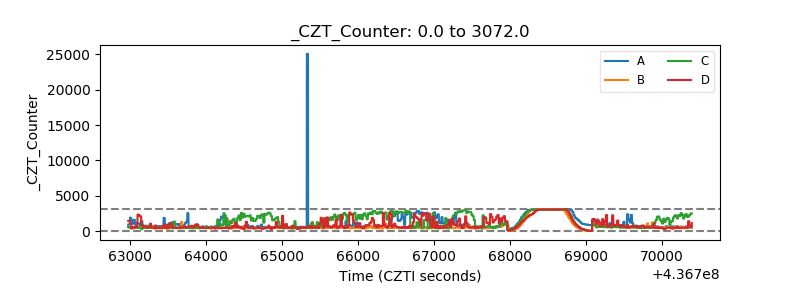 |
| +2.5 Volts monitor | 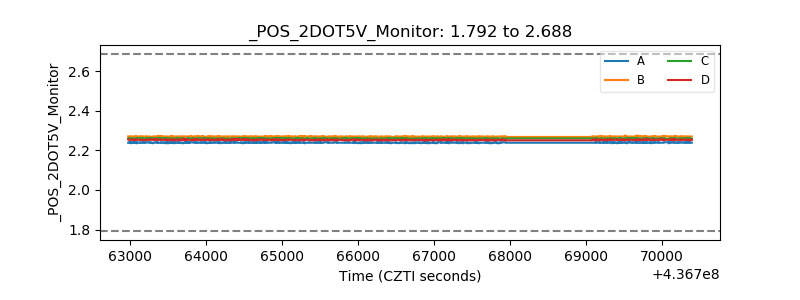 |
| +5 Volts monitor | 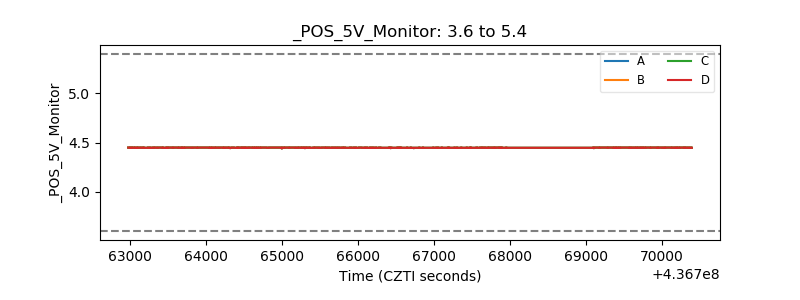 |
| _ROLL_ROT | 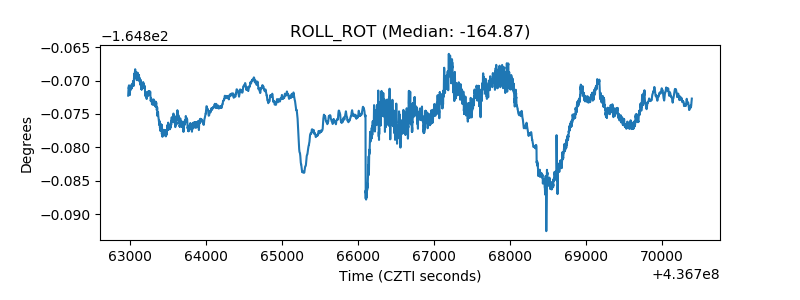 |
| _Roll_DEC | 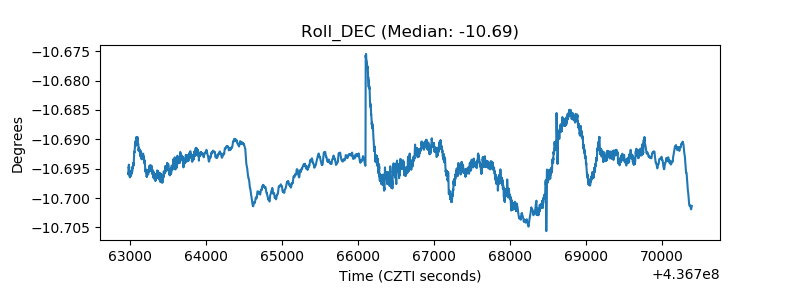 |
| _Roll_RA | 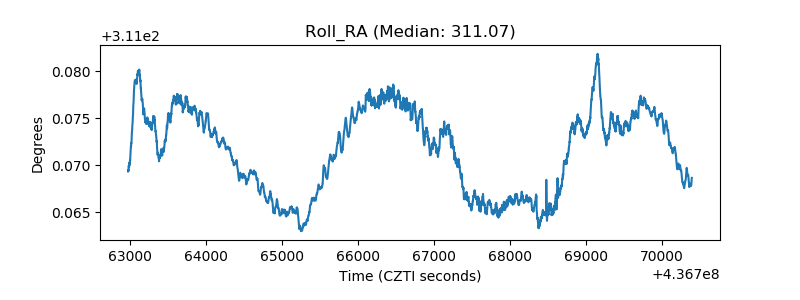 |
| Veto Counter | 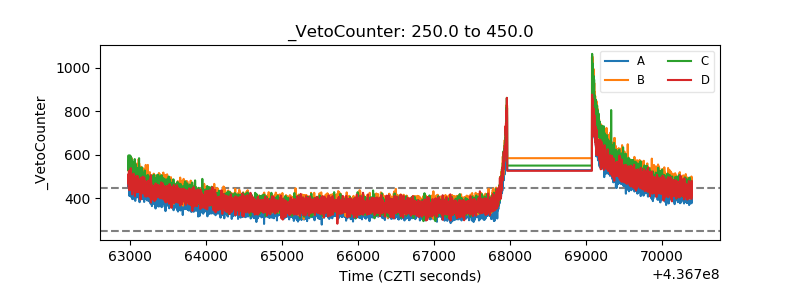 |