| Param | Original file | Final file |
|---|---|---|
| Filename | modeM0/AS1A13_018T01_9000005906_43806cztM0_level2.fits | modeM0/AS1A13_018T01_9000005906_43806cztM0_level2_quad_clean.evt |
| Size (bytes) | 664,329,600 | 105,503,040 |
| Size | 633.6 MB | 100.6 MB |
| Events in quadrant A | 5,186,139 | 748,365 |
| Events in quadrant B | 3,512,312 | 812,000 |
| Events in quadrant C | 8,745,234 | 590,256 |
| Events in quadrant D | 6,666,481 | 610,158 |
| Mode M0 | |||
|---|---|---|---|
| Quadrant | BADHDUFLAG | Total packets | Discarded packets |
| A | 0 | 19959 | 1 |
| B | 0 | 14277 | 1 |
| C | 0 | 30146 | 1 |
| D | 0 | 24003 | 2 |
| Mode SS | |||
|---|---|---|---|
| Quadrant | BADHDUFLAG | Total packets | Discarded packets |
| A | 0 | 126 | 0 |
| B | 0 | 126 | 0 |
| C | 0 | 126 | 0 |
| D | 0 | 126 | 0 |
| Mode M9 | |||
|---|---|---|---|
| Quadrant | BADHDUFLAG | Total packets | Discarded packets |
| A | 0 | 12 | 0 |
| B | 0 | 12 | 0 |
| C | 0 | 12 | 0 |
| D | 0 | 12 | 0 |
| Quadrant | Total seconds | Saturated seconds | Saturation percentage |
|---|---|---|---|
| A | 6213 | 485 | 7.806213% |
| B | 6214 | 140 | 2.252977% |
| C | 6214 | 1867 | 30.045060% |
| D | 6213 | 1027 | 16.529857% |
Noise dominated data is calculated using 1-second bins in cleaned event files. If a bin has >2000 counts, and if more than 50% of those come from <1% of pixels, then it is considered to be noise-dominated and hence unusable.
| Quadrant | # 1 sec bins | Bins with >0 counts | Bins with >2000 counts | High rate bins dominated by noise | Noise dominated (total time) | Noise dominated (detector-on time) | Marked lightcurve |
|---|---|---|---|---|---|---|---|
| A | 7398 | 6213 | 240 | 240 | 3.24% | 3.86% | 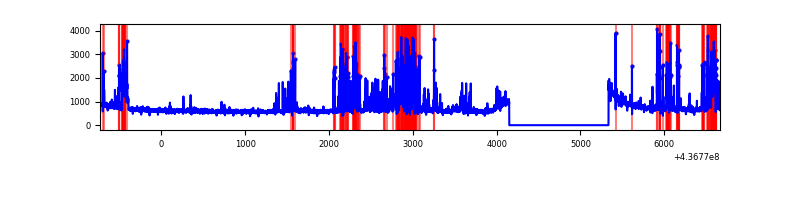 |
| B | 7399 | 6214 | 24 | 24 | 0.32% | 0.39% | 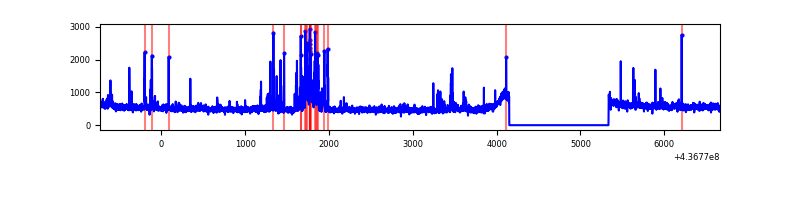 |
| C | 7399 | 6214 | 1632 | 1632 | 22.06% | 26.26% |  |
| D | 7398 | 6213 | 903 | 903 | 12.21% | 14.53% | 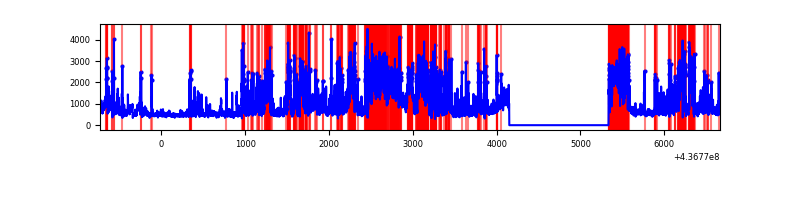 |
Top three noisy pixels from each quadrant. If the there are fewer than three noisy pixels in the level2.evt file, extra rows are filled as -1
| Pixel properties | Quadrant properties | ||||||
|---|---|---|---|---|---|---|---|
| Quadrant | DetID | PixID | Counts | Sigma | Mean | Median | Sigma |
| A | 10 | 83 | 923356 | 5747.6 | 775 | 761 | 160.5 |
| A | 13 | 248 | 664693 | 4136.18 | 775 | 761 | 160.5 |
| A | 15 | 223 | 469937 | 2922.88 | 775 | 761 | 160.5 |
| B | 0 | 200 | 252913 | 1642.63 | 788 | 766 | 153.5 |
| B | 0 | 183 | 34823 | 221.87 | 788 | 766 | 153.5 |
| B | 1 | 207 | 21467 | 134.86 | 788 | 766 | 153.5 |
| C | 15 | 174 | 5176044 | 31807.52 | 700 | 705 | 162.7 |
| C | 15 | 190 | 420149 | 2577.89 | 700 | 705 | 162.7 |
| C | 15 | 158 | 176257 | 1078.94 | 700 | 705 | 162.7 |
| D | 12 | 33 | 2102650 | 11560.41 | 724 | 705 | 181.8 |
| D | 1 | 52 | 419094 | 2301.08 | 724 | 705 | 181.8 |
| D | 5 | 222 | 318741 | 1749.15 | 724 | 705 | 181.8 |
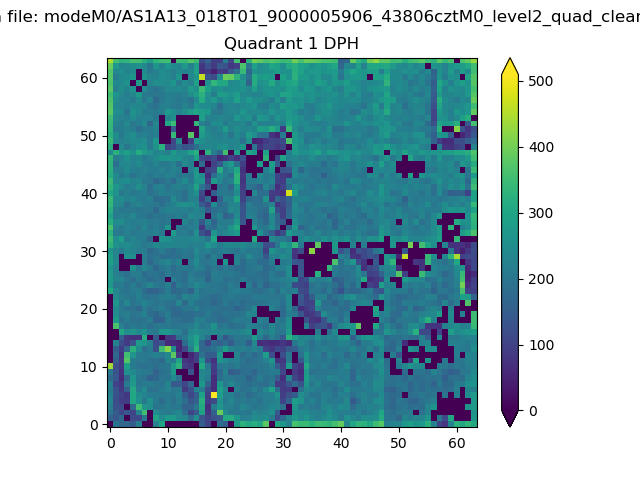
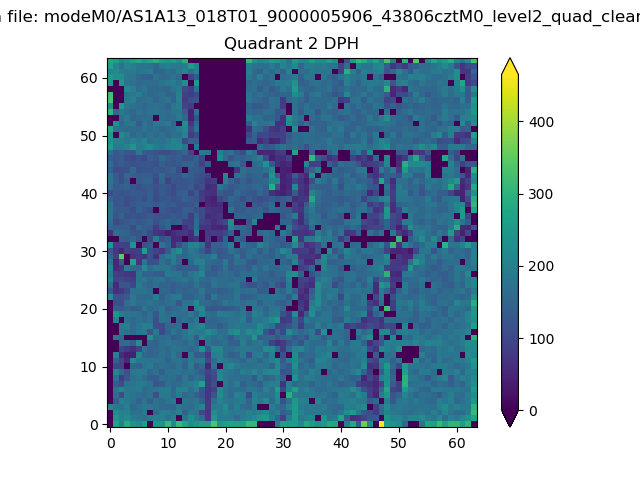
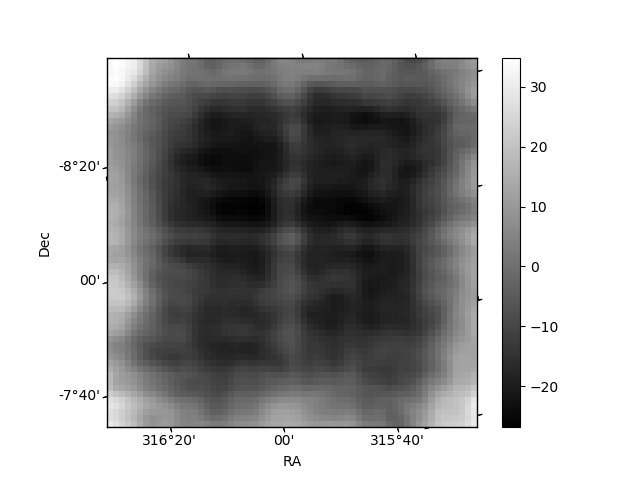
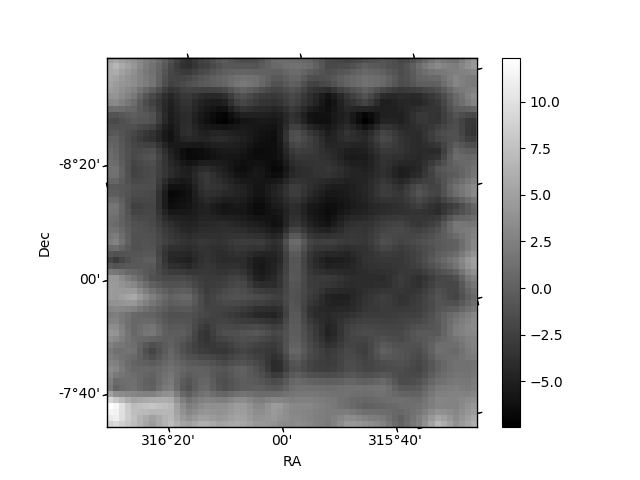
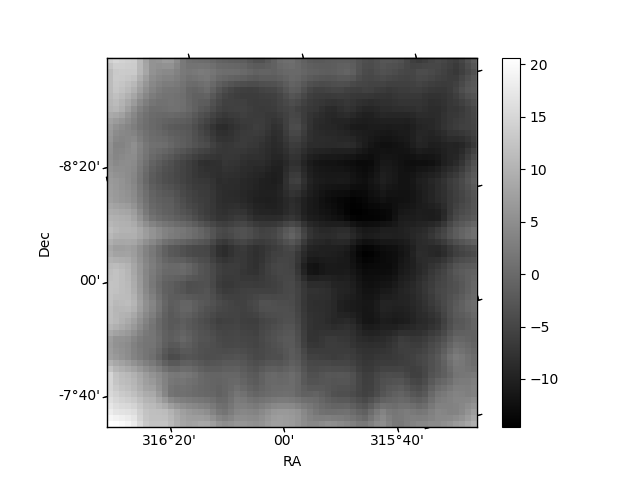
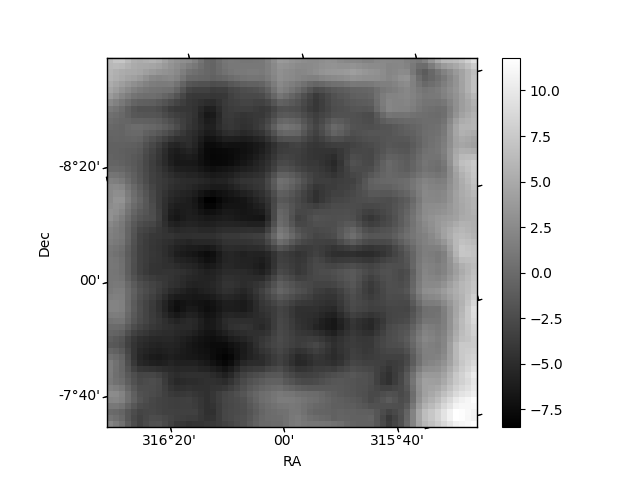
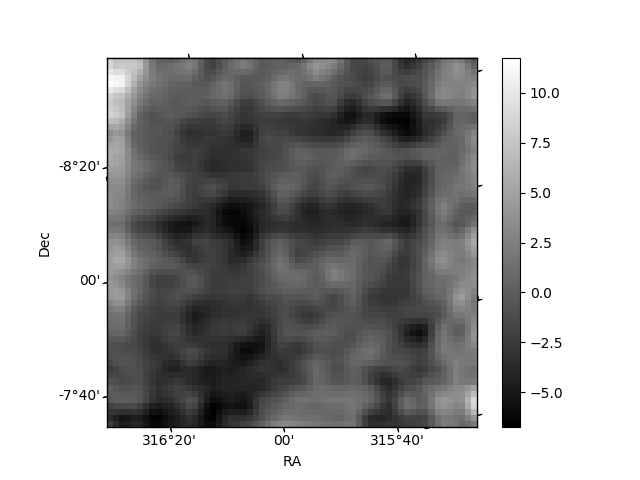
Histogram calculated using DETX and DETY for each event in the final _common_clean file
| Quadrant A | 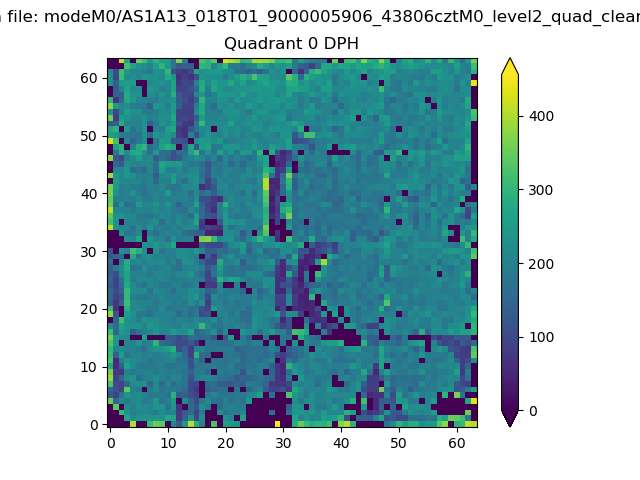 |
 |
Quadrant B |
|---|---|---|---|
| Quadrant D | 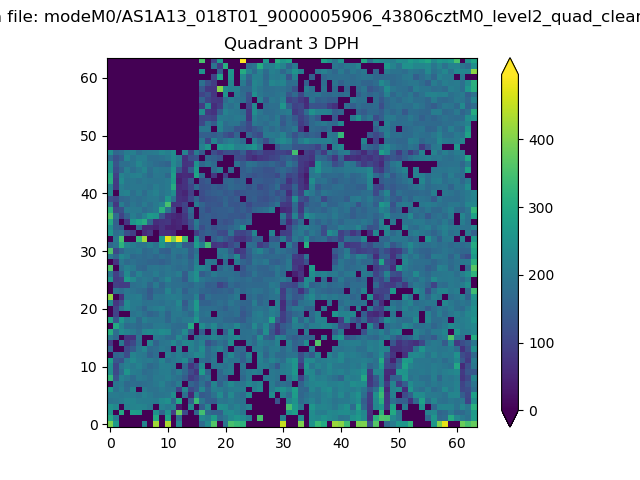 |
 |
Quadrant C |
| Plot type | Count rate plots | Images |
|---|---|---|
| Comparison with Poisson distribution Blue bars denote a histogram of data divided into 1 sec bins. Red curve is a Poisson curve with rate = median count rate of data. |
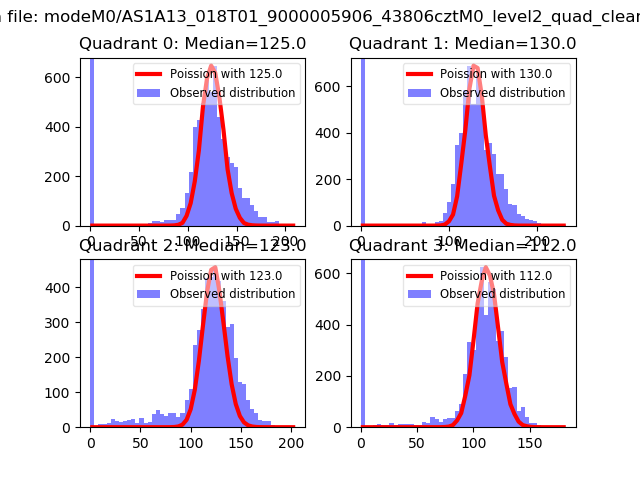 |
 |
| Quadrant-wise count rates Data is divided into 100 sec bins |
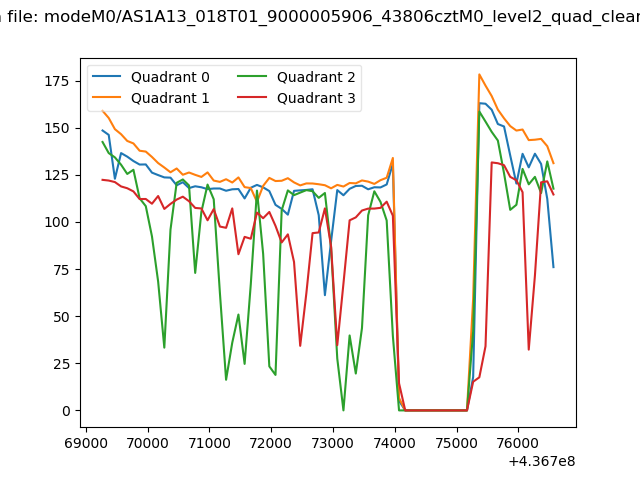 |
|
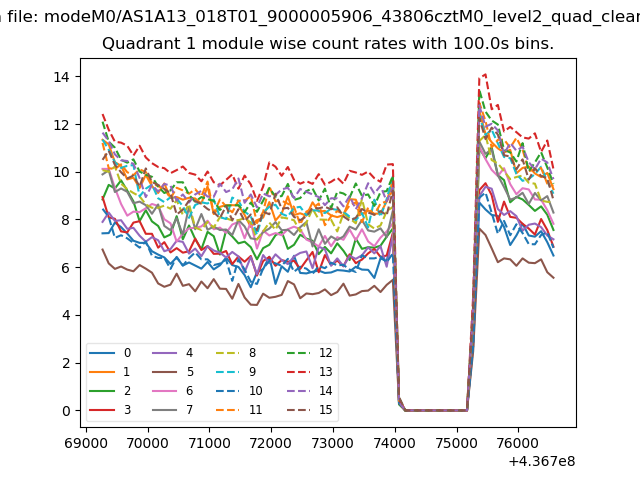
| Module-wise count rates for Quadrant A Data is divided into 100 sec bins |
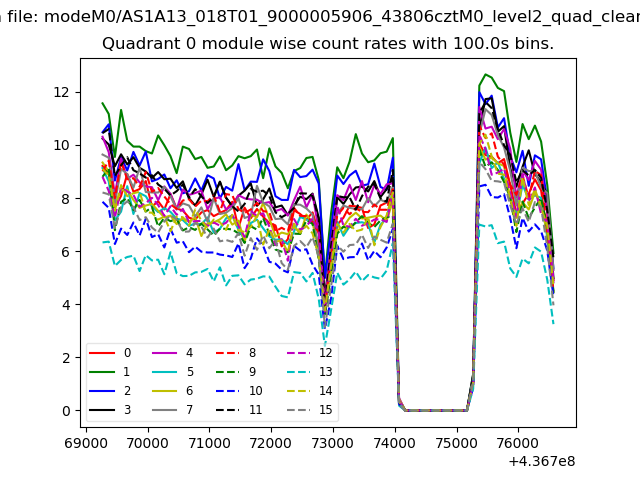 |
 |
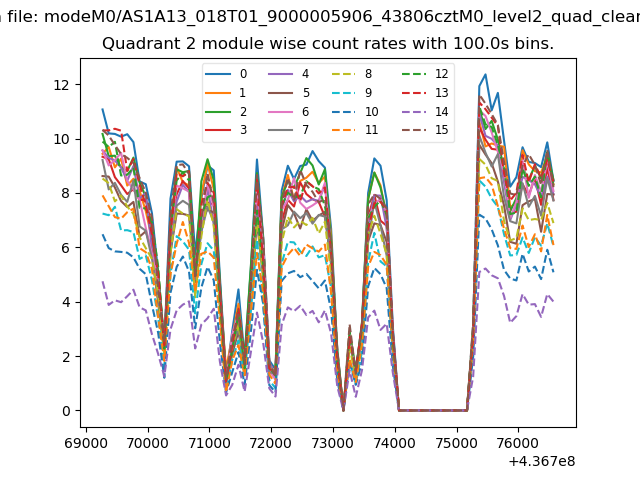
| Module-wise count rates for Quadrant B Data is divided into 100 sec bins |
 |
 |
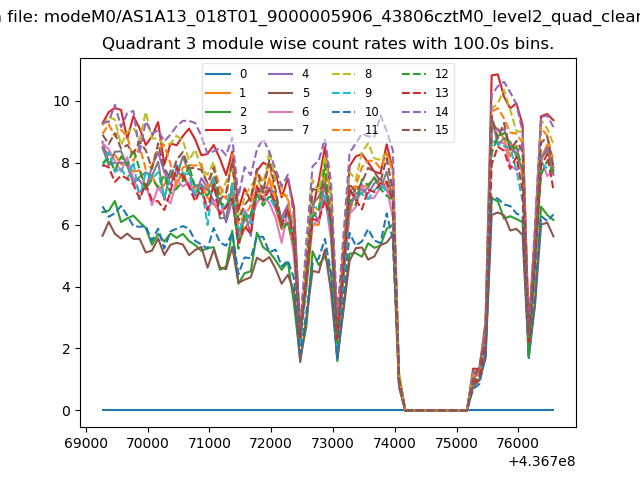
| Module-wise count rates for Quadrant C Data is divided into 100 sec bins |
 |
 |
| Module-wise count rates for Quadrant D Data is divided into 100 sec bins |
 |
 |
| Parameter | Plot |
|---|---|
| CZT HV Monitor | 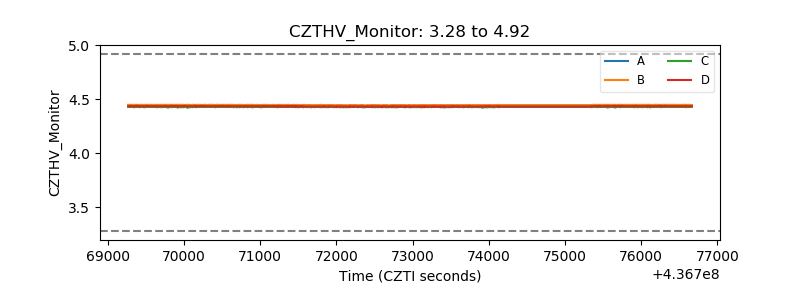 |
| D_VDD | 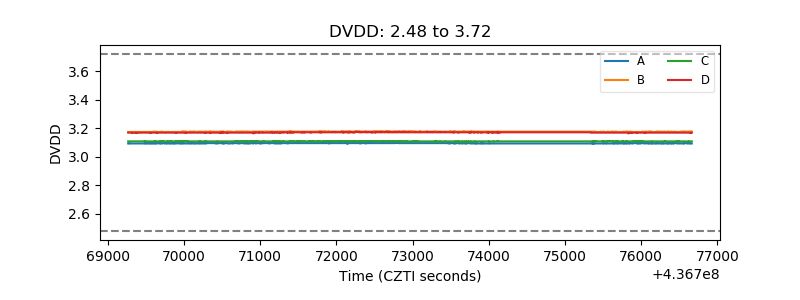 |
| Temperature 1 | 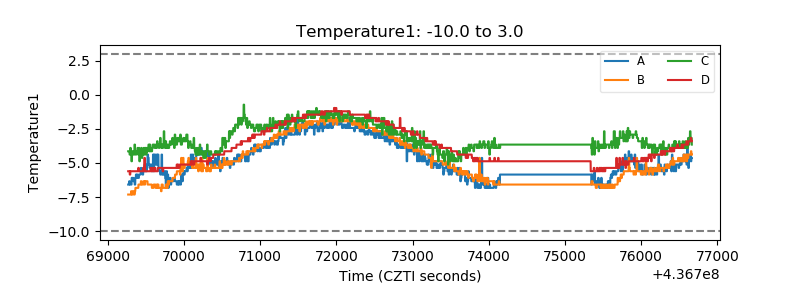 |
| Veto HV Monitor | 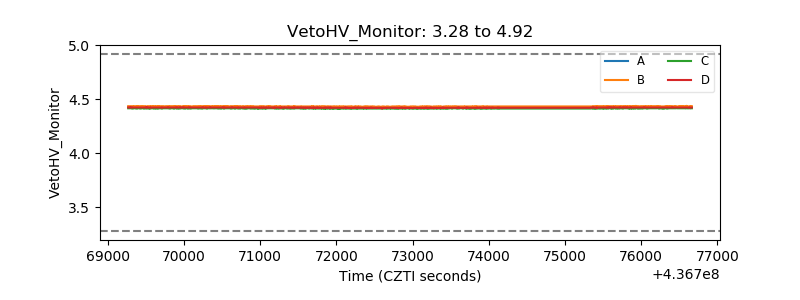 |
| Veto LLD | 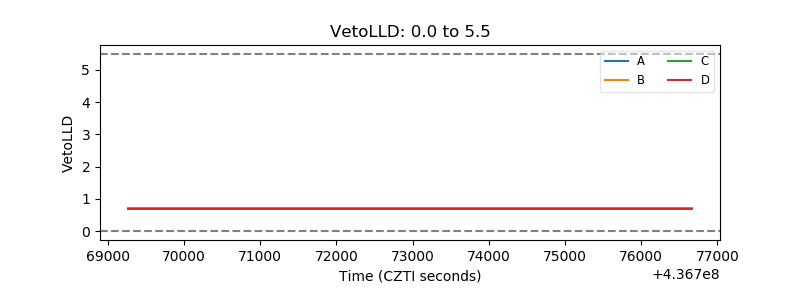 |
| Alpha Counter | 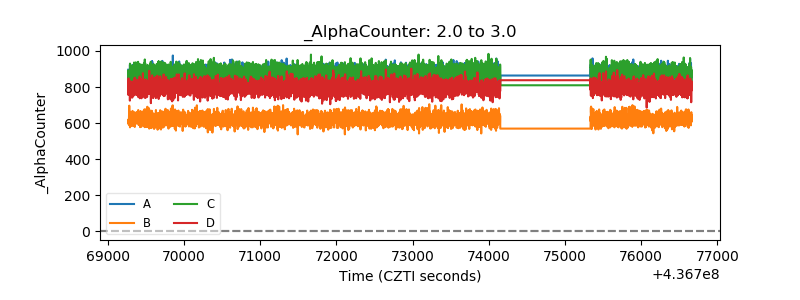 |
| _CPM_Rate | 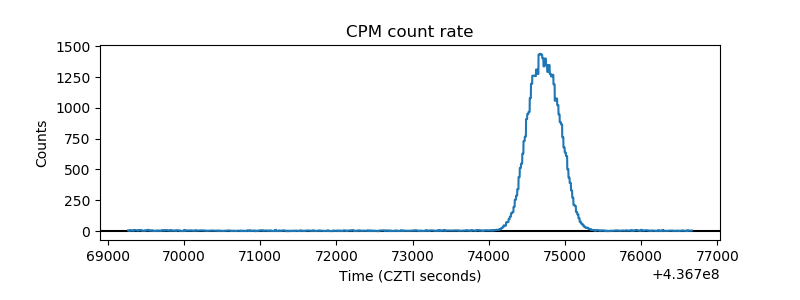 |
| CZT Counter | 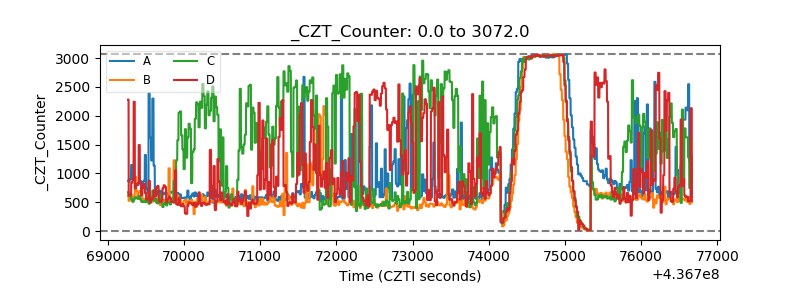 |
| +2.5 Volts monitor | 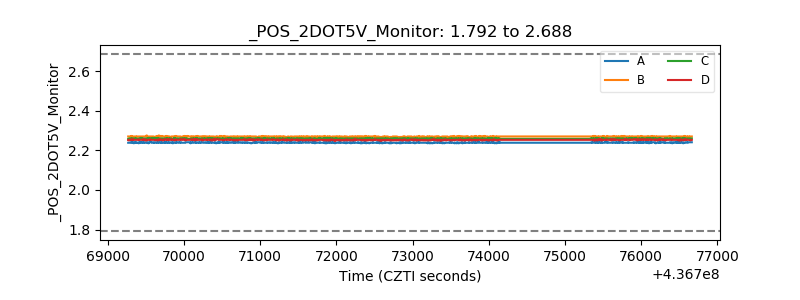 |
| +5 Volts monitor | 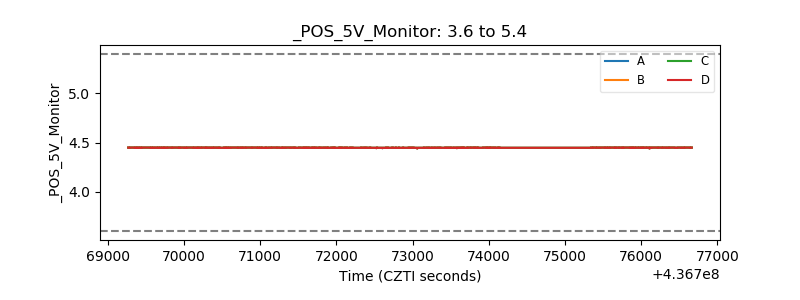 |
| _ROLL_ROT | 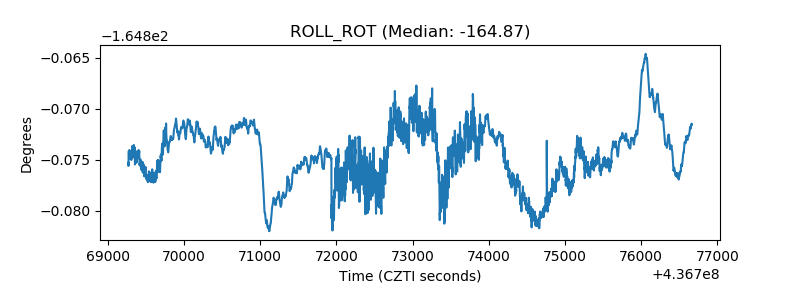 |
| _Roll_DEC | 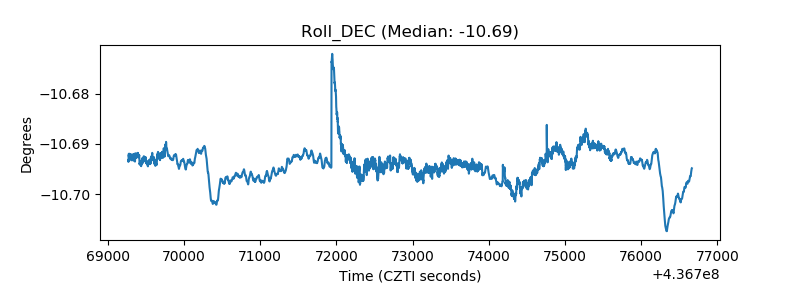 |
| _Roll_RA | 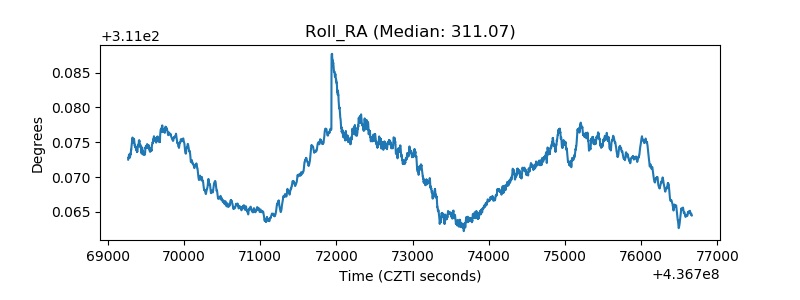 |
| Veto Counter | 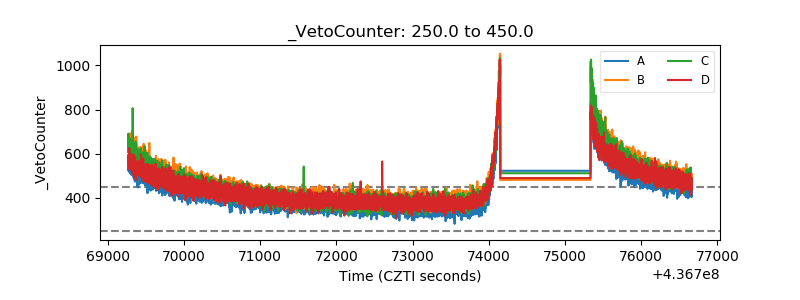 |