| Param | Original file | Final file |
|---|---|---|
| Filename | modeM0/AS1A13_018T01_9000005906_43807cztM0_level2.fits | modeM0/AS1A13_018T01_9000005906_43807cztM0_level2_quad_clean.evt |
| Size (bytes) | 691,240,320 | 109,575,360 |
| Size | 659.2 MB | 104.5 MB |
| Events in quadrant A | 5,695,696 | 755,403 |
| Events in quadrant B | 3,487,711 | 867,192 |
| Events in quadrant C | 8,487,714 | 626,529 |
| Events in quadrant D | 7,421,530 | 623,352 |
| Mode M0 | |||
|---|---|---|---|
| Quadrant | BADHDUFLAG | Total packets | Discarded packets |
| A | 0 | 21729 | 4 |
| B | 0 | 14266 | 2 |
| C | 0 | 29533 | 2 |
| D | 0 | 26434 | 2 |
| Mode SS | |||
|---|---|---|---|
| Quadrant | BADHDUFLAG | Total packets | Discarded packets |
| A | 0 | 130 | 0 |
| B | 0 | 130 | 0 |
| C | 0 | 130 | 0 |
| D | 0 | 130 | 0 |
| Mode M9 | |||
|---|---|---|---|
| Quadrant | BADHDUFLAG | Total packets | Discarded packets |
| A | 0 | 13 | 0 |
| B | 0 | 13 | 0 |
| C | 0 | 13 | 0 |
| D | 0 | 13 | 0 |
| Quadrant | Total seconds | Saturated seconds | Saturation percentage |
|---|---|---|---|
| A | 6386 | 771 | 12.073285% |
| B | 6387 | 122 | 1.910130% |
| C | 6387 | 1894 | 29.653985% |
| D | 6387 | 1284 | 20.103335% |
Noise dominated data is calculated using 1-second bins in cleaned event files. If a bin has >2000 counts, and if more than 50% of those come from <1% of pixels, then it is considered to be noise-dominated and hence unusable.
| Quadrant | # 1 sec bins | Bins with >0 counts | Bins with >2000 counts | High rate bins dominated by noise | Noise dominated (total time) | Noise dominated (detector-on time) | Marked lightcurve |
|---|---|---|---|---|---|---|---|
| A | 7616 | 6386 | 319 | 319 | 4.19% | 5.00% | 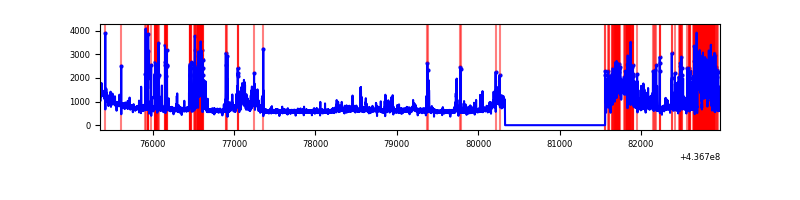 |
| B | 7617 | 6387 | 3 | 3 | 0.04% | 0.05% | 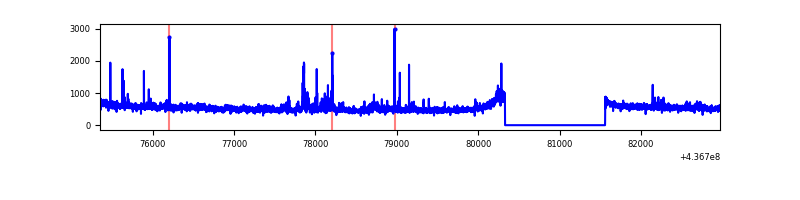 |
| C | 7617 | 6387 | 1675 | 1675 | 21.99% | 26.23% | 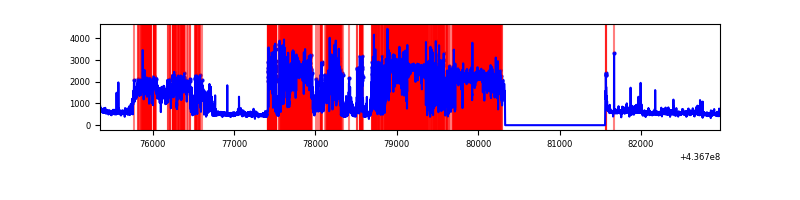 |
| D | 7617 | 6387 | 1085 | 1085 | 14.24% | 16.99% | 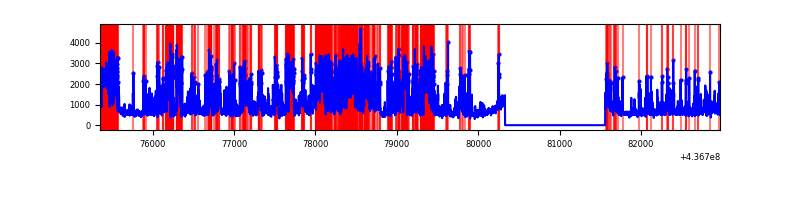 |
Top three noisy pixels from each quadrant. If the there are fewer than three noisy pixels in the level2.evt file, extra rows are filled as -1
| Pixel properties | Quadrant properties | ||||||
|---|---|---|---|---|---|---|---|
| Quadrant | DetID | PixID | Counts | Sigma | Mean | Median | Sigma |
| A | 15 | 223 | 1503340 | 9159.25 | 797 | 782 | 164.0 |
| A | 10 | 83 | 941308 | 5733.23 | 797 | 782 | 164.0 |
| A | 13 | 248 | 89459 | 540.55 | 797 | 782 | 164.0 |
| B | 0 | 200 | 99693 | 617.82 | 828 | 807 | 160.1 |
| B | 0 | 183 | 41070 | 251.55 | 828 | 807 | 160.1 |
| B | 12 | 111 | 19542 | 117.05 | 828 | 807 | 160.1 |
| C | 15 | 174 | 5143502 | 31604.12 | 701 | 707 | 162.7 |
| C | 3 | 233 | 175690 | 1075.33 | 701 | 707 | 162.7 |
| C | 15 | 190 | 171386 | 1048.88 | 701 | 707 | 162.7 |
| D | 12 | 33 | 1603335 | 8567.04 | 754 | 734 | 187.1 |
| D | 7 | 204 | 1200251 | 6412.27 | 754 | 734 | 187.1 |
| D | 5 | 235 | 392852 | 2096.15 | 754 | 734 | 187.1 |
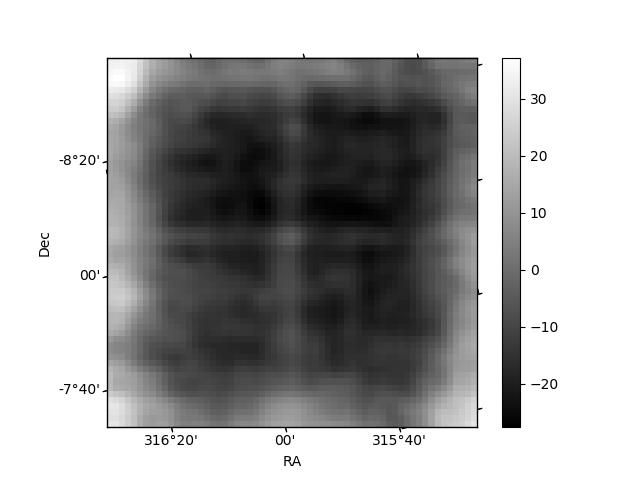
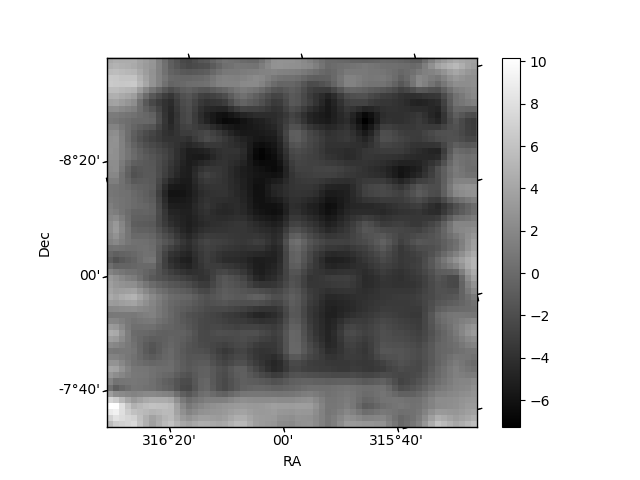
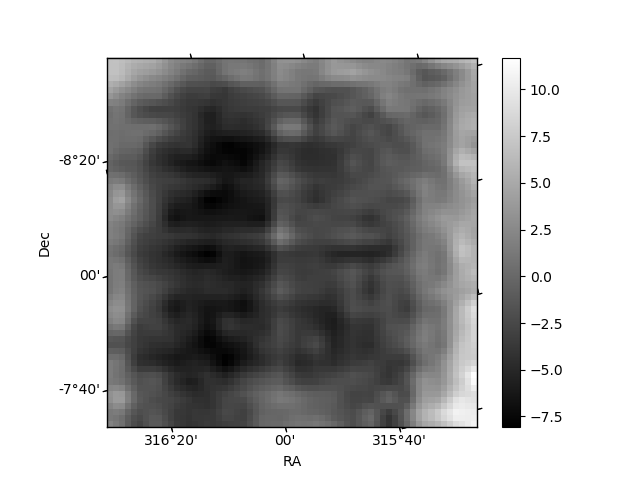
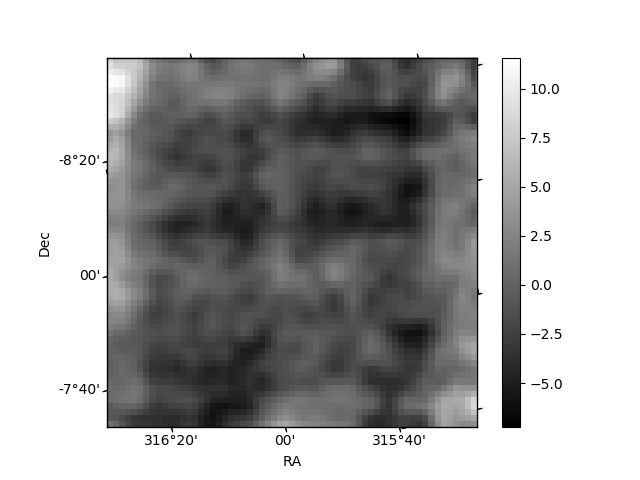
Histogram calculated using DETX and DETY for each event in the final _common_clean file
| Quadrant A | 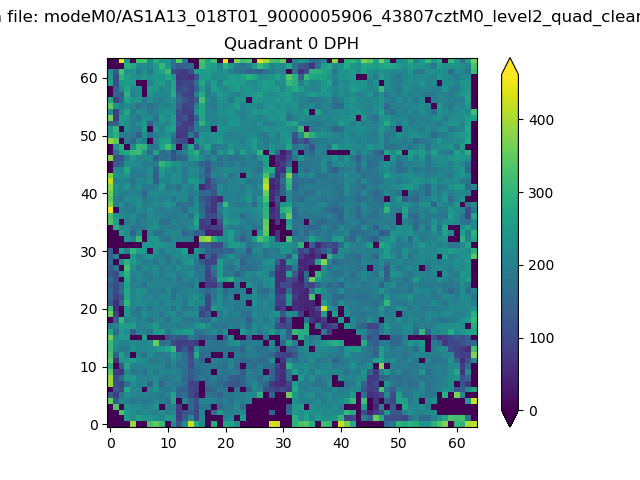 |
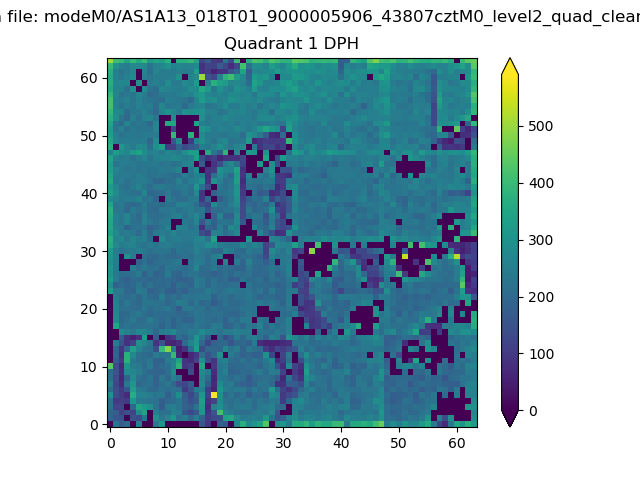 |
Quadrant B |
|---|---|---|---|
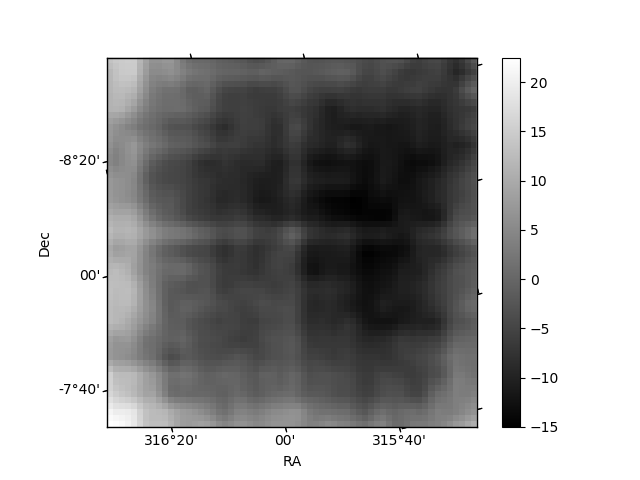
| Quadrant D | 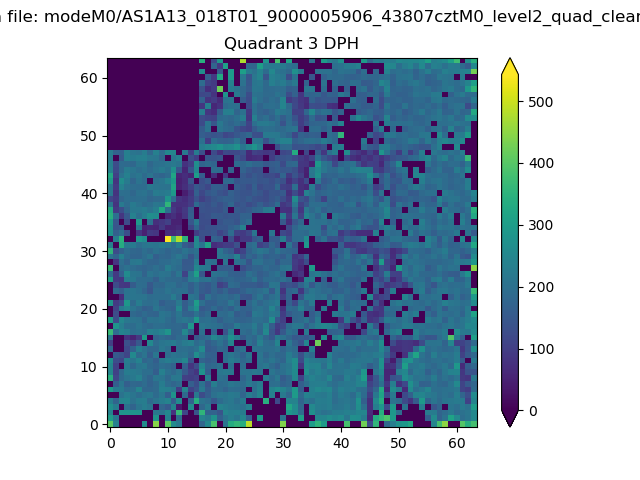 |
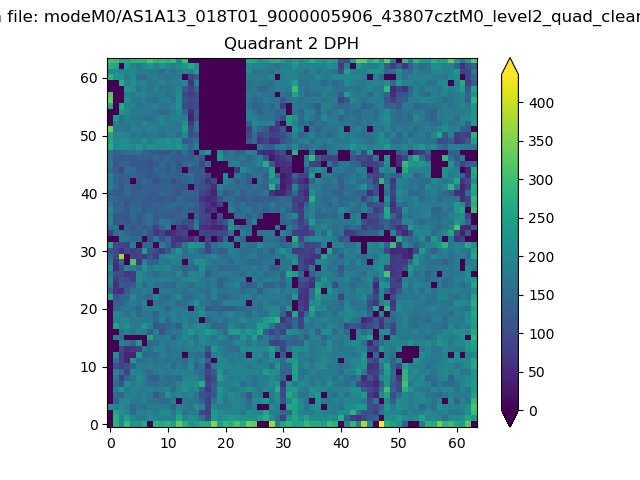 |
Quadrant C |
| Plot type | Count rate plots | Images |
|---|---|---|
| Comparison with Poisson distribution Blue bars denote a histogram of data divided into 1 sec bins. Red curve is a Poisson curve with rate = median count rate of data. |
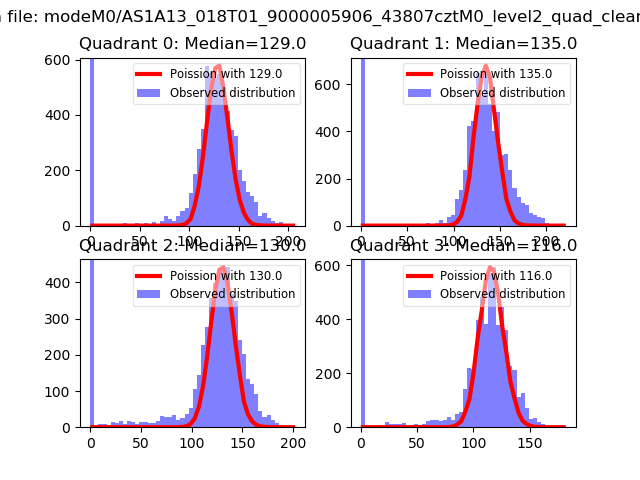 |
 |
| Quadrant-wise count rates Data is divided into 100 sec bins |
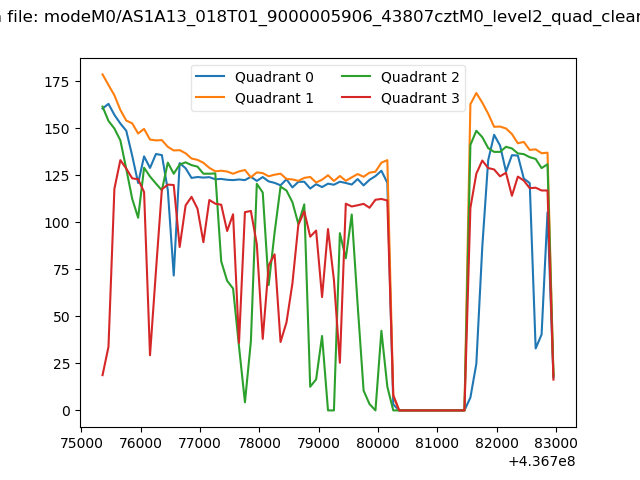 |
|
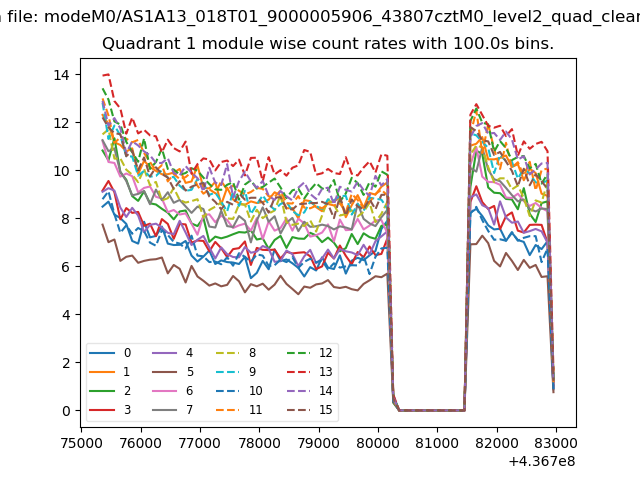
| Module-wise count rates for Quadrant A Data is divided into 100 sec bins |
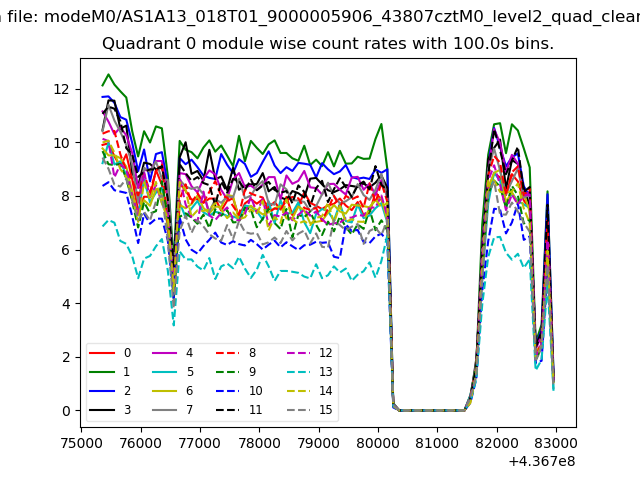 |
 |
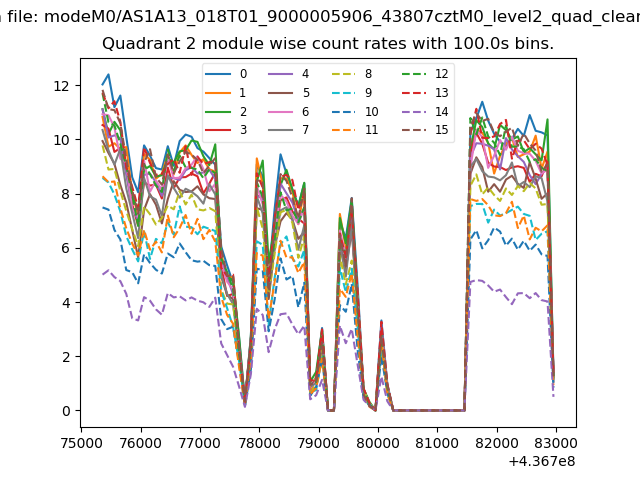
| Module-wise count rates for Quadrant B Data is divided into 100 sec bins |
 |
 |
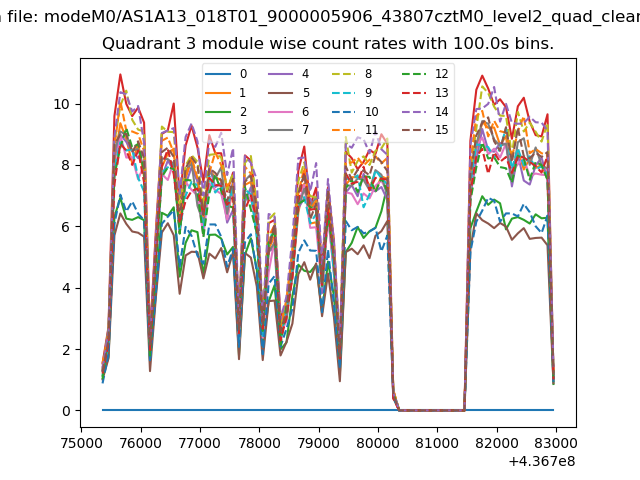
| Module-wise count rates for Quadrant C Data is divided into 100 sec bins |
 |
 |
| Module-wise count rates for Quadrant D Data is divided into 100 sec bins |
 |
 |
| Parameter | Plot |
|---|---|
| CZT HV Monitor | 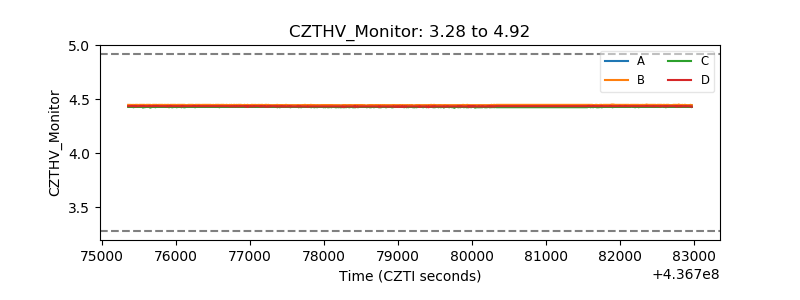 |
| D_VDD | 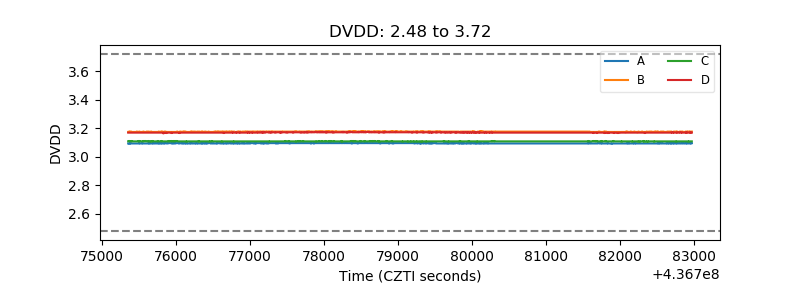 |
| Temperature 1 | 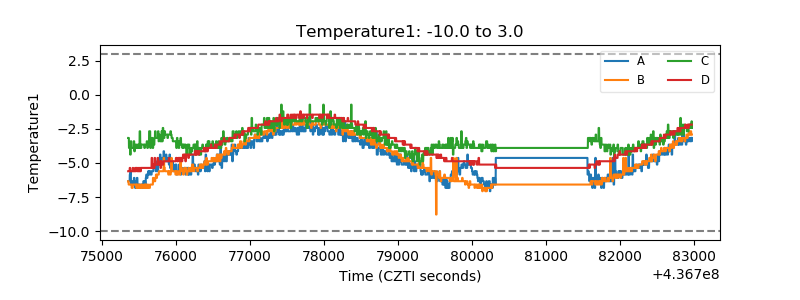 |
| Veto HV Monitor | 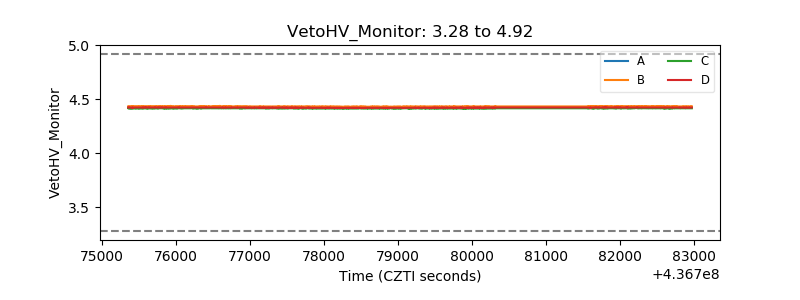 |
| Veto LLD | 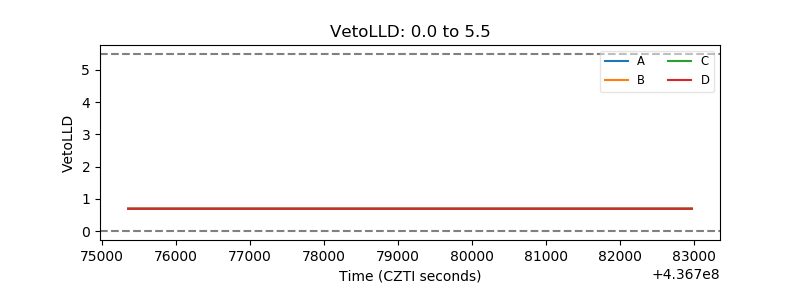 |
| Alpha Counter | 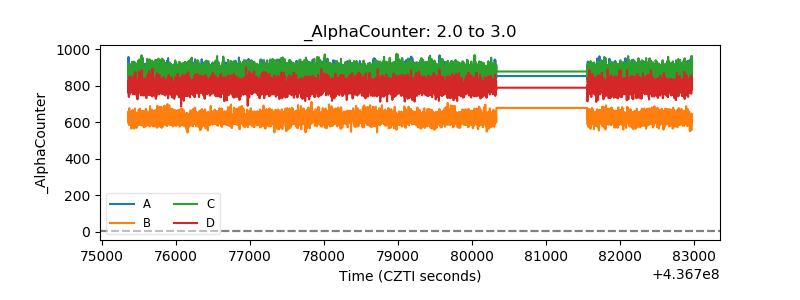 |
| _CPM_Rate | 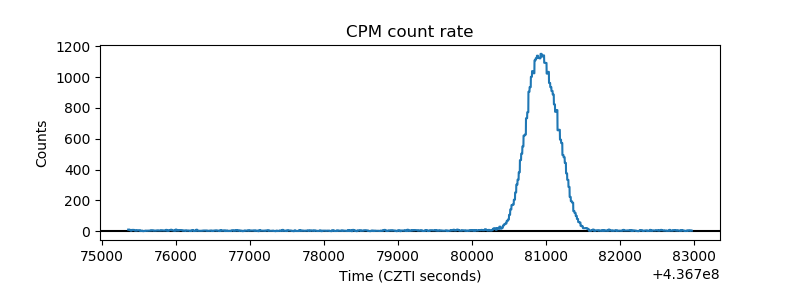 |
| CZT Counter | 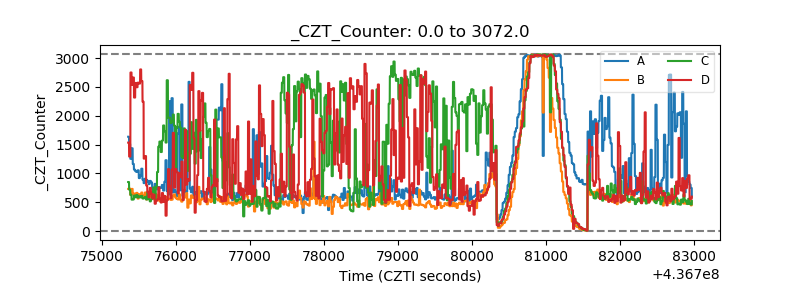 |
| +2.5 Volts monitor | 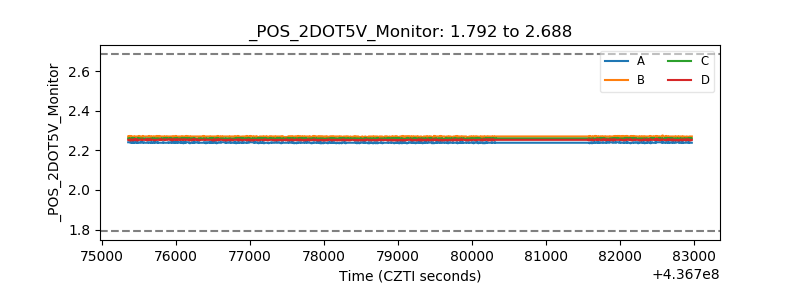 |
| +5 Volts monitor | 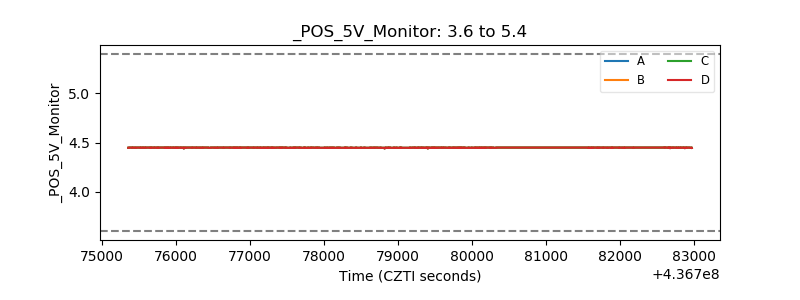 |
| _ROLL_ROT | 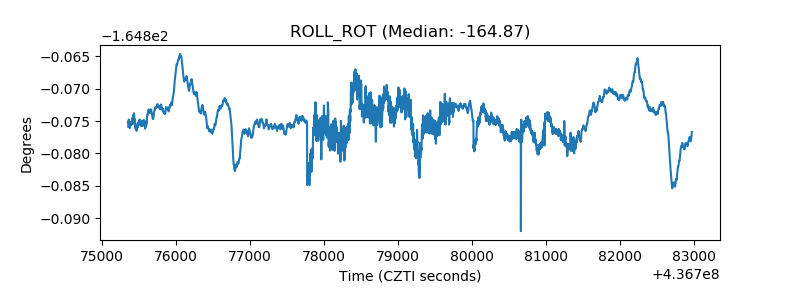 |
| _Roll_DEC | 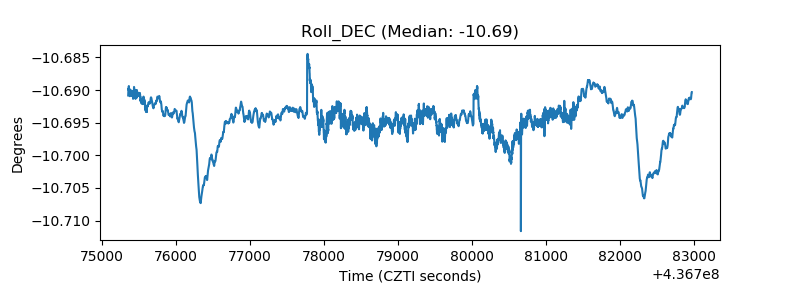 |
| _Roll_RA | 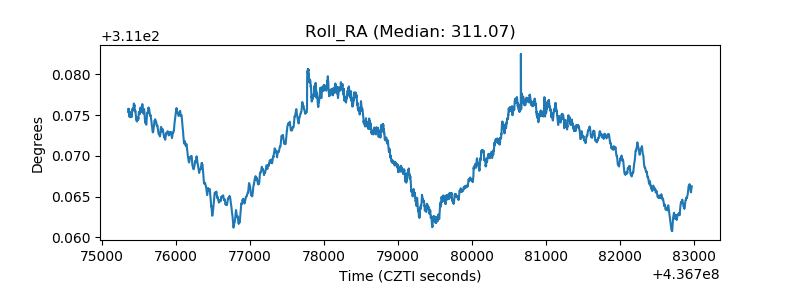 |
| Veto Counter | 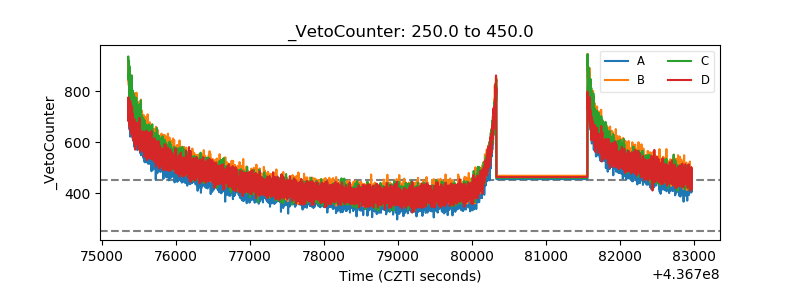 |