| Param | Original file | Final file |
|---|---|---|
| Filename | modeM0/AS1A13_018T01_9000005906_43809cztM0_level2.fits | modeM0/AS1A13_018T01_9000005906_43809cztM0_level2_quad_clean.evt |
| Size (bytes) | 676,321,920 | 91,160,640 |
| Size | 645.0 MB | 86.9 MB |
| Events in quadrant A | 5,727,395 | 607,095 |
| Events in quadrant B | 4,327,897 | 695,991 |
| Events in quadrant C | 9,209,876 | 448,984 |
| Events in quadrant D | 5,308,944 | 592,719 |
| Mode M0 | |||
|---|---|---|---|
| Quadrant | BADHDUFLAG | Total packets | Discarded packets |
| A | 0 | 21482 | 161 |
| B | 0 | 16786 | 62 |
| C | 0 | 31695 | 245 |
| D | 0 | 19853 | 71 |
| Mode SS | |||
|---|---|---|---|
| Quadrant | BADHDUFLAG | Total packets | Discarded packets |
| A | 0 | 119 | 0 |
| B | 0 | 120 | 0 |
| C | 0 | 120 | 0 |
| D | 0 | 120 | 0 |
| Mode M9 | |||
|---|---|---|---|
| Quadrant | BADHDUFLAG | Total packets | Discarded packets |
| A | 0 | 11 | 0 |
| B | 0 | 11 | 0 |
| C | 0 | 11 | 0 |
| D | 0 | 11 | 0 |
| Quadrant | Total seconds | Saturated seconds | Saturation percentage |
|---|---|---|---|
| A | 5951 | 965 | 16.215762% |
| B | 5955 | 425 | 7.136860% |
| C | 5937 | 2441 | 41.115041% |
| D | 5962 | 623 | 10.449514% |
Noise dominated data is calculated using 1-second bins in cleaned event files. If a bin has >2000 counts, and if more than 50% of those come from <1% of pixels, then it is considered to be noise-dominated and hence unusable.
| Quadrant | # 1 sec bins | Bins with >0 counts | Bins with >2000 counts | High rate bins dominated by noise | Noise dominated (total time) | Noise dominated (detector-on time) | Marked lightcurve |
|---|---|---|---|---|---|---|---|
| A | 7040 | 5973 | 567 | 567 | 8.05% | 9.49% | 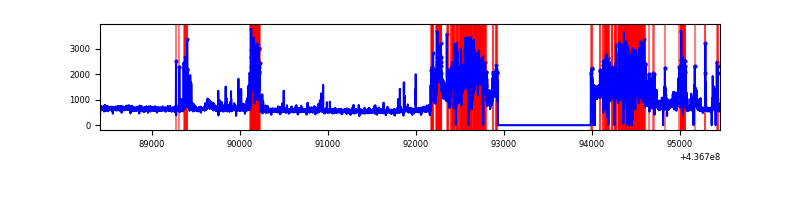 |
| B | 7040 | 5981 | 238 | 238 | 3.38% | 3.98% | 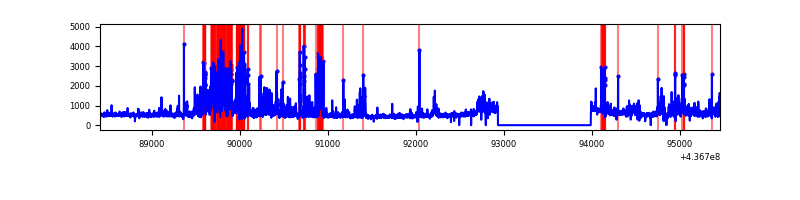 |
| C | 7040 | 5968 | 2176 | 2176 | 30.91% | 36.46% | 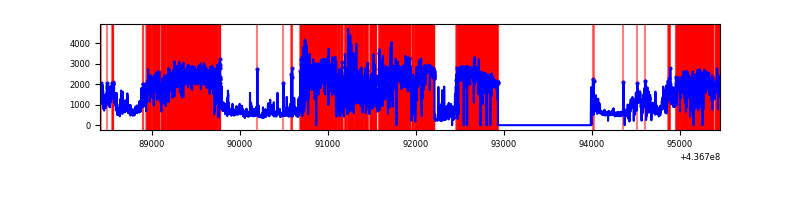 |
| D | 7041 | 5980 | 374 | 374 | 5.31% | 6.25% | 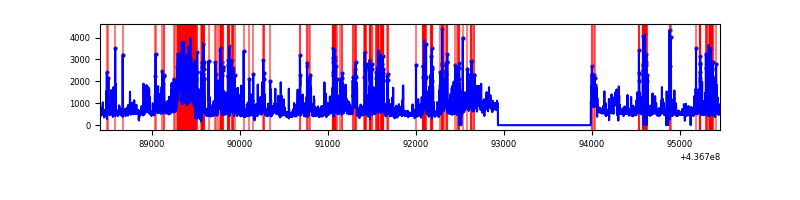 |
Top three noisy pixels from each quadrant. If the there are fewer than three noisy pixels in the level2.evt file, extra rows are filled as -1
| Pixel properties | Quadrant properties | ||||||
|---|---|---|---|---|---|---|---|
| Quadrant | DetID | PixID | Counts | Sigma | Mean | Median | Sigma |
| A | 15 | 223 | 1778831 | 12753.89 | 677 | 664 | 139.4 |
| A | 10 | 83 | 854130 | 6121.48 | 677 | 664 | 139.4 |
| A | 7 | 32 | 319477 | 2286.68 | 677 | 664 | 139.4 |
| B | 0 | 200 | 979111 | 7113.15 | 704 | 686 | 137.6 |
| B | 5 | 235 | 213380 | 1546.29 | 704 | 686 | 137.6 |
| B | 4 | 170 | 79246 | 571.13 | 704 | 686 | 137.6 |
| C | 15 | 174 | 4776085 | 36723.81 | 558 | 560 | 130.0 |
| C | 14 | 254 | 1229021 | 9446.87 | 558 | 560 | 130.0 |
| C | 3 | 233 | 497403 | 3820.72 | 558 | 560 | 130.0 |
| D | 5 | 235 | 489674 | 2849.48 | 680 | 659 | 171.6 |
| D | 12 | 33 | 407534 | 2370.85 | 680 | 659 | 171.6 |
| D | 12 | 128 | 394045 | 2292.25 | 680 | 659 | 171.6 |
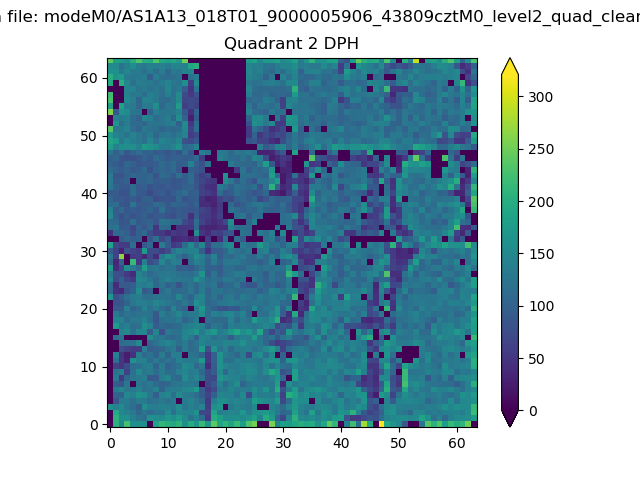
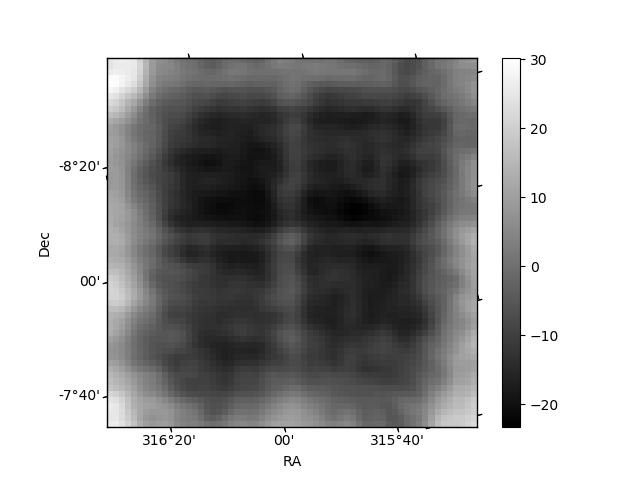
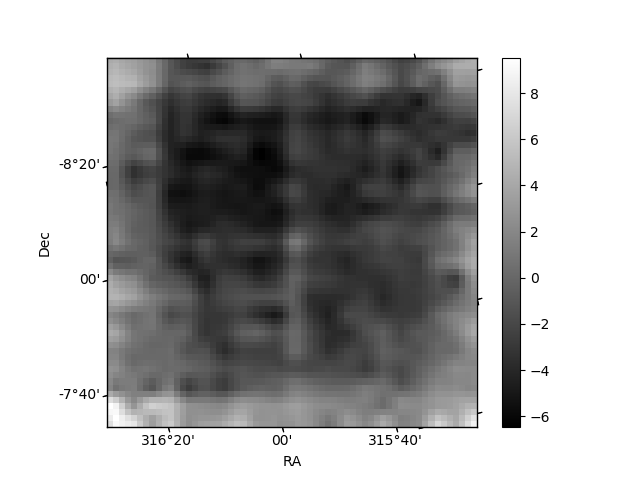
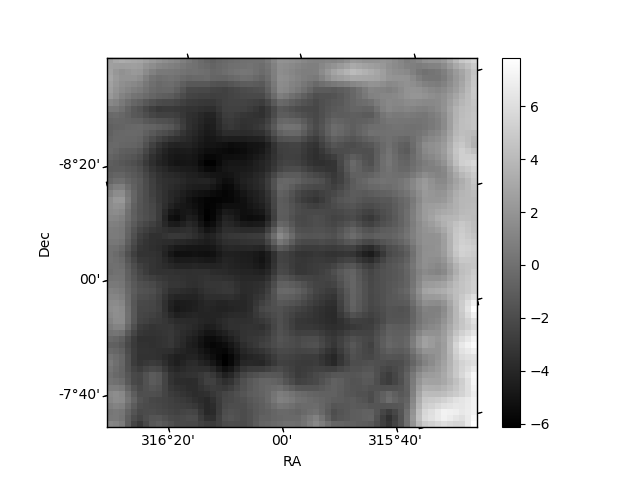
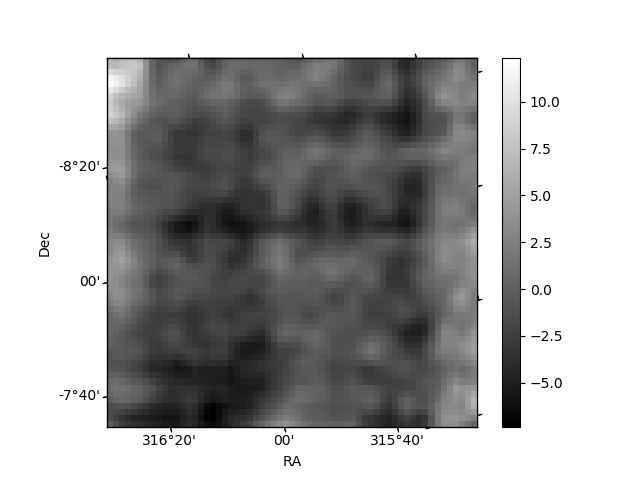
Histogram calculated using DETX and DETY for each event in the final _common_clean file
| Quadrant A | 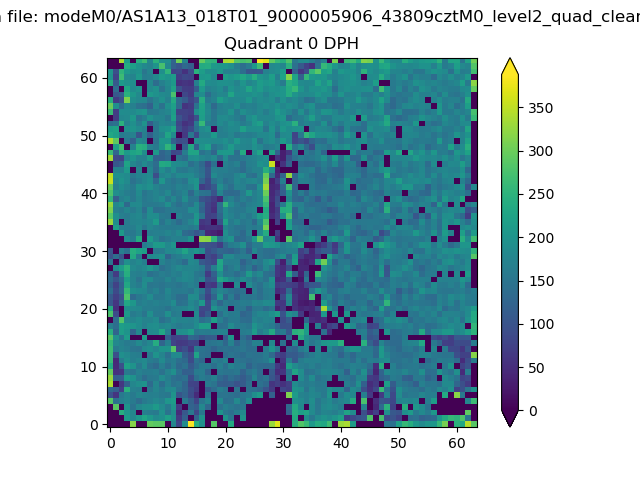 |
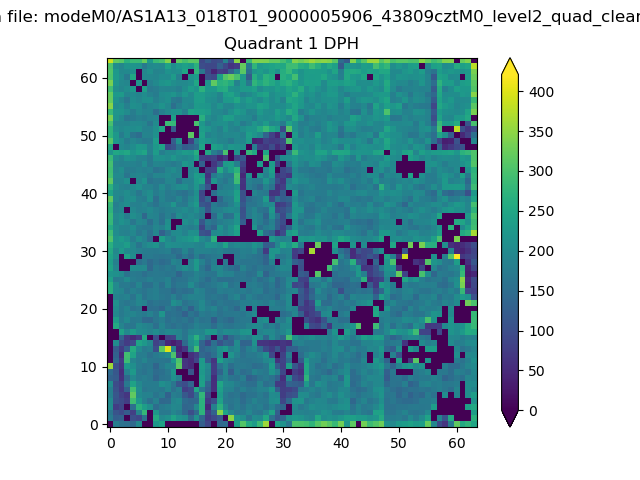 |
Quadrant B |
|---|---|---|---|
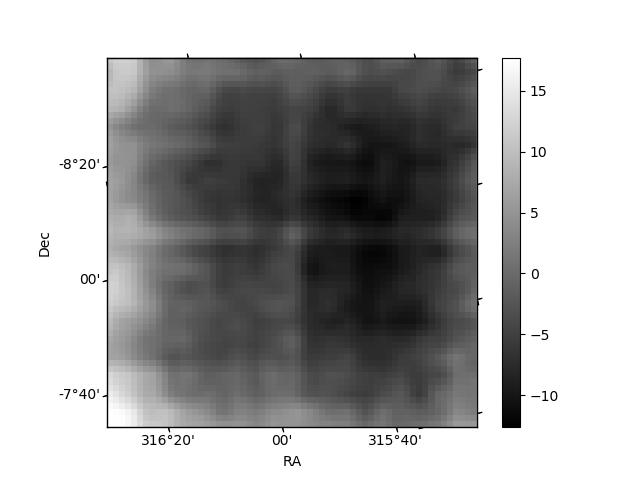
| Quadrant D | 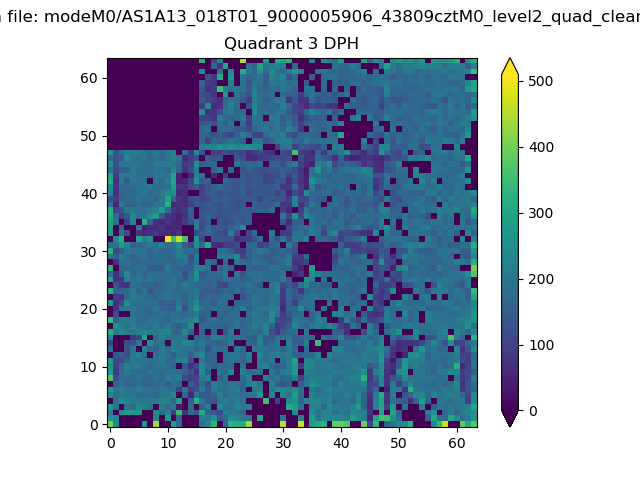 |
 |
Quadrant C |
| Plot type | Count rate plots | Images |
|---|---|---|
| Comparison with Poisson distribution Blue bars denote a histogram of data divided into 1 sec bins. Red curve is a Poisson curve with rate = median count rate of data. |
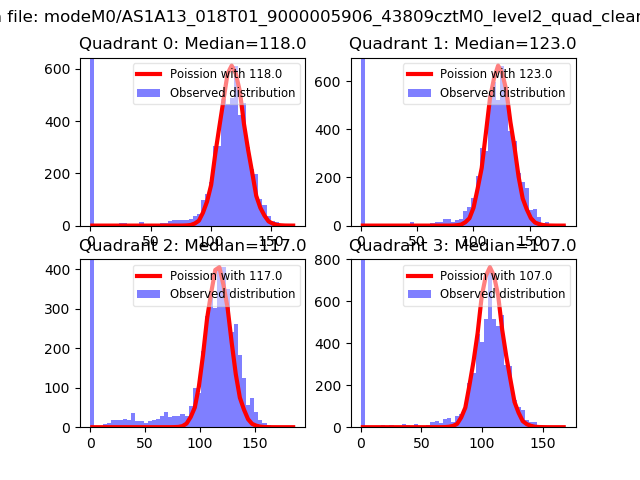 |
 |
| Quadrant-wise count rates Data is divided into 100 sec bins |
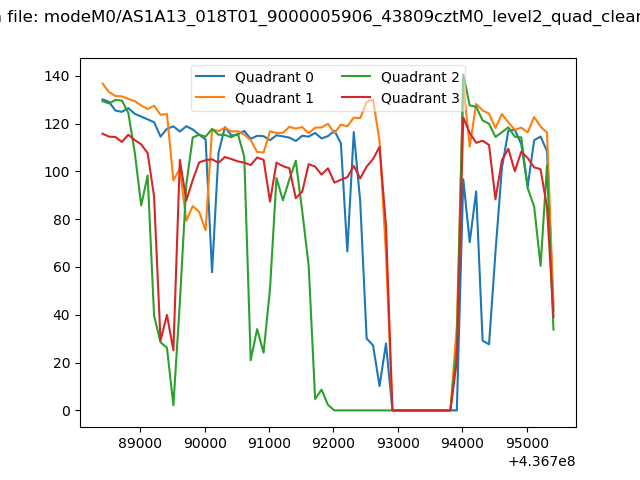 |
|
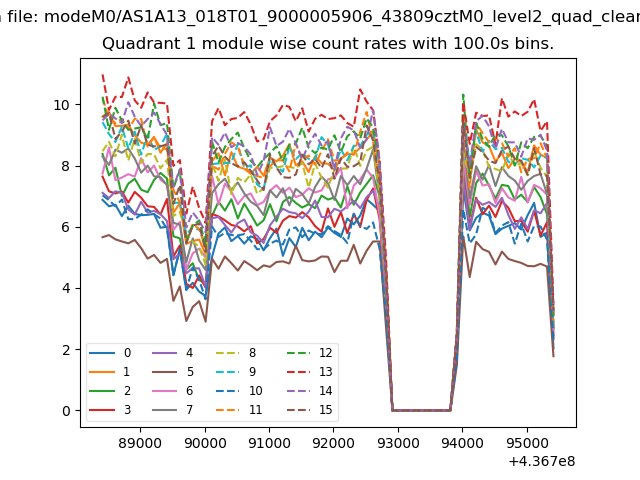
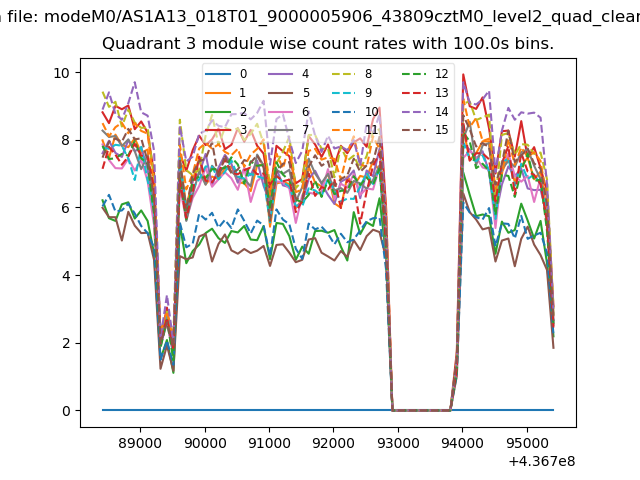
| Module-wise count rates for Quadrant A Data is divided into 100 sec bins |
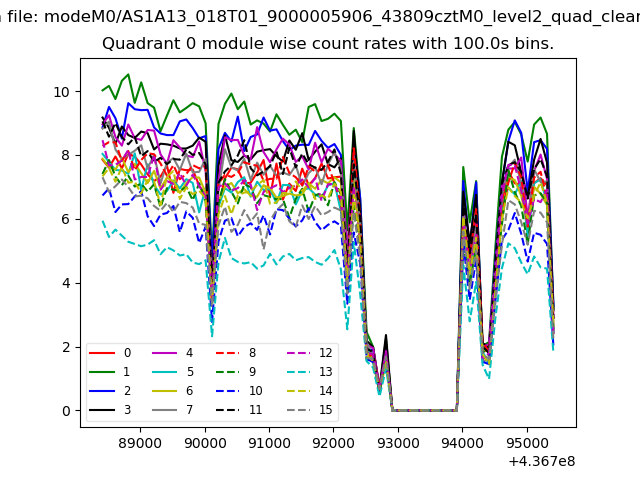 |
 |
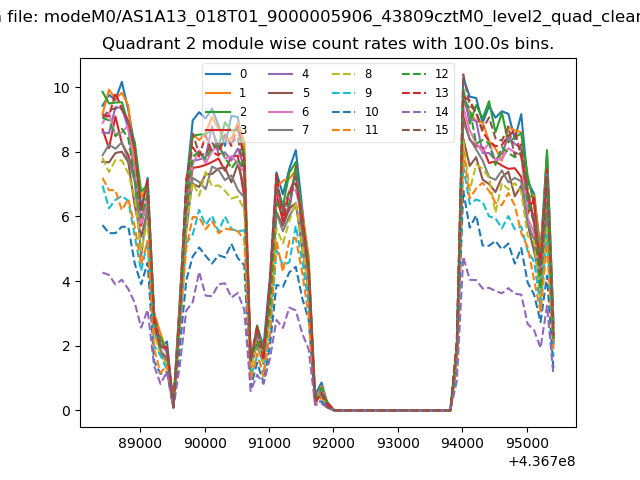
| Module-wise count rates for Quadrant B Data is divided into 100 sec bins |
 |
 |
| Module-wise count rates for Quadrant C Data is divided into 100 sec bins |
 |
 |
| Module-wise count rates for Quadrant D Data is divided into 100 sec bins |
 |
 |
| Parameter | Plot |
|---|---|
| CZT HV Monitor | 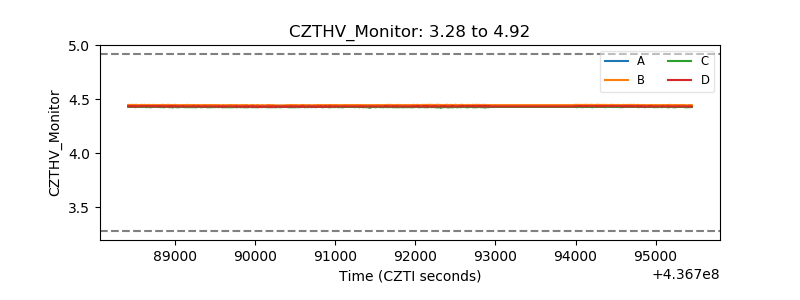 |
| D_VDD | 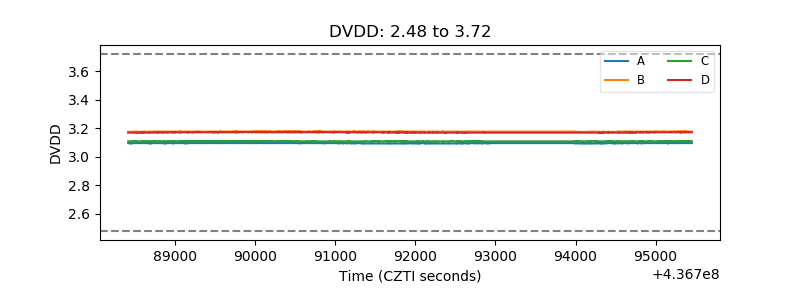 |
| Temperature 1 | 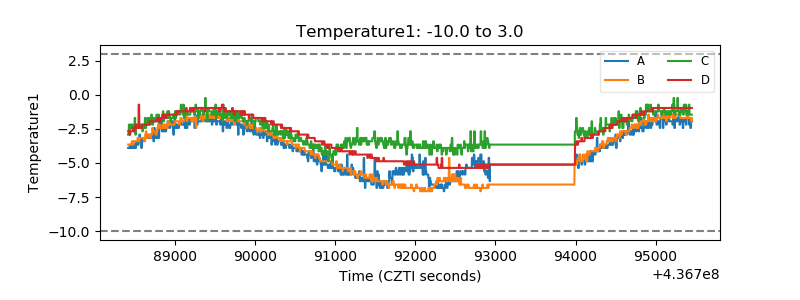 |
| Veto HV Monitor | 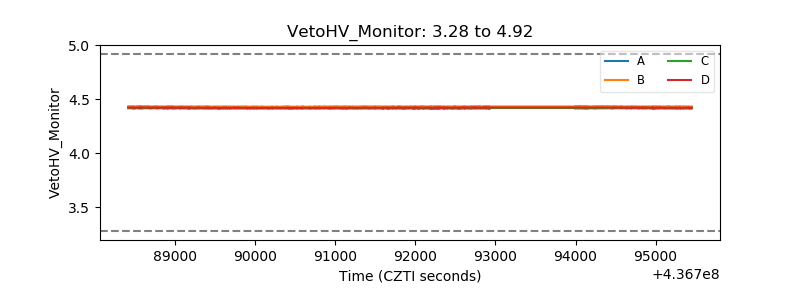 |
| Veto LLD | 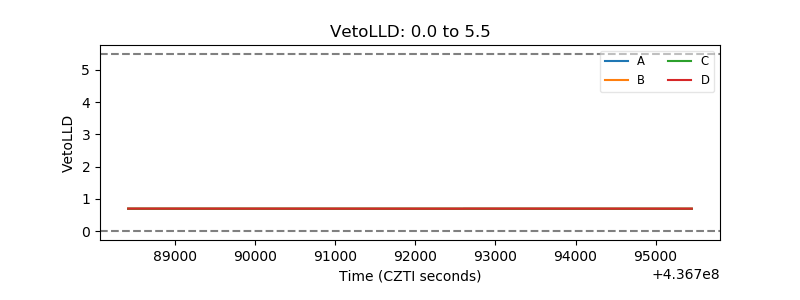 |
| Alpha Counter | 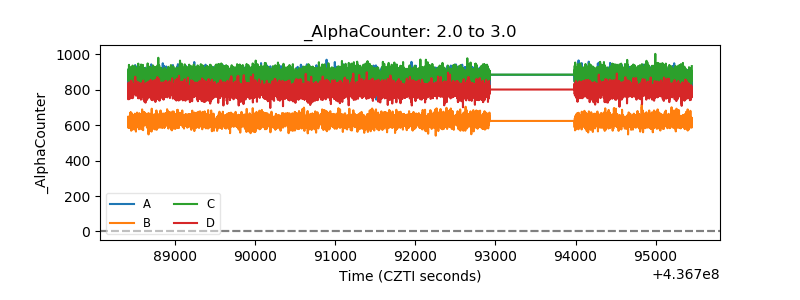 |
| _CPM_Rate | 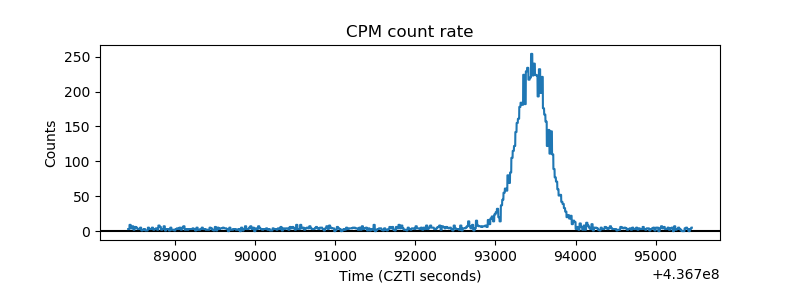 |
| CZT Counter | 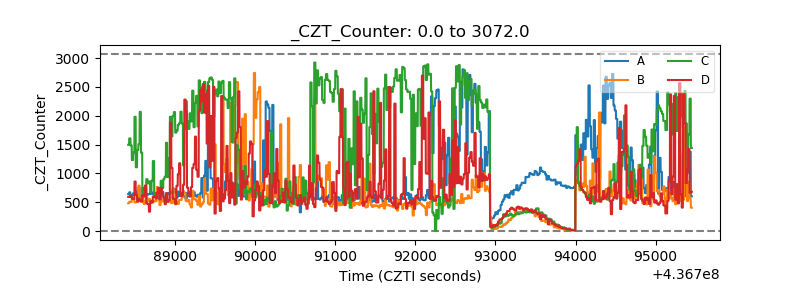 |
| +2.5 Volts monitor | 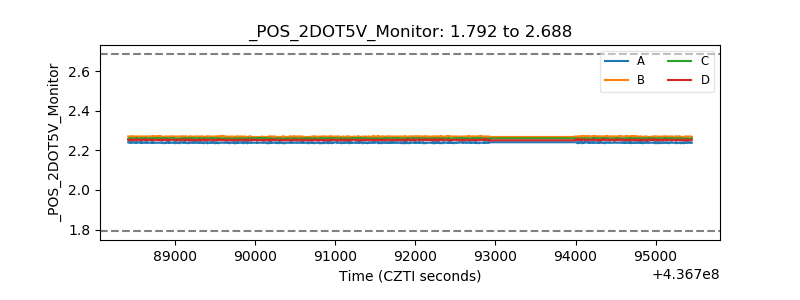 |
| +5 Volts monitor | 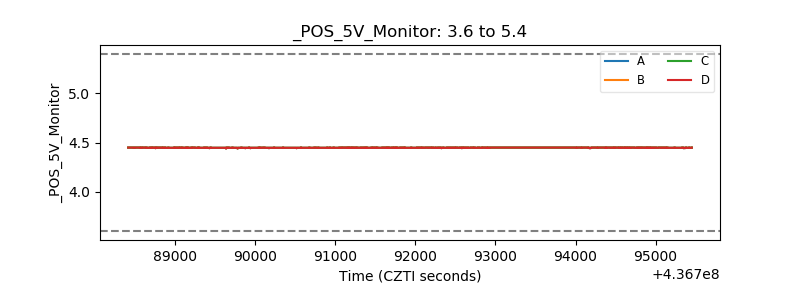 |
| _ROLL_ROT | 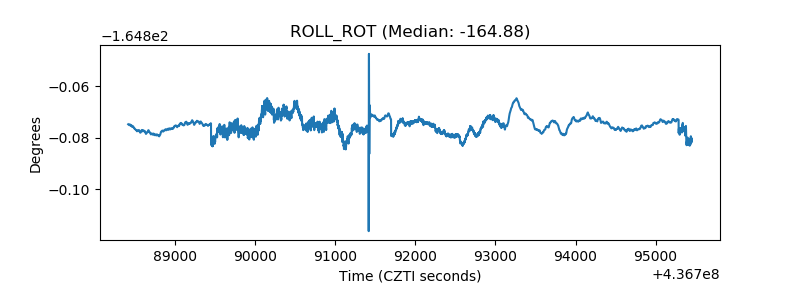 |
| _Roll_DEC | 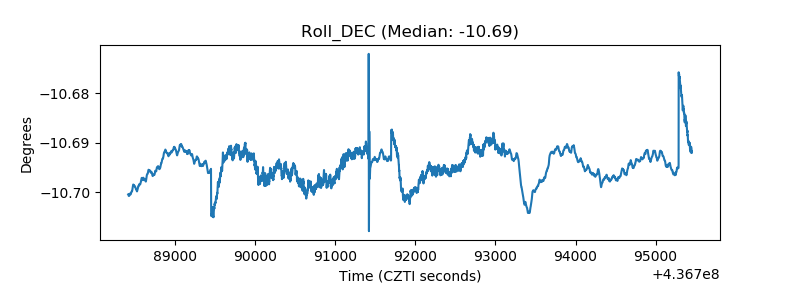 |
| _Roll_RA | 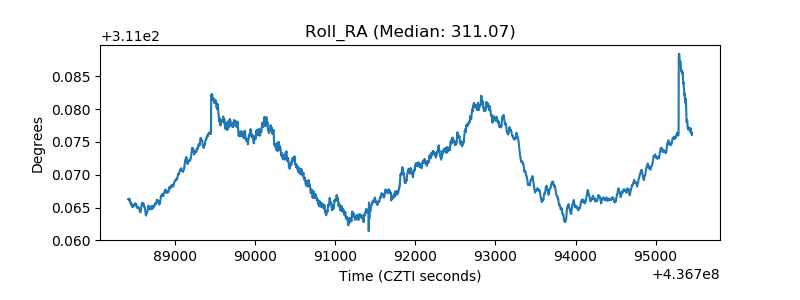 |
| Veto Counter | 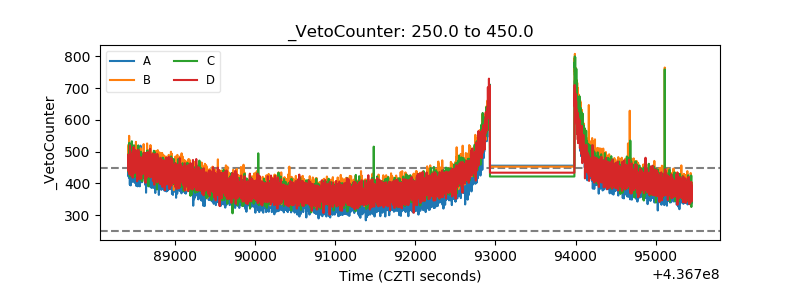 |