| Param | Original file | Final file |
|---|---|---|
| Filename | modeM0/AS1A13_018T01_9000005906_43810cztM0_level2.fits | modeM0/AS1A13_018T01_9000005906_43810cztM0_level2_quad_clean.evt |
| Size (bytes) | 735,523,200 | 92,854,080 |
| Size | 701.4 MB | 88.6 MB |
| Events in quadrant A | 4,939,481 | 688,804 |
| Events in quadrant B | 4,399,448 | 699,776 |
| Events in quadrant C | 9,463,357 | 511,369 |
| Events in quadrant D | 7,934,712 | 469,379 |
| Mode M0 | |||
|---|---|---|---|
| Quadrant | BADHDUFLAG | Total packets | Discarded packets |
| A | 0 | 19228 | 1 |
| B | 0 | 17358 | 1 |
| C | 0 | 32405 | 6 |
| D | 0 | 27921 | 1 |
| Mode SS | |||
|---|---|---|---|
| Quadrant | BADHDUFLAG | Total packets | Discarded packets |
| A | 0 | 130 | 0 |
| B | 0 | 130 | 0 |
| C | 0 | 130 | 0 |
| D | 0 | 130 | 0 |
| Mode M9 | |||
|---|---|---|---|
| Quadrant | BADHDUFLAG | Total packets | Discarded packets |
| A | 0 | 6 | 0 |
| B | 0 | 6 | 0 |
| C | 0 | 6 | 0 |
| D | 0 | 6 | 0 |
| Quadrant | Total seconds | Saturated seconds | Saturation percentage |
|---|---|---|---|
| A | 6326 | 419 | 6.623459% |
| B | 6327 | 474 | 7.491702% |
| C | 6326 | 2141 | 33.844451% |
| D | 6326 | 1937 | 30.619665% |
Noise dominated data is calculated using 1-second bins in cleaned event files. If a bin has >2000 counts, and if more than 50% of those come from <1% of pixels, then it is considered to be noise-dominated and hence unusable.
| Quadrant | # 1 sec bins | Bins with >0 counts | Bins with >2000 counts | High rate bins dominated by noise | Noise dominated (total time) | Noise dominated (detector-on time) | Marked lightcurve |
|---|---|---|---|---|---|---|---|
| A | 6971 | 6326 | 137 | 137 | 1.97% | 2.17% | 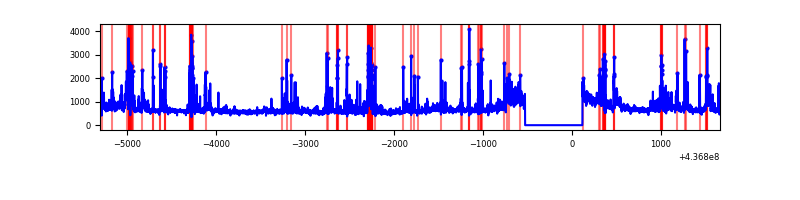 |
| B | 6972 | 6328 | 217 | 217 | 3.11% | 3.43% | 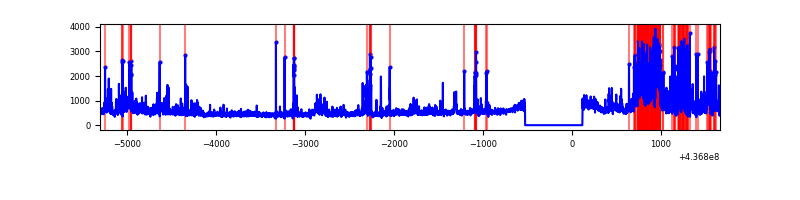 |
| C | 6971 | 6326 | 2197 | 2197 | 31.52% | 34.73% | 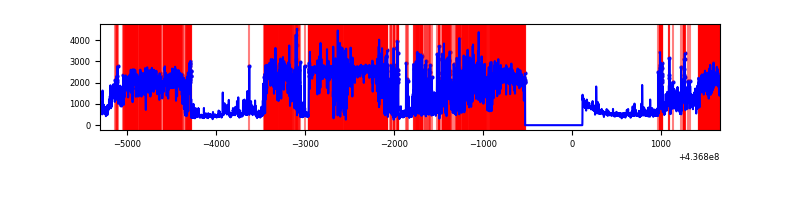 |
| D | 6970 | 6326 | 1495 | 1495 | 21.45% | 23.63% | 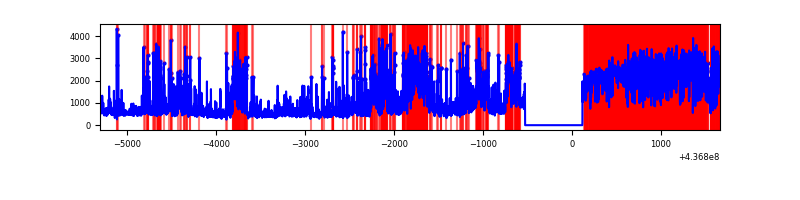 |
Top three noisy pixels from each quadrant. If the there are fewer than three noisy pixels in the level2.evt file, extra rows are filled as -1
| Pixel properties | Quadrant properties | ||||||
|---|---|---|---|---|---|---|---|
| Quadrant | DetID | PixID | Counts | Sigma | Mean | Median | Sigma |
| A | 10 | 83 | 902040 | 5822.07 | 741 | 725 | 154.8 |
| A | 15 | 223 | 707979 | 4568.53 | 741 | 725 | 154.8 |
| A | 13 | 248 | 355847 | 2293.92 | 741 | 725 | 154.8 |
| B | 0 | 200 | 694980 | 4779.62 | 737 | 716 | 145.3 |
| B | 5 | 235 | 478726 | 3290.83 | 737 | 716 | 145.3 |
| B | 15 | 36 | 68631 | 467.56 | 737 | 716 | 145.3 |
| C | 15 | 174 | 5920450 | 39835.1 | 632 | 639 | 148.6 |
| C | 15 | 190 | 355960 | 2391.0 | 632 | 639 | 148.6 |
| C | 14 | 254 | 181540 | 1217.3 | 632 | 639 | 148.6 |
| D | 10 | 102 | 1653765 | 10228.49 | 621 | 601 | 161.6 |
| D | 12 | 34 | 1615591 | 9992.29 | 621 | 601 | 161.6 |
| D | 5 | 235 | 797000 | 4927.49 | 621 | 601 | 161.6 |
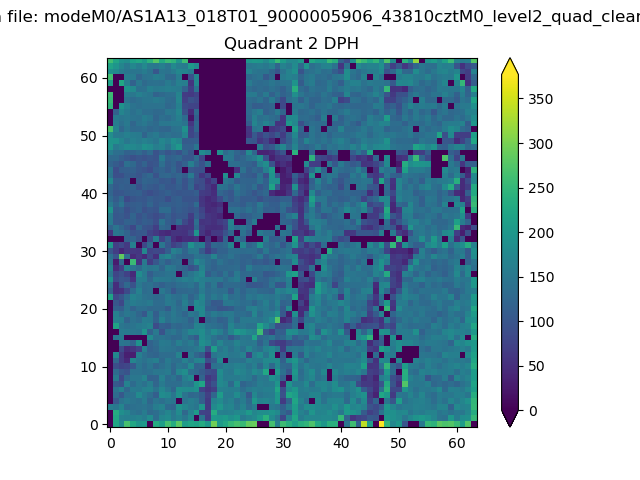
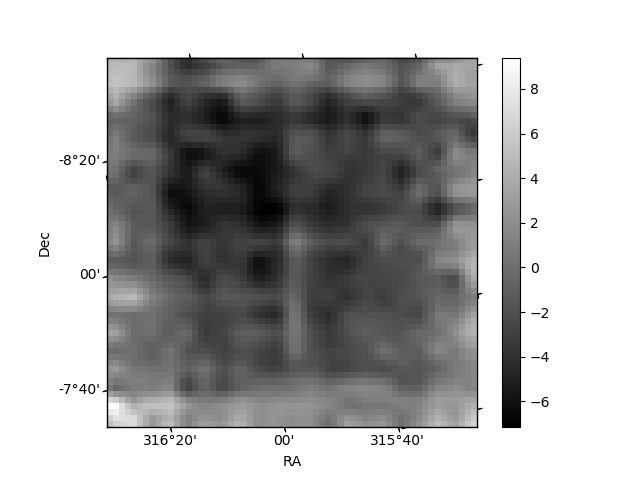
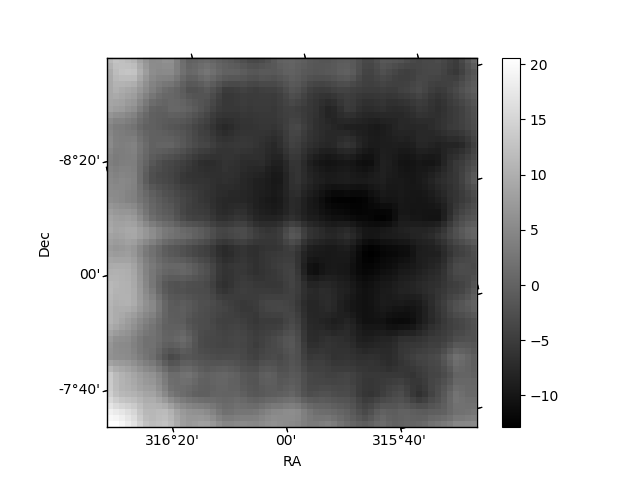
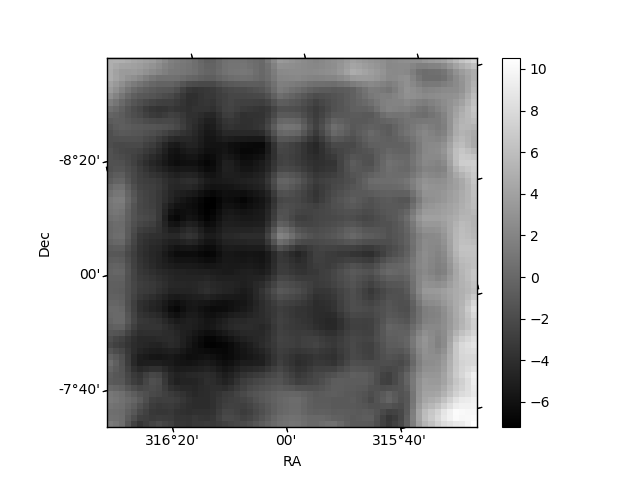
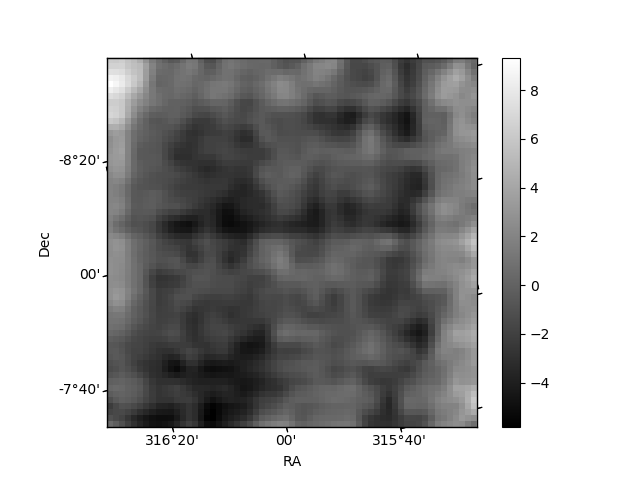
Histogram calculated using DETX and DETY for each event in the final _common_clean file
| Quadrant A | 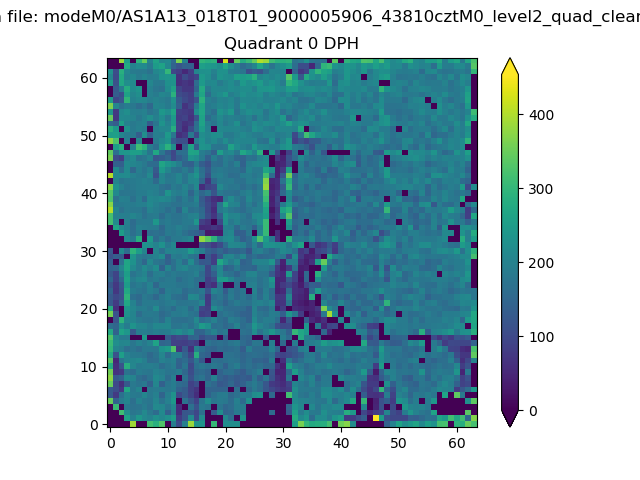 |
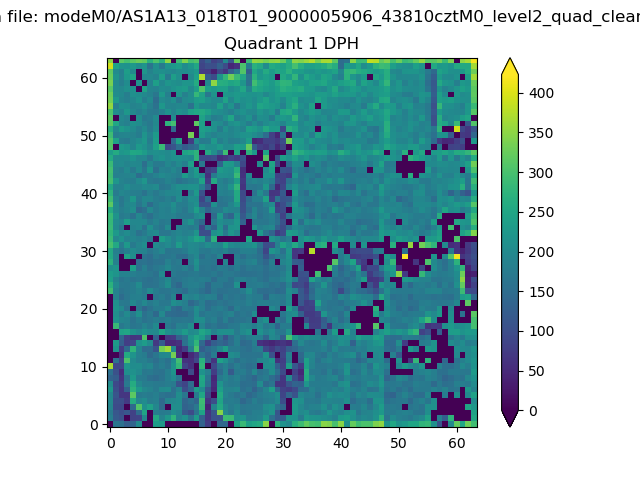 |
Quadrant B |
|---|---|---|---|
| Quadrant D | 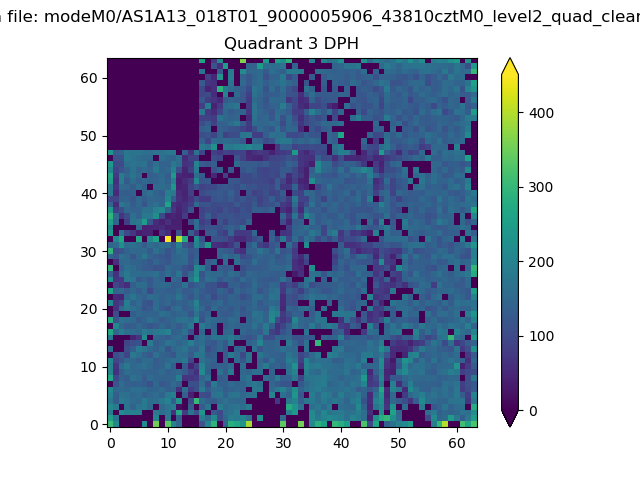 |
 |
Quadrant C |
| Plot type | Count rate plots | Images |
|---|---|---|
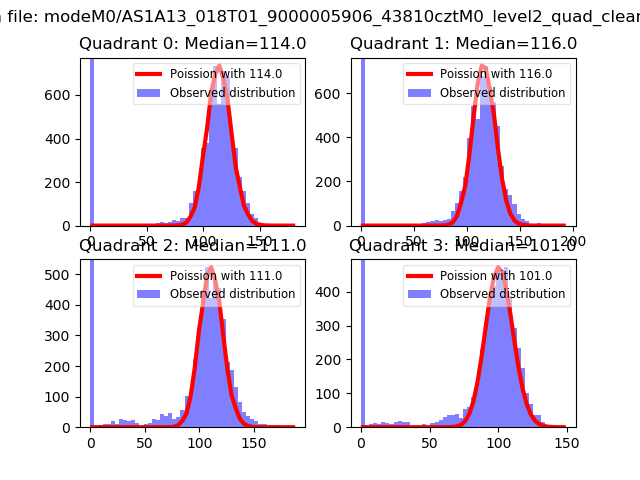
| Comparison with Poisson distribution Blue bars denote a histogram of data divided into 1 sec bins. Red curve is a Poisson curve with rate = median count rate of data. |
 |
 |
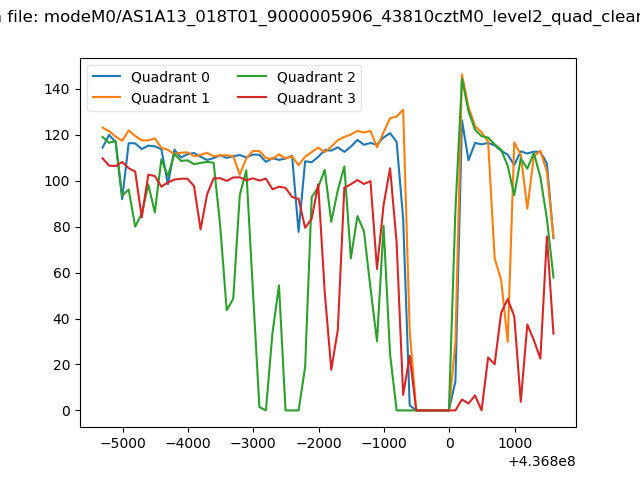
| Quadrant-wise count rates Data is divided into 100 sec bins |
 |
|
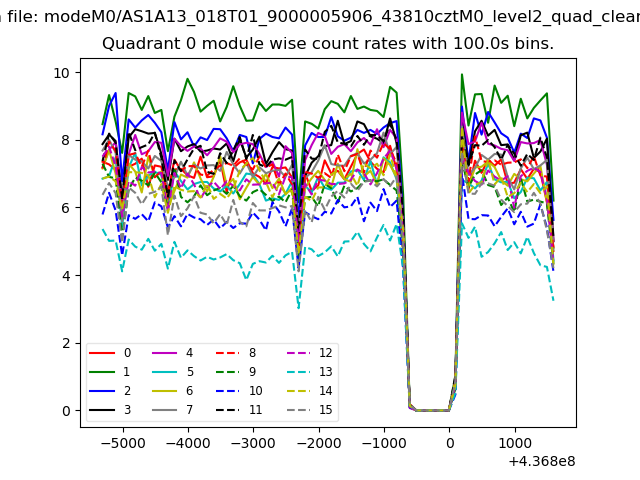
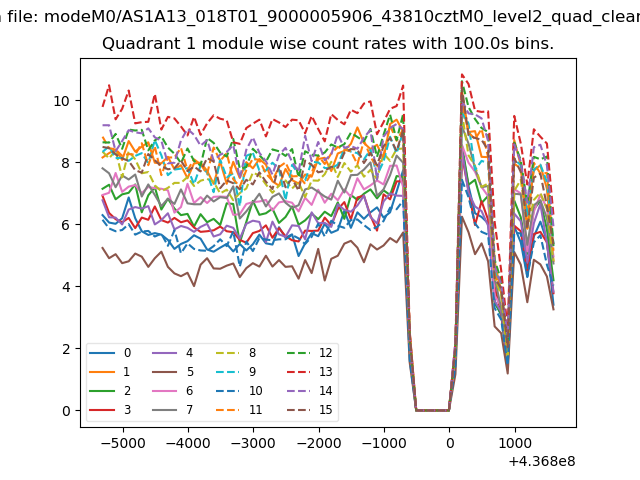
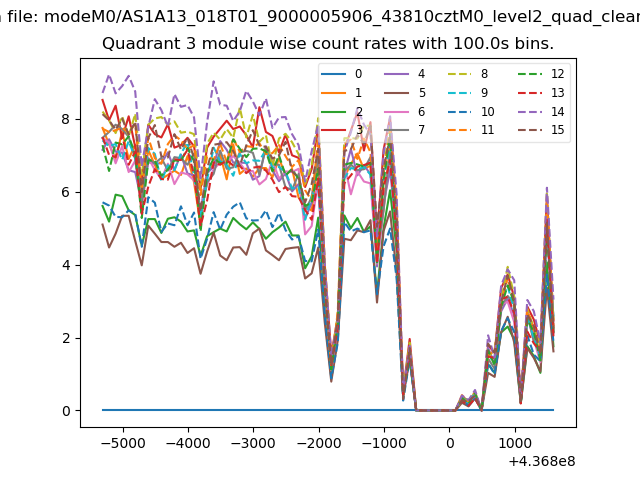
| Module-wise count rates for Quadrant A Data is divided into 100 sec bins |
 |
 |
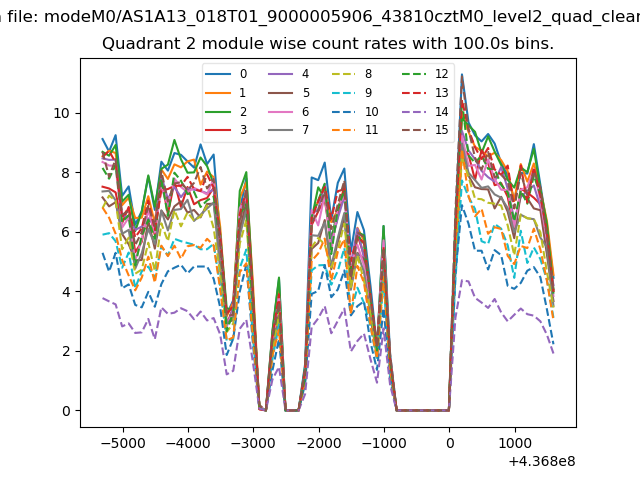
| Module-wise count rates for Quadrant B Data is divided into 100 sec bins |
 |
 |
| Module-wise count rates for Quadrant C Data is divided into 100 sec bins |
 |
 |
| Module-wise count rates for Quadrant D Data is divided into 100 sec bins |
 |
 |
| Parameter | Plot |
|---|---|
| CZT HV Monitor |  |
| D_VDD | 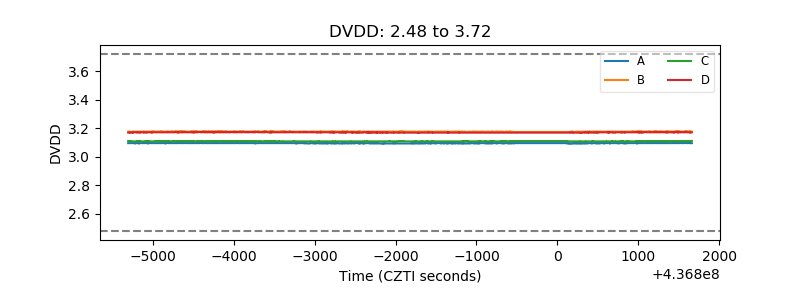 |
| Temperature 1 | 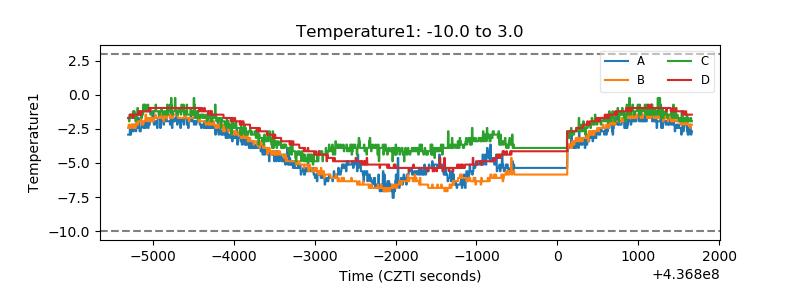 |
| Veto HV Monitor | 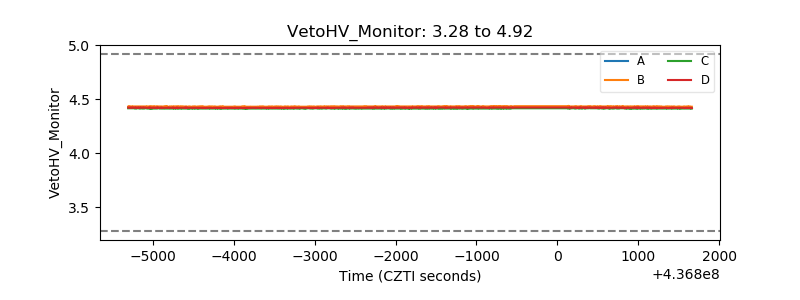 |
| Veto LLD | 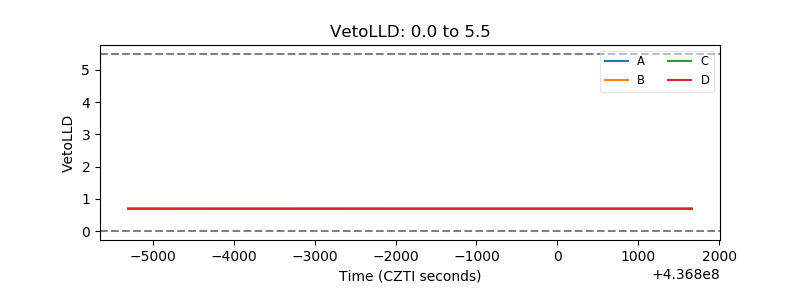 |
| Alpha Counter | 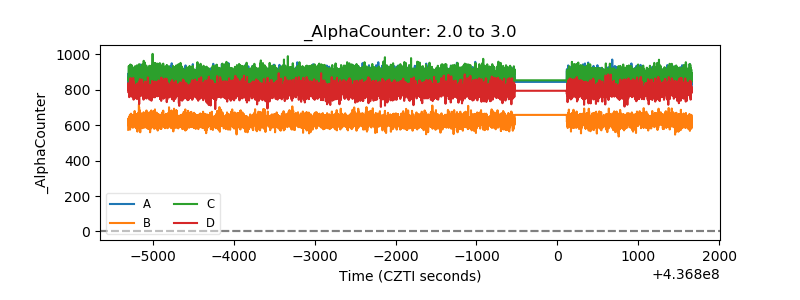 |
| _CPM_Rate | 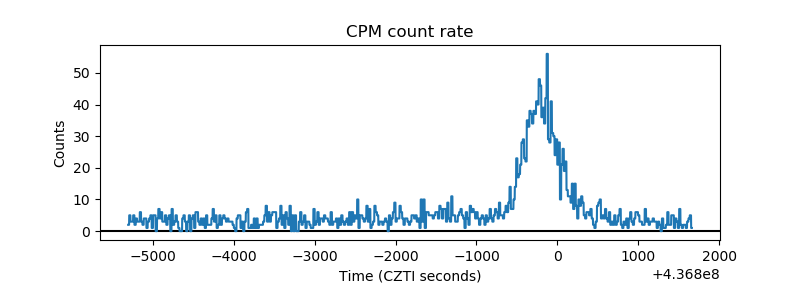 |
| CZT Counter | 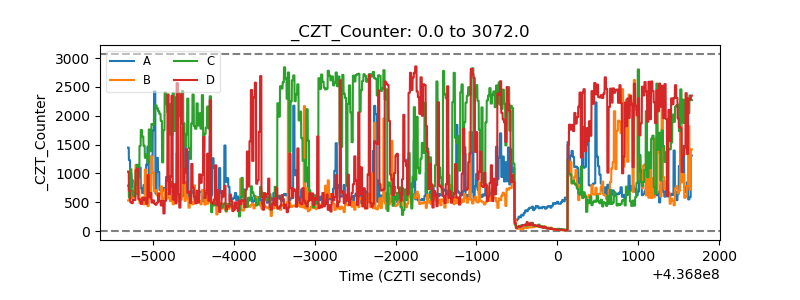 |
| +2.5 Volts monitor | 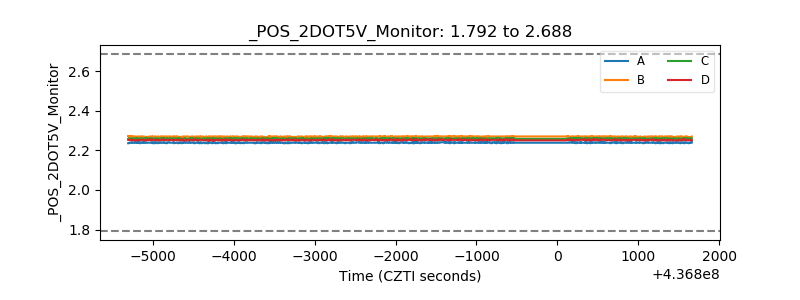 |
| +5 Volts monitor | 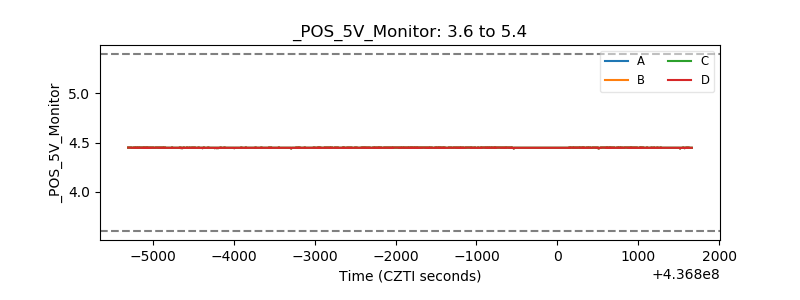 |
| _ROLL_ROT | 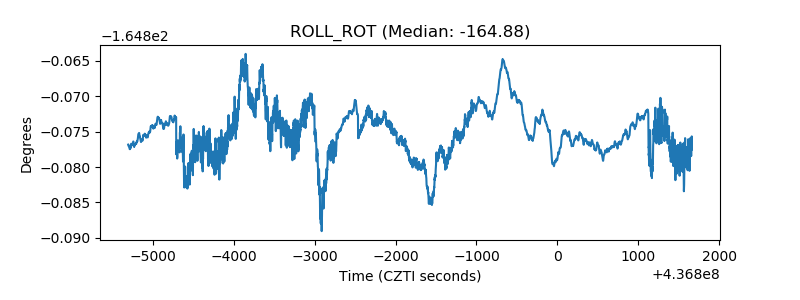 |
| _Roll_DEC | 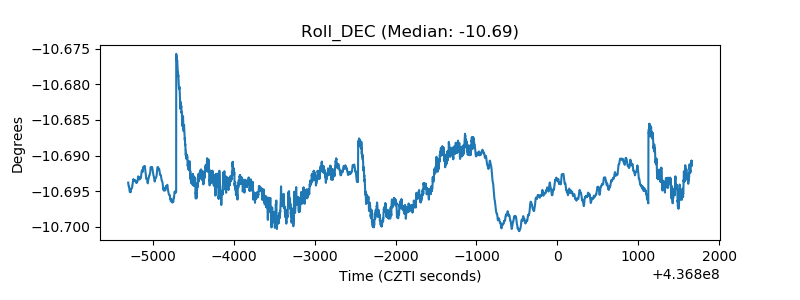 |
| _Roll_RA | 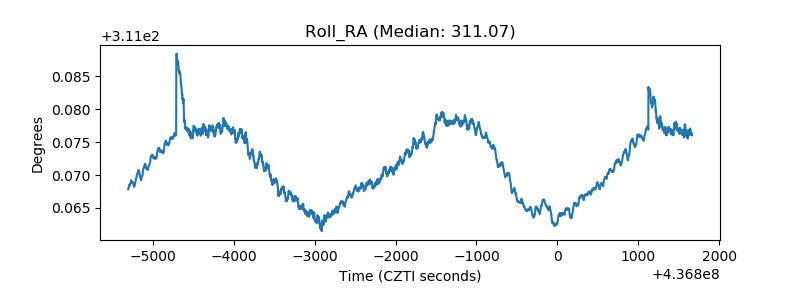 |
| Veto Counter | 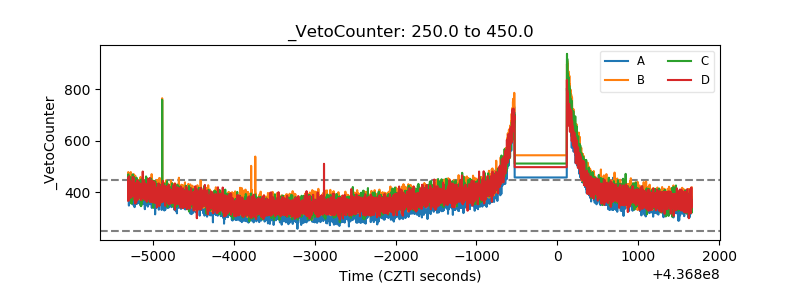 |