| Param | Original file | Final file |
|---|---|---|
| Filename | modeM0/AS1A13_018T01_9000005906_43811cztM0_level2.fits | modeM0/AS1A13_018T01_9000005906_43811cztM0_level2_quad_clean.evt |
| Size (bytes) | 1,074,867,840 | 90,411,840 |
| Size | 1.0 GB | 86.2 MB |
| Events in quadrant A | 10,073,039 | 596,751 |
| Events in quadrant B | 5,174,888 | 803,681 |
| Events in quadrant C | 8,161,681 | 661,601 |
| Events in quadrant D | 15,816,839 | 169,175 |
| Mode M0 | |||
|---|---|---|---|
| Quadrant | BADHDUFLAG | Total packets | Discarded packets |
| A | 0 | 35245 | 1 |
| B | 0 | 20206 | 1 |
| C | 0 | 29321 | 1 |
| D | 0 | 51823 | 1 |
| Mode SS | |||
|---|---|---|---|
| Quadrant | BADHDUFLAG | Total packets | Discarded packets |
| A | 0 | 146 | 0 |
| B | 0 | 146 | 0 |
| C | 0 | 146 | 0 |
| D | 0 | 146 | 0 |
| Mode M9 | |||
|---|---|---|---|
| Quadrant | BADHDUFLAG | Total packets | Discarded packets |
| A | 0 | 1 | 0 |
| B | 0 | 1 | 0 |
| C | 0 | 1 | 0 |
| D | 0 | 1 | 0 |
| Quadrant | Total seconds | Saturated seconds | Saturation percentage |
|---|---|---|---|
| A | 7271 | 2257 | 31.041122% |
| B | 7272 | 509 | 6.999450% |
| C | 7272 | 1453 | 19.980748% |
| D | 7272 | 5813 | 79.936744% |
Noise dominated data is calculated using 1-second bins in cleaned event files. If a bin has >2000 counts, and if more than 50% of those come from <1% of pixels, then it is considered to be noise-dominated and hence unusable.
| Quadrant | # 1 sec bins | Bins with >0 counts | Bins with >2000 counts | High rate bins dominated by noise | Noise dominated (total time) | Noise dominated (detector-on time) | Marked lightcurve |
|---|---|---|---|---|---|---|---|
| A | 7316 | 7272 | 1657 | 1657 | 22.65% | 22.79% | 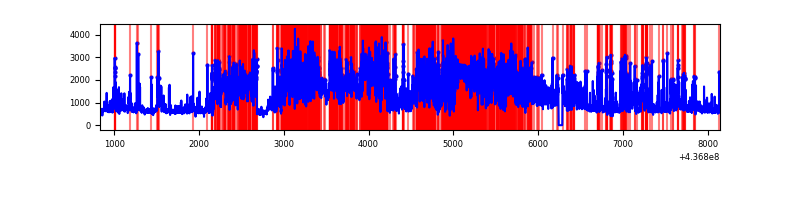 |
| B | 7316 | 7272 | 244 | 244 | 3.34% | 3.36% | 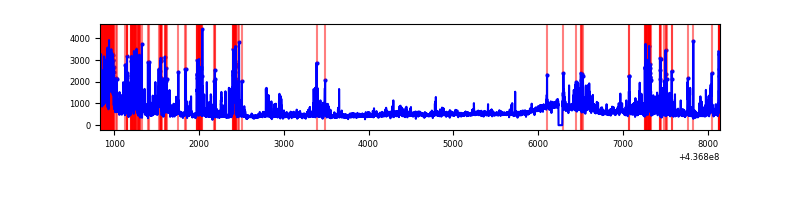 |
| C | 7317 | 7273 | 1465 | 1465 | 20.02% | 20.14% | 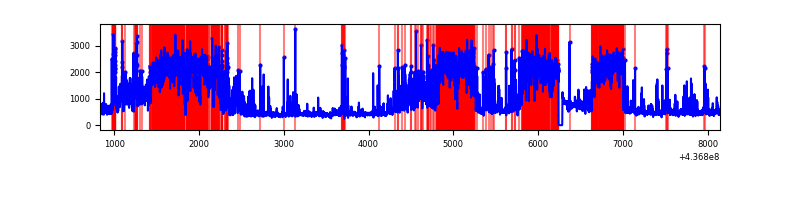 |
| D | 7316 | 7271 | 5077 | 5077 | 69.40% | 69.83% | 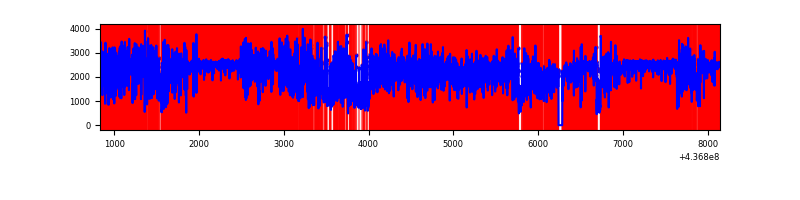 |
Top three noisy pixels from each quadrant. If the there are fewer than three noisy pixels in the level2.evt file, extra rows are filled as -1
| Pixel properties | Quadrant properties | ||||||
|---|---|---|---|---|---|---|---|
| Quadrant | DetID | PixID | Counts | Sigma | Mean | Median | Sigma |
| A | 15 | 223 | 5179407 | 31932.46 | 774 | 758 | 162.2 |
| A | 10 | 83 | 899868 | 5544.07 | 774 | 758 | 162.2 |
| A | 14 | 254 | 388669 | 2391.93 | 774 | 758 | 162.2 |
| B | 0 | 200 | 847914 | 4953.47 | 852 | 828 | 171.0 |
| B | 5 | 235 | 495136 | 2890.55 | 852 | 828 | 171.0 |
| B | 0 | 183 | 122450 | 711.2 | 852 | 828 | 171.0 |
| C | 15 | 174 | 4012628 | 21406.43 | 793 | 799 | 187.4 |
| C | 15 | 190 | 243020 | 1292.45 | 793 | 799 | 187.4 |
| C | 14 | 254 | 237900 | 1265.13 | 793 | 799 | 187.4 |
| D | 10 | 102 | 11527032 | 84413.61 | 524 | 506 | 136.5 |
| D | 1 | 52 | 603470 | 4415.76 | 524 | 506 | 136.5 |
| D | 5 | 235 | 282870 | 2067.87 | 524 | 506 | 136.5 |
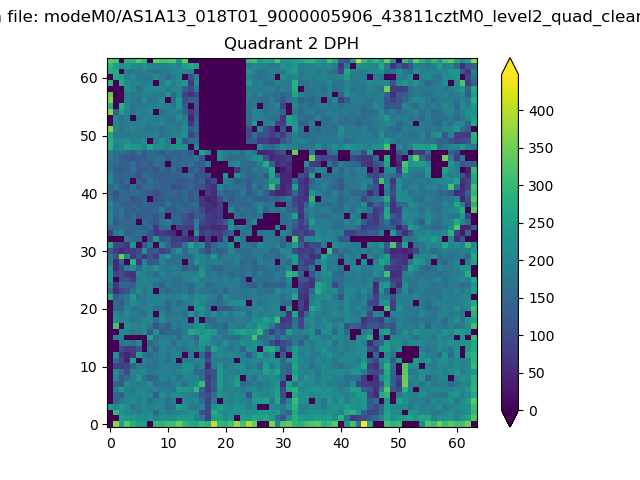
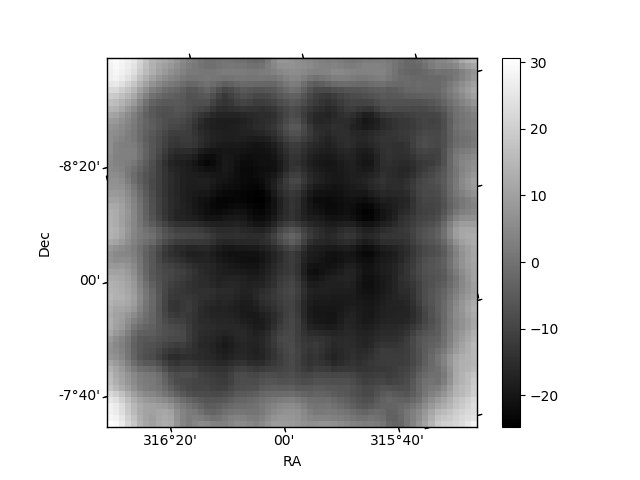
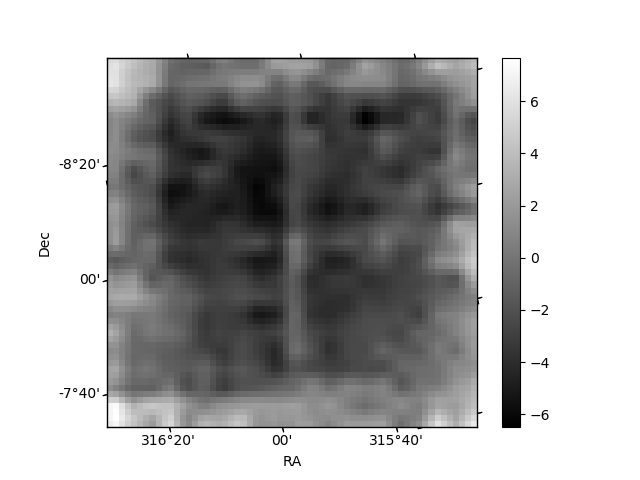
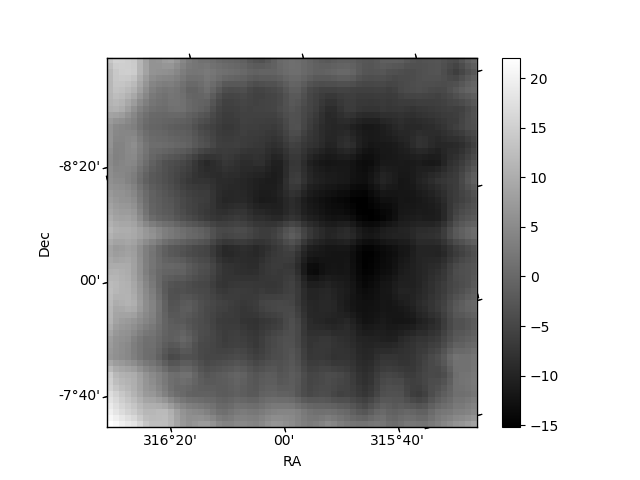
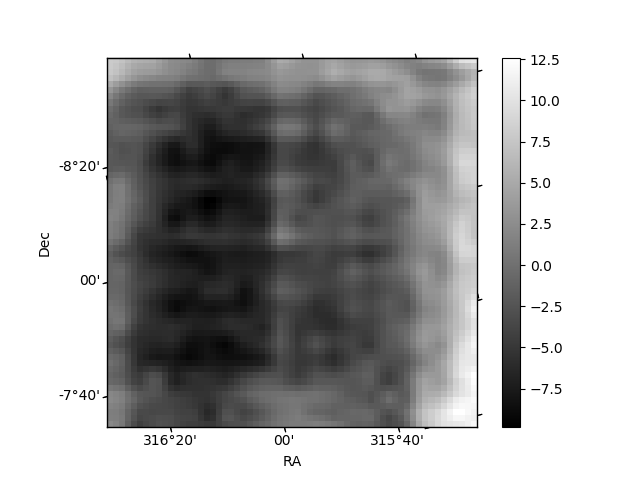
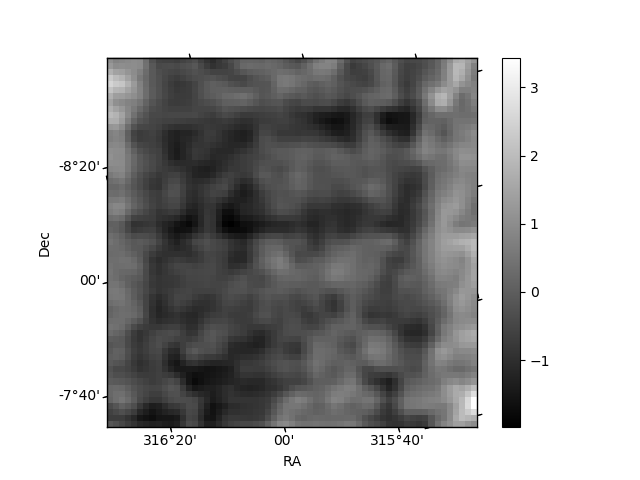
Histogram calculated using DETX and DETY for each event in the final _common_clean file
| Quadrant A | 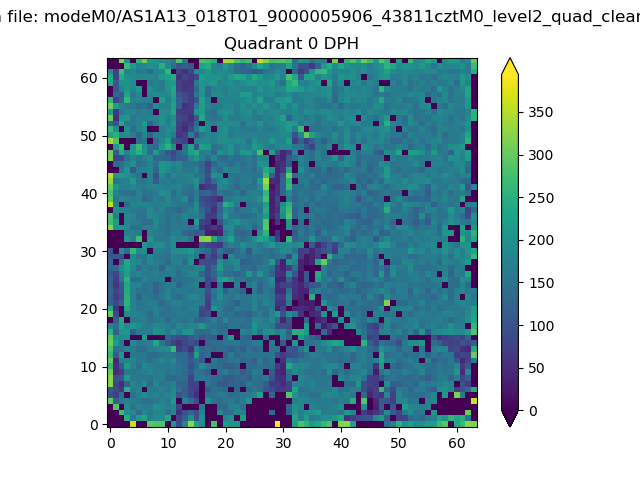 |
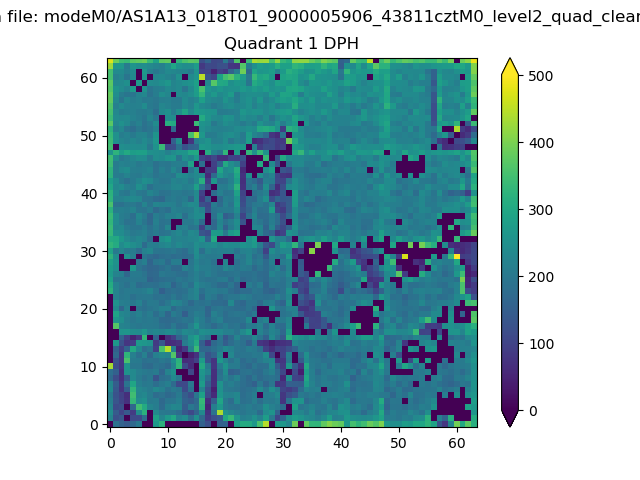 |
Quadrant B |
|---|---|---|---|
| Quadrant D | 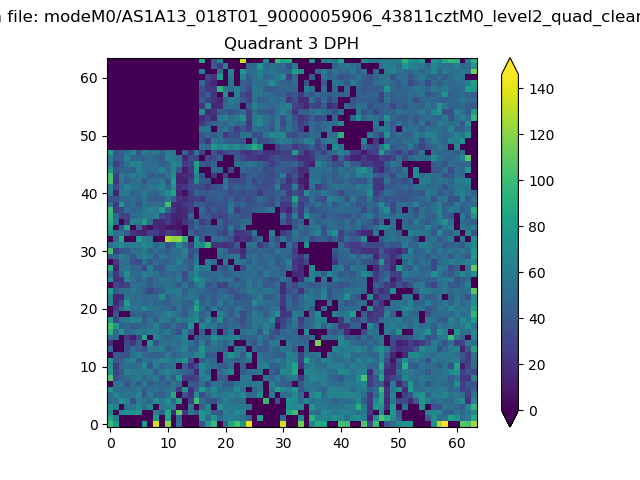 |
 |
Quadrant C |
| Plot type | Count rate plots | Images |
|---|---|---|
| Comparison with Poisson distribution Blue bars denote a histogram of data divided into 1 sec bins. Red curve is a Poisson curve with rate = median count rate of data. |
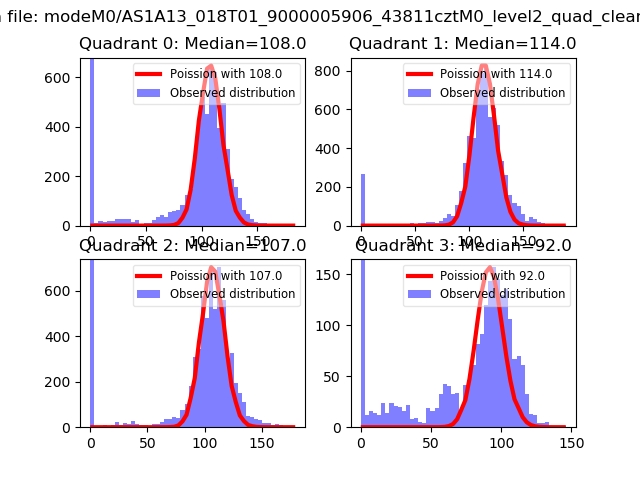 |
 |
| Quadrant-wise count rates Data is divided into 100 sec bins |
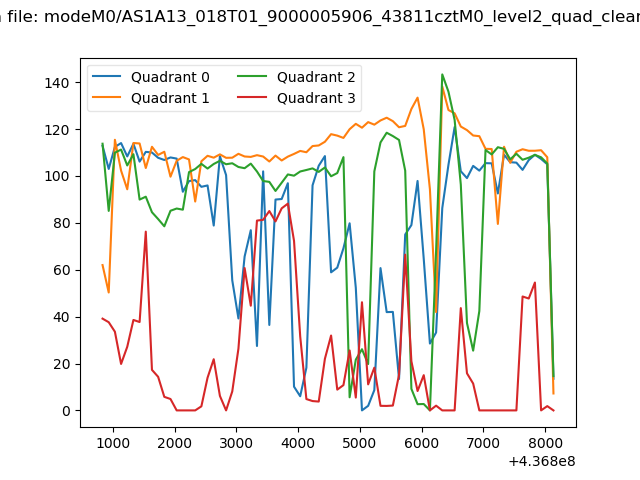 |
|
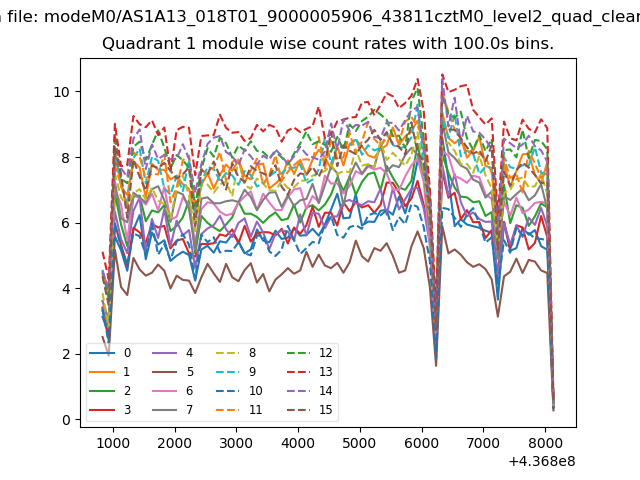
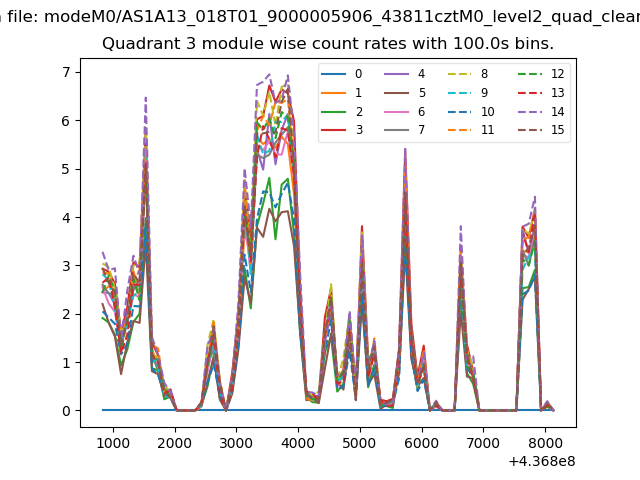
| Module-wise count rates for Quadrant A Data is divided into 100 sec bins |
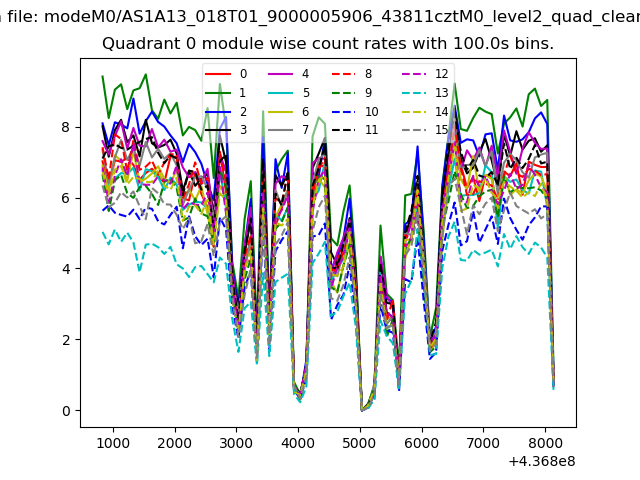 |
 |
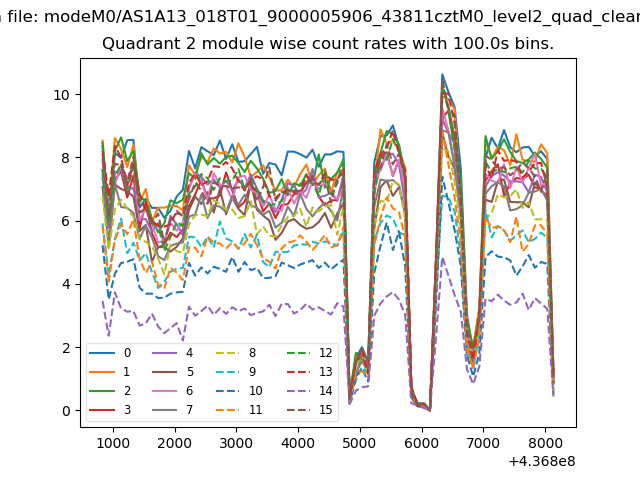
| Module-wise count rates for Quadrant B Data is divided into 100 sec bins |
 |
 |
| Module-wise count rates for Quadrant C Data is divided into 100 sec bins |
 |
 |
| Module-wise count rates for Quadrant D Data is divided into 100 sec bins |
 |
 |
| Parameter | Plot |
|---|---|
| CZT HV Monitor | 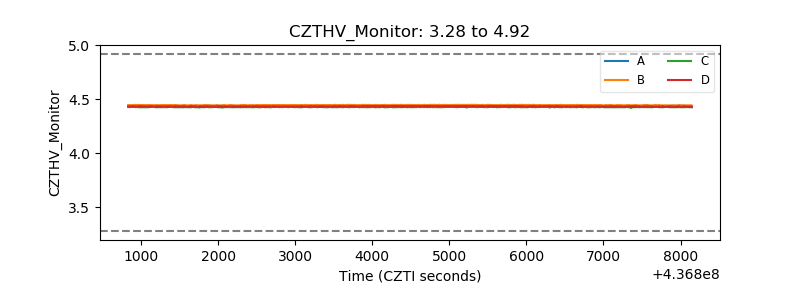 |
| D_VDD | 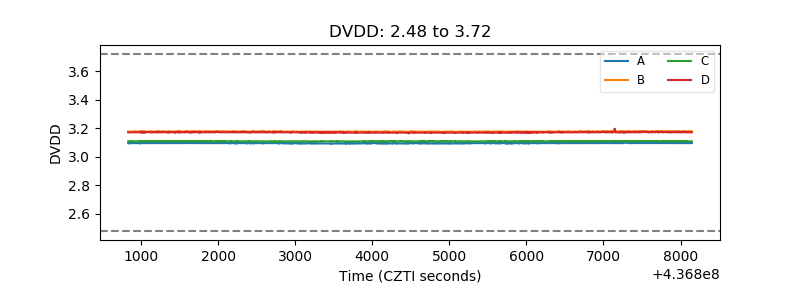 |
| Temperature 1 | 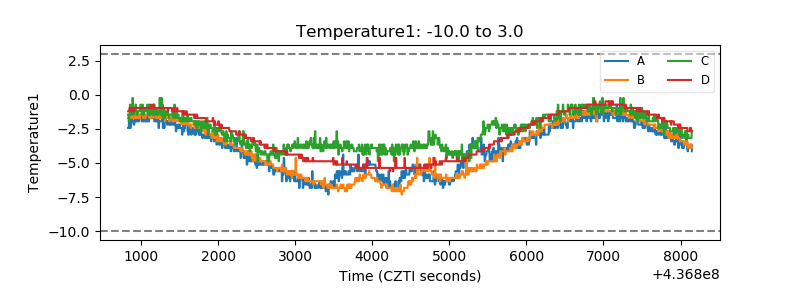 |
| Veto HV Monitor | 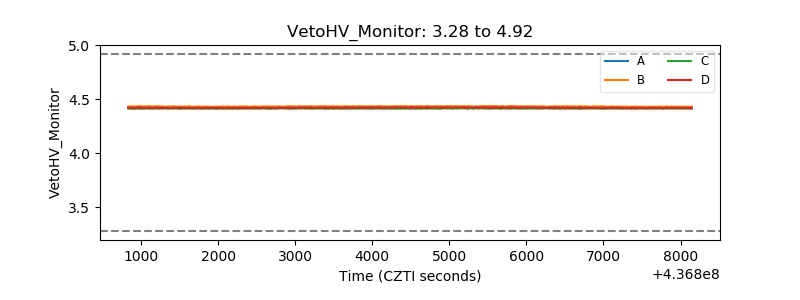 |
| Veto LLD | 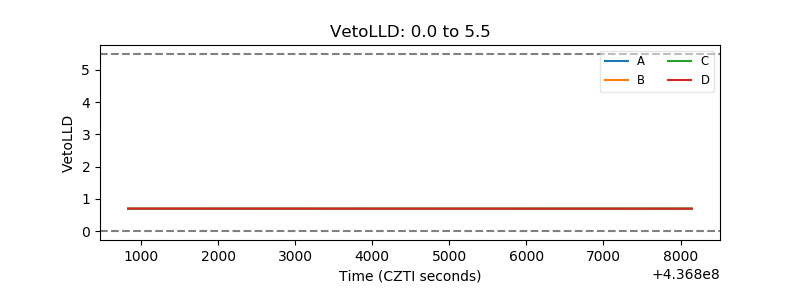 |
| Alpha Counter | 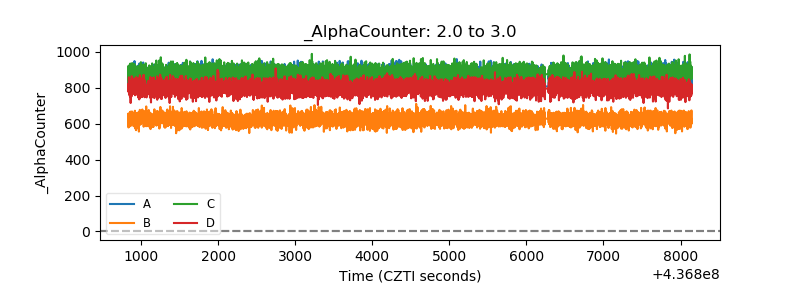 |
| _CPM_Rate | 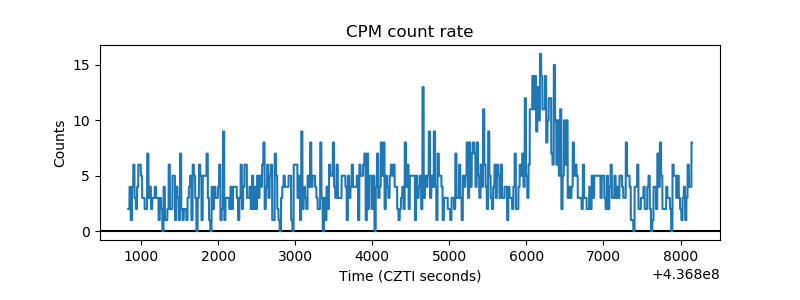 |
| CZT Counter | 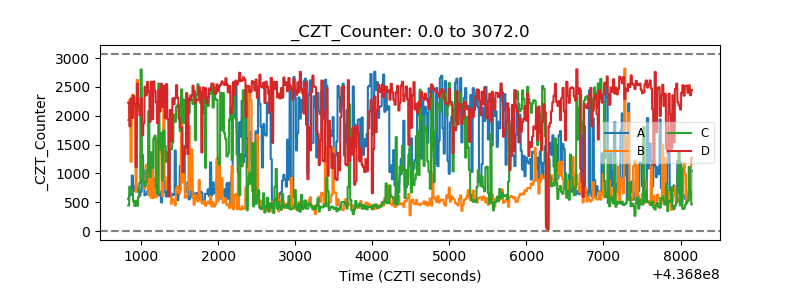 |
| +2.5 Volts monitor | 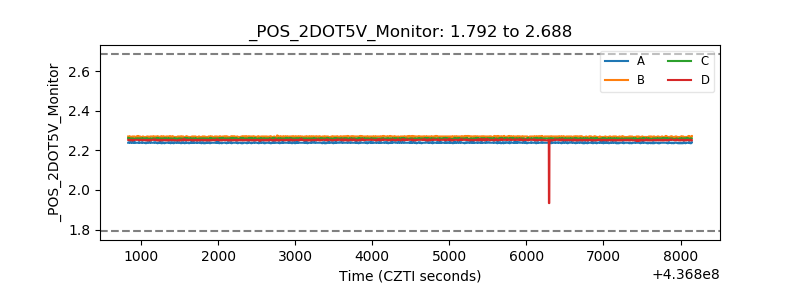 |
| +5 Volts monitor | 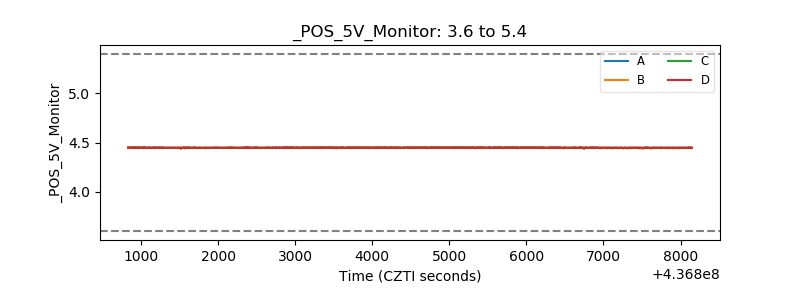 |
| _ROLL_ROT | 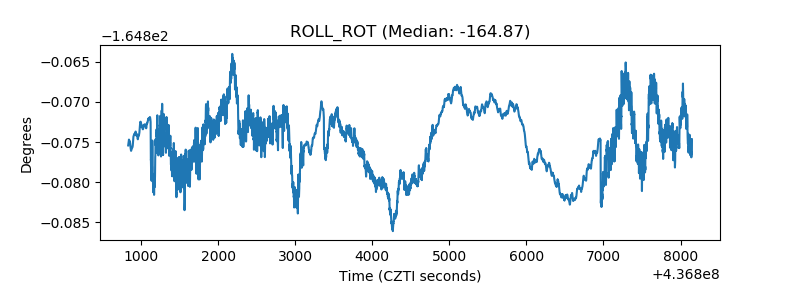 |
| _Roll_DEC | 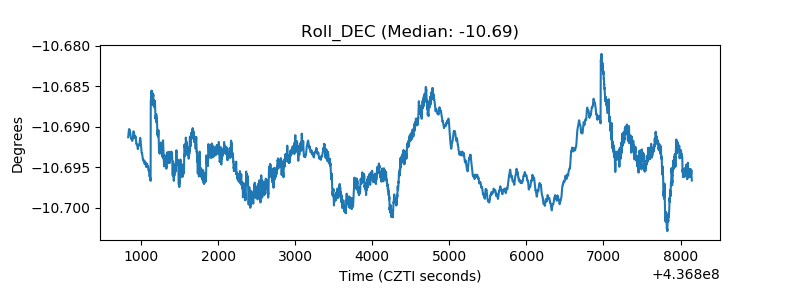 |
| _Roll_RA | 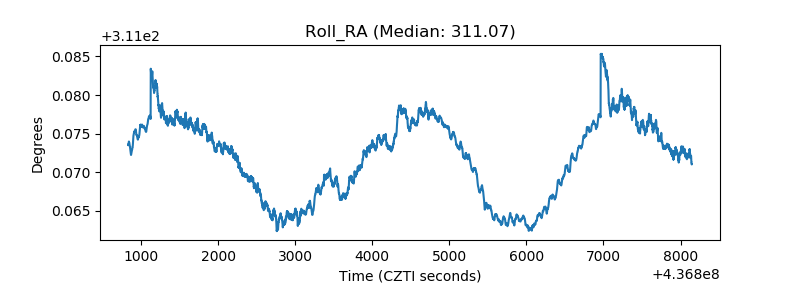 |
| Veto Counter | 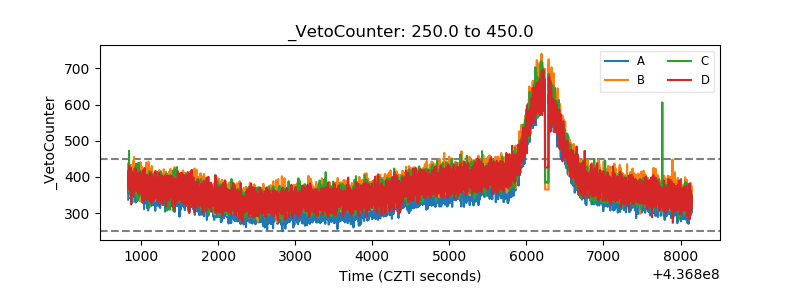 |