| Param | Original file | Final file |
|---|---|---|
| Filename | modeM0/AS1A13_018T01_9000005906_43812cztM0_level2.fits | modeM0/AS1A13_018T01_9000005906_43812cztM0_level2_quad_clean.evt |
| Size (bytes) | 853,914,240 | 108,521,280 |
| Size | 814.4 MB | 103.5 MB |
| Events in quadrant A | 6,385,761 | 765,048 |
| Events in quadrant B | 5,126,373 | 820,671 |
| Events in quadrant C | 9,570,243 | 619,517 |
| Events in quadrant D | 9,949,251 | 560,333 |
| Mode M0 | |||
|---|---|---|---|
| Quadrant | BADHDUFLAG | Total packets | Discarded packets |
| A | 0 | 24532 | 0 |
| B | 0 | 20242 | 0 |
| C | 0 | 33548 | 2 |
| D | 0 | 34660 | 0 |
| Mode SS | |||
|---|---|---|---|
| Quadrant | BADHDUFLAG | Total packets | Discarded packets |
| A | 0 | 150 | 0 |
| B | 0 | 150 | 0 |
| C | 0 | 150 | 0 |
| D | 0 | 150 | 0 |
| Quadrant | Total seconds | Saturated seconds | Saturation percentage |
|---|---|---|---|
| A | 7468 | 629 | 8.422603% |
| B | 7469 | 370 | 4.953809% |
| C | 7468 | 2047 | 27.410284% |
| D | 7468 | 2113 | 28.294055% |
Noise dominated data is calculated using 1-second bins in cleaned event files. If a bin has >2000 counts, and if more than 50% of those come from <1% of pixels, then it is considered to be noise-dominated and hence unusable.
| Quadrant | # 1 sec bins | Bins with >0 counts | Bins with >2000 counts | High rate bins dominated by noise | Noise dominated (total time) | Noise dominated (detector-on time) | Marked lightcurve |
|---|---|---|---|---|---|---|---|
| A | 7468 | 7468 | 451 | 451 | 6.04% | 6.04% | 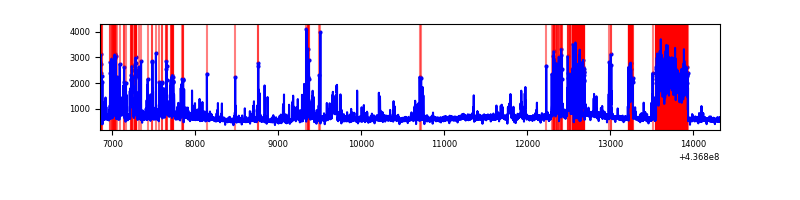 |
| B | 7469 | 7469 | 197 | 197 | 2.64% | 2.64% | 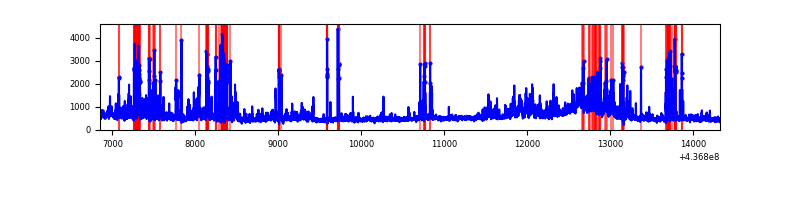 |
| C | 7468 | 7468 | 1847 | 1847 | 24.73% | 24.73% | 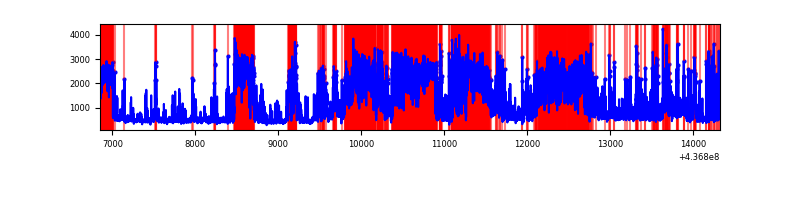 |
| D | 7468 | 7468 | 1961 | 1961 | 26.26% | 26.26% | 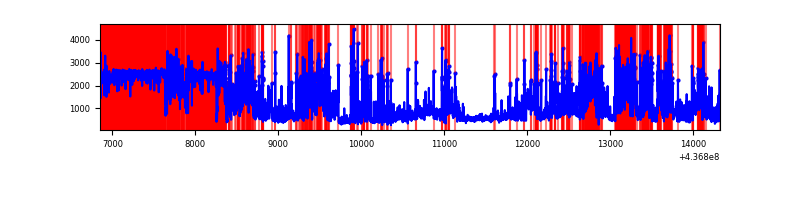 |
Top three noisy pixels from each quadrant. If the there are fewer than three noisy pixels in the level2.evt file, extra rows are filled as -1
| Pixel properties | Quadrant properties | ||||||
|---|---|---|---|---|---|---|---|
| Quadrant | DetID | PixID | Counts | Sigma | Mean | Median | Sigma |
| A | 15 | 223 | 1695077 | 9735.93 | 835 | 817 | 174.0 |
| A | 10 | 83 | 1020508 | 5859.58 | 835 | 817 | 174.0 |
| A | 13 | 248 | 155488 | 888.8 | 835 | 817 | 174.0 |
| B | 0 | 200 | 705996 | 4238.26 | 844 | 821 | 166.4 |
| B | 5 | 172 | 322513 | 1933.44 | 844 | 821 | 166.4 |
| B | 4 | 170 | 223572 | 1338.78 | 844 | 821 | 166.4 |
| C | 15 | 174 | 4673395 | 25849.22 | 763 | 769 | 180.8 |
| C | 15 | 158 | 851649 | 4707.11 | 763 | 769 | 180.8 |
| C | 3 | 233 | 300380 | 1657.46 | 763 | 769 | 180.8 |
| D | 10 | 102 | 3268382 | 17895.85 | 719 | 696 | 182.6 |
| D | 1 | 52 | 1976867 | 10822.72 | 719 | 696 | 182.6 |
| D | 5 | 235 | 427775 | 2338.95 | 719 | 696 | 182.6 |
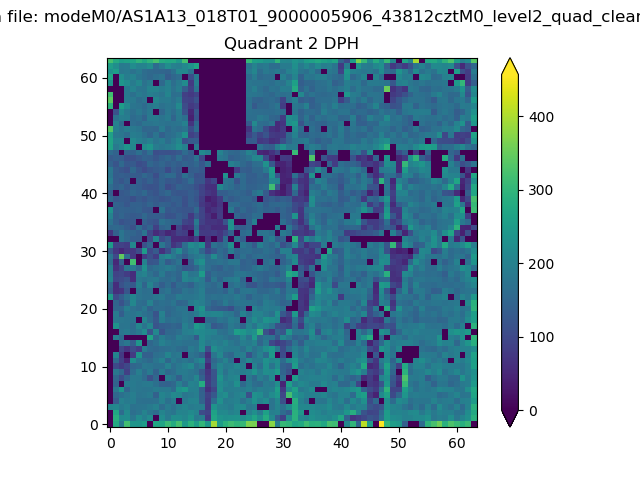
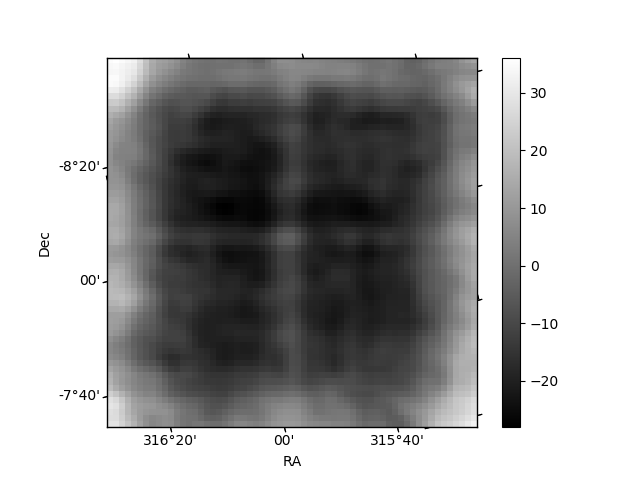
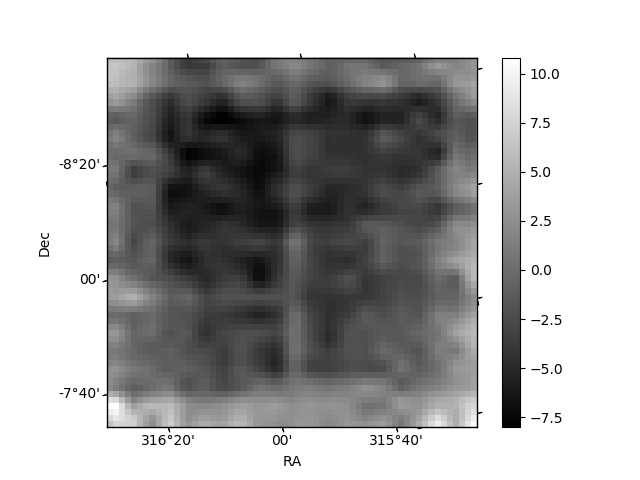
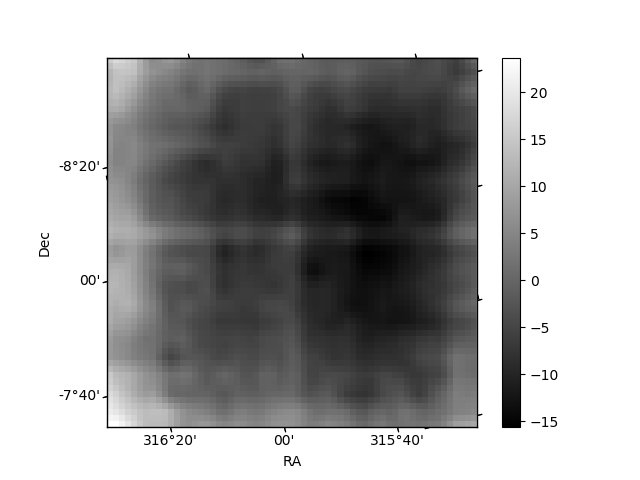
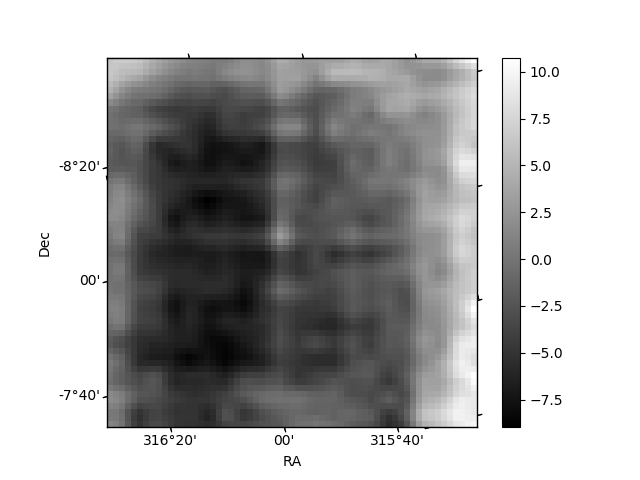
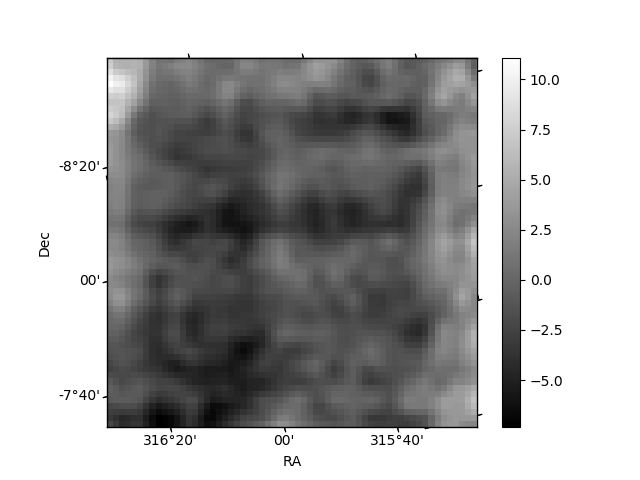
Histogram calculated using DETX and DETY for each event in the final _common_clean file
| Quadrant A | 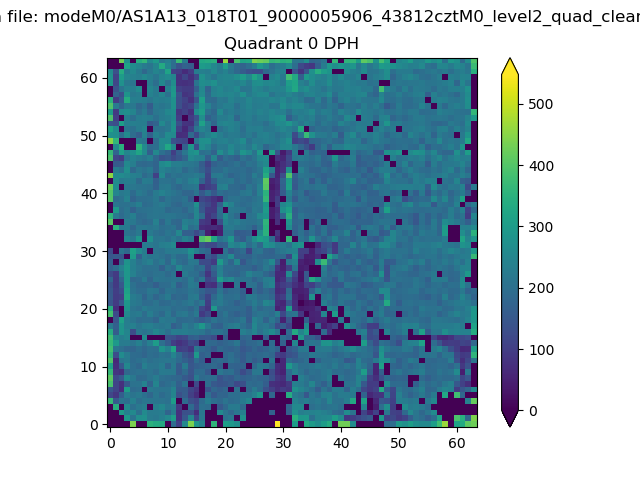 |
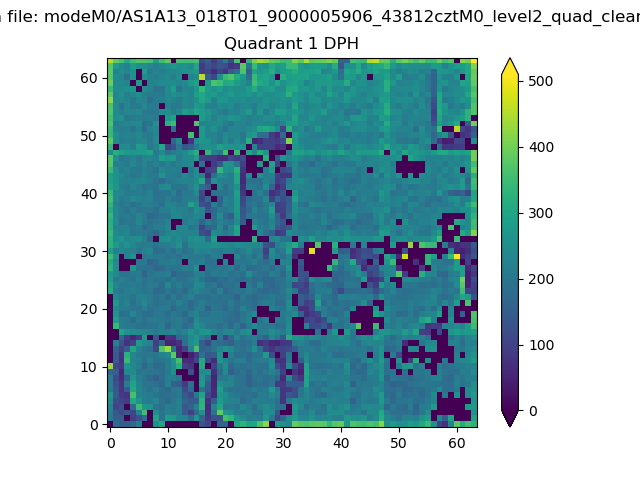 |
Quadrant B |
|---|---|---|---|
| Quadrant D | 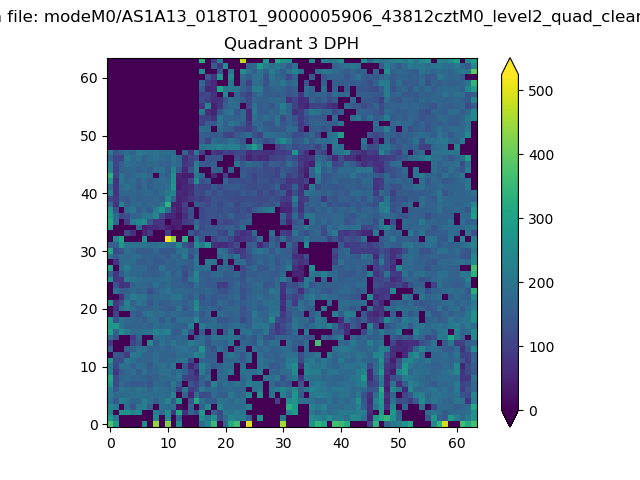 |
 |
Quadrant C |
| Plot type | Count rate plots | Images |
|---|---|---|
| Comparison with Poisson distribution Blue bars denote a histogram of data divided into 1 sec bins. Red curve is a Poisson curve with rate = median count rate of data. |
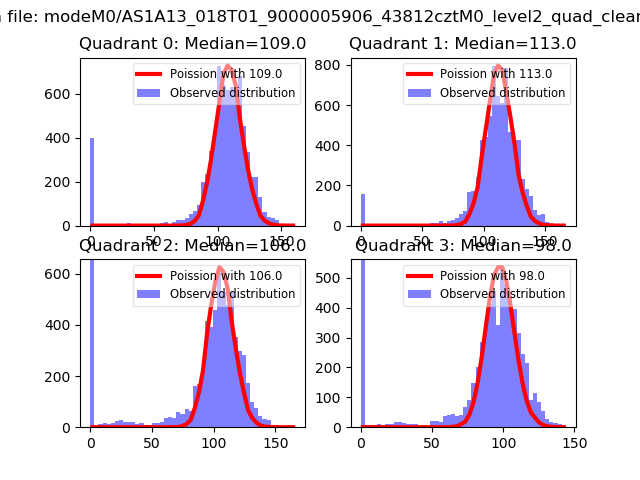 |
 |
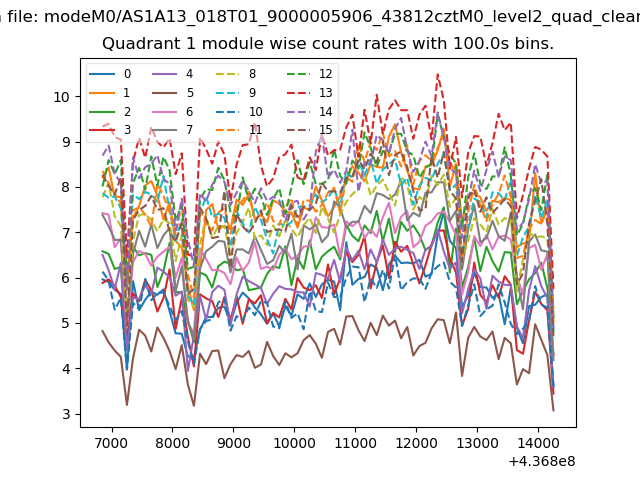
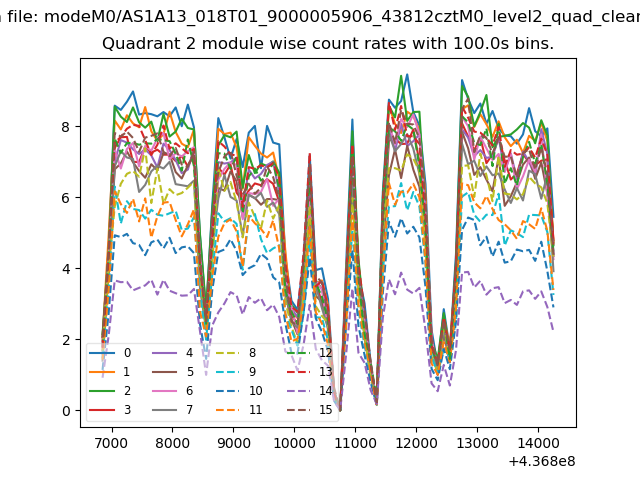
| Quadrant-wise count rates Data is divided into 100 sec bins |
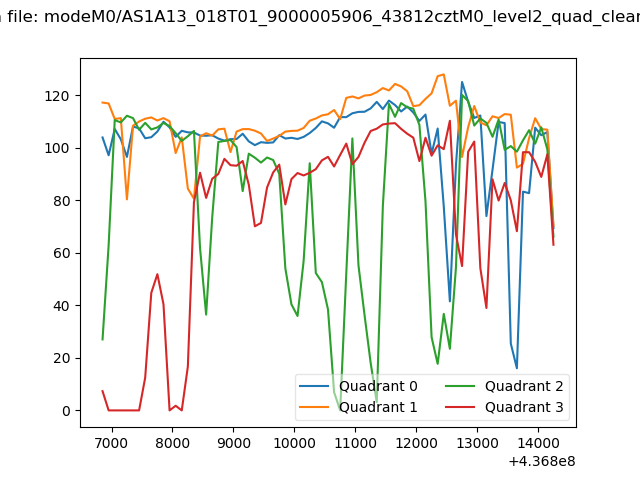 |
|
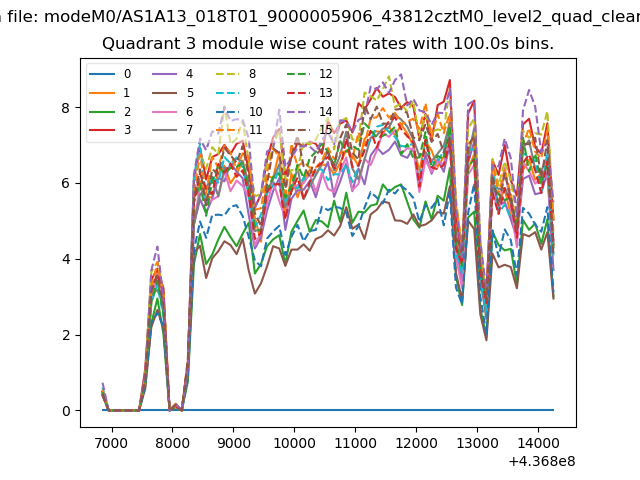
| Module-wise count rates for Quadrant A Data is divided into 100 sec bins |
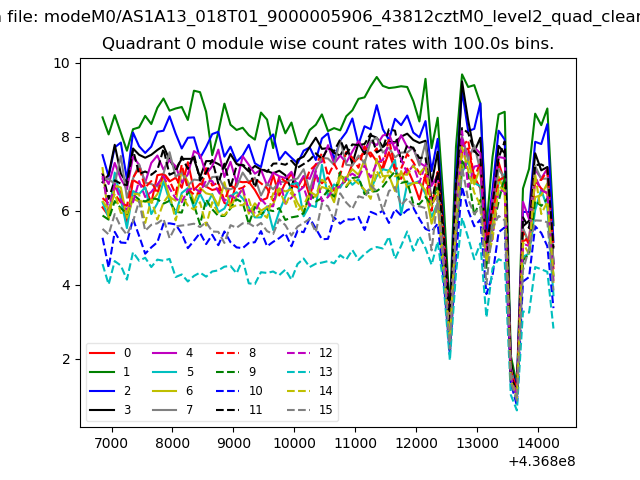 |
 |
| Module-wise count rates for Quadrant B Data is divided into 100 sec bins |
 |
 |
| Module-wise count rates for Quadrant C Data is divided into 100 sec bins |
 |
 |
| Module-wise count rates for Quadrant D Data is divided into 100 sec bins |
 |
 |
| Parameter | Plot |
|---|---|
| CZT HV Monitor | 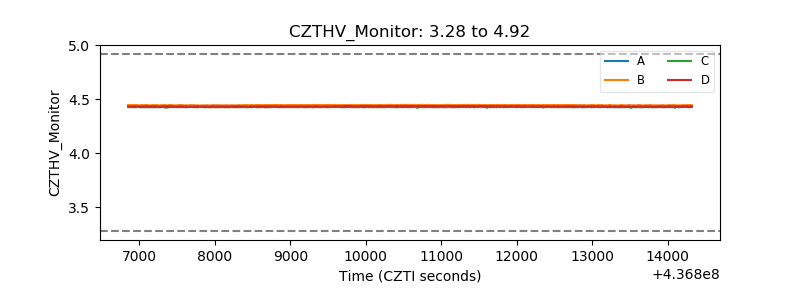 |
| D_VDD | 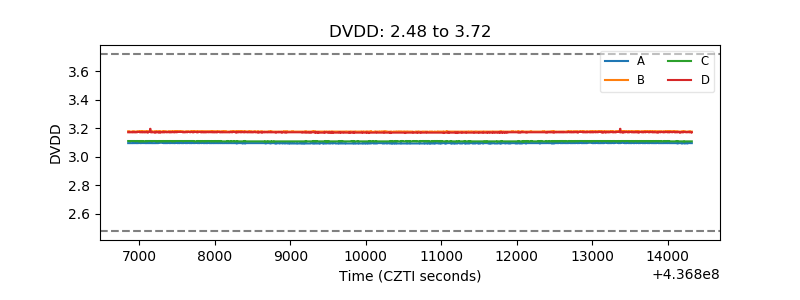 |
| Temperature 1 | 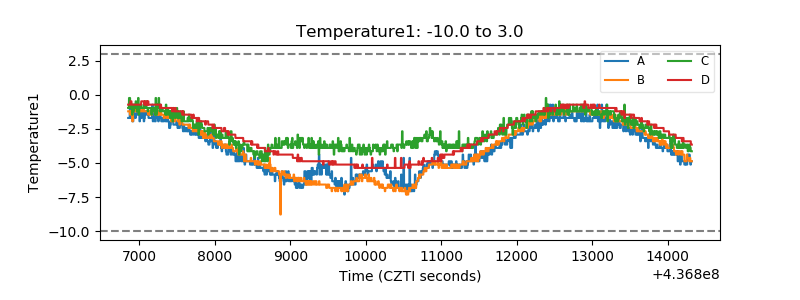 |
| Veto HV Monitor | 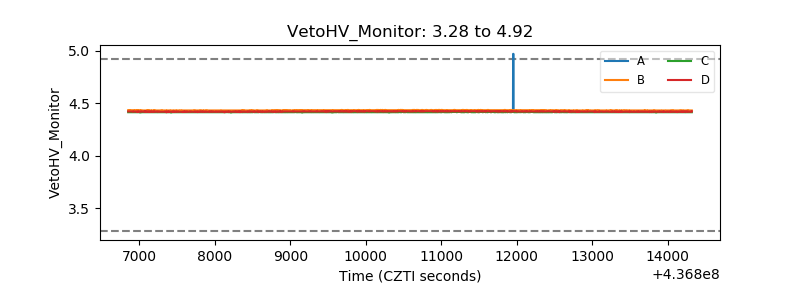 |
| Veto LLD | 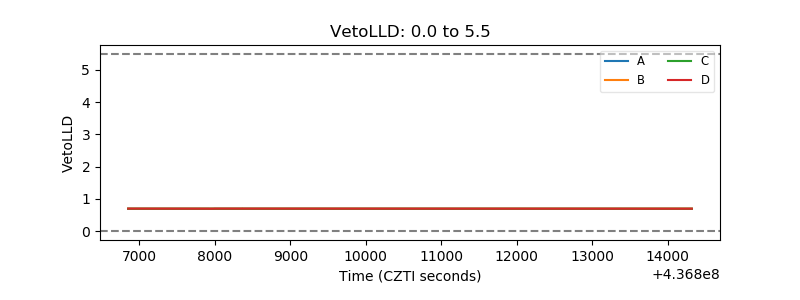 |
| Alpha Counter | 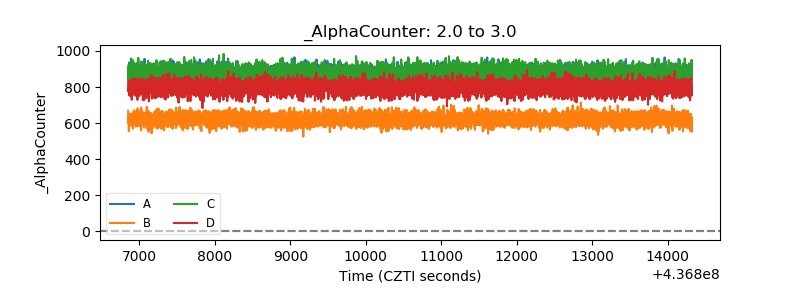 |
| _CPM_Rate | 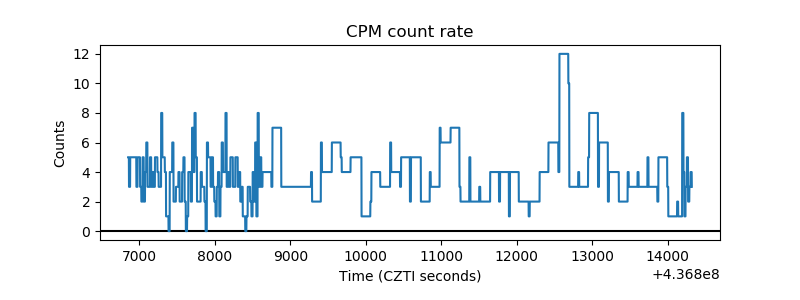 |
| CZT Counter | 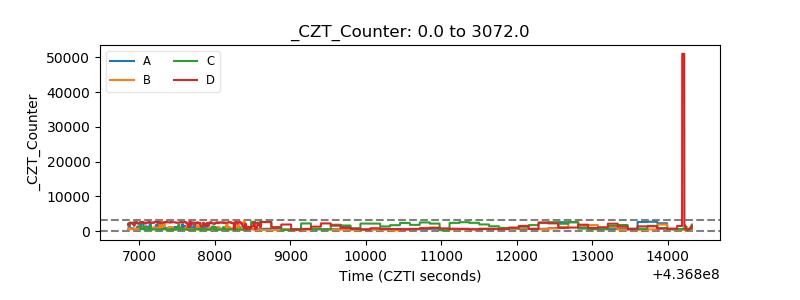 |
| +2.5 Volts monitor | 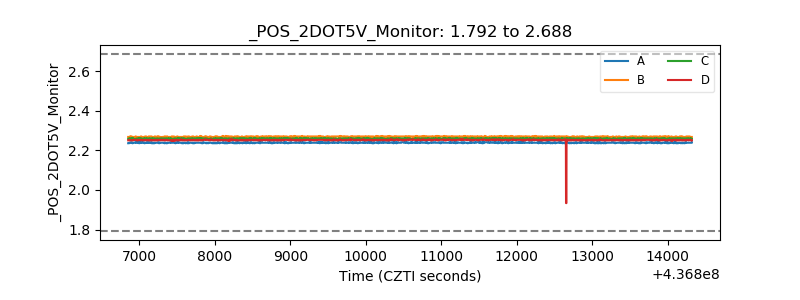 |
| +5 Volts monitor | 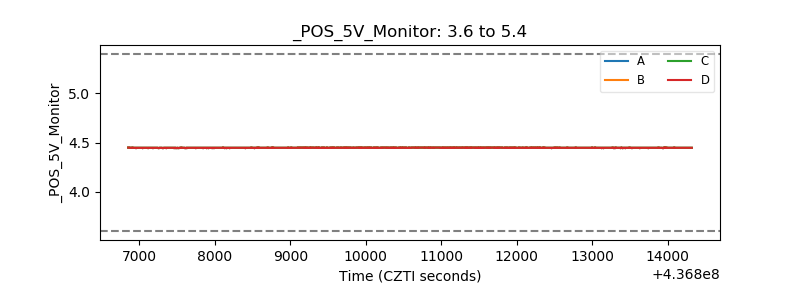 |
| _ROLL_ROT | 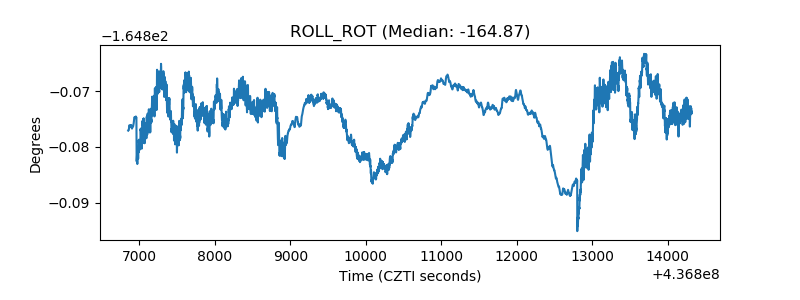 |
| _Roll_DEC | 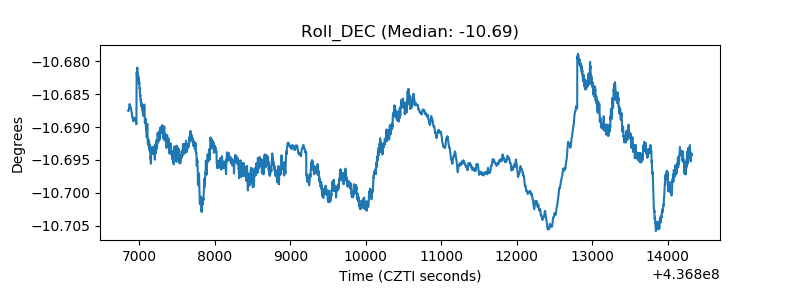 |
| _Roll_RA | 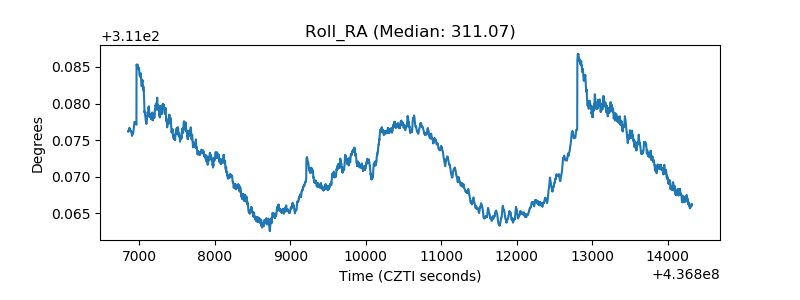 |
| Veto Counter | 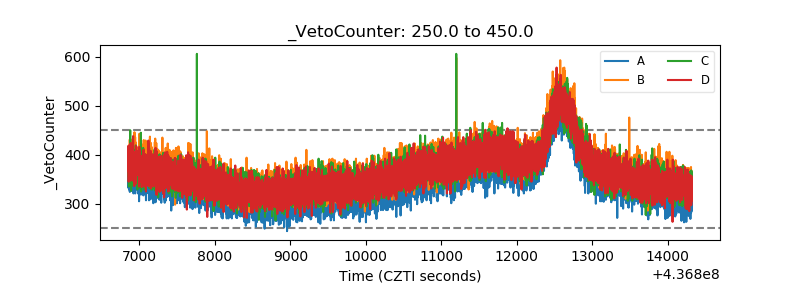 |