| Param | Original file | Final file |
|---|---|---|
| Filename | modeM0/AS1A13_018T01_9000005906_43813cztM0_level2.fits | modeM0/AS1A13_018T01_9000005906_43813cztM0_level2_quad_clean.evt |
| Size (bytes) | 853,214,400 | 116,640,000 |
| Size | 813.7 MB | 111.2 MB |
| Events in quadrant A | 6,017,748 | 826,315 |
| Events in quadrant B | 5,819,133 | 840,621 |
| Events in quadrant C | 11,488,890 | 597,296 |
| Events in quadrant D | 7,650,772 | 721,151 |
| Mode M0 | |||
|---|---|---|---|
| Quadrant | BADHDUFLAG | Total packets | Discarded packets |
| A | 0 | 23506 | 0 |
| B | 0 | 22660 | 0 |
| C | 0 | 39514 | 0 |
| D | 0 | 28105 | 0 |
| Mode SS | |||
|---|---|---|---|
| Quadrant | BADHDUFLAG | Total packets | Discarded packets |
| A | 0 | 156 | 0 |
| B | 0 | 156 | 0 |
| C | 0 | 156 | 0 |
| D | 0 | 156 | 0 |
| Quadrant | Total seconds | Saturated seconds | Saturation percentage |
|---|---|---|---|
| A | 7849 | 442 | 5.631291% |
| B | 7850 | 620 | 7.898089% |
| C | 7850 | 2677 | 34.101911% |
| D | 7850 | 808 | 10.292994% |
Noise dominated data is calculated using 1-second bins in cleaned event files. If a bin has >2000 counts, and if more than 50% of those come from <1% of pixels, then it is considered to be noise-dominated and hence unusable.
| Quadrant | # 1 sec bins | Bins with >0 counts | Bins with >2000 counts | High rate bins dominated by noise | Noise dominated (total time) | Noise dominated (detector-on time) | Marked lightcurve |
|---|---|---|---|---|---|---|---|
| A | 7849 | 7849 | 336 | 336 | 4.28% | 4.28% | 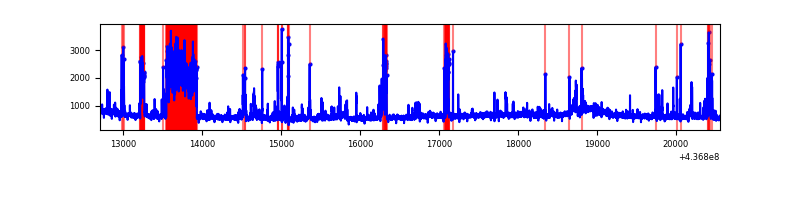 |
| B | 7850 | 7850 | 309 | 309 | 3.94% | 3.94% | 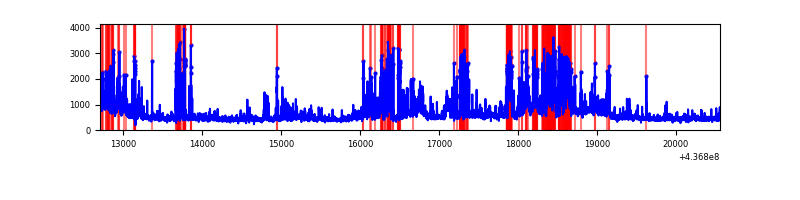 |
| C | 7850 | 7850 | 2483 | 2483 | 31.63% | 31.63% | 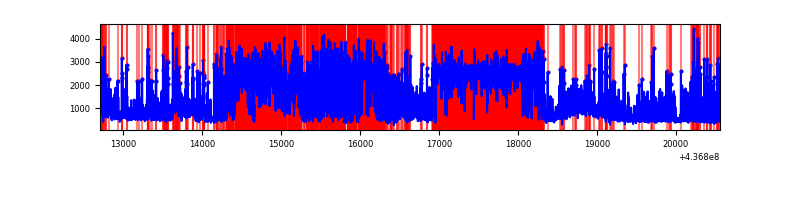 |
| D | 7850 | 7850 | 708 | 708 | 9.02% | 9.02% | 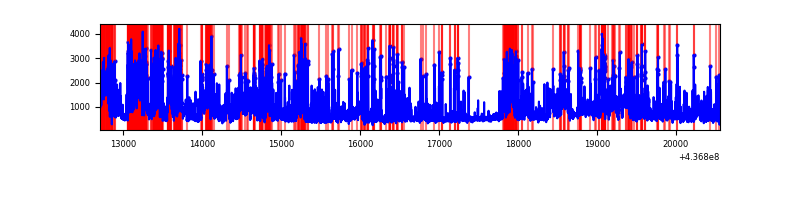 |
Top three noisy pixels from each quadrant. If the there are fewer than three noisy pixels in the level2.evt file, extra rows are filled as -1
| Pixel properties | Quadrant properties | ||||||
|---|---|---|---|---|---|---|---|
| Quadrant | DetID | PixID | Counts | Sigma | Mean | Median | Sigma |
| A | 15 | 223 | 1141513 | 6078.43 | 896 | 878 | 187.7 |
| A | 10 | 83 | 1105859 | 5888.43 | 896 | 878 | 187.7 |
| A | 13 | 248 | 130917 | 692.98 | 896 | 878 | 187.7 |
| B | 0 | 200 | 861142 | 4844.02 | 890 | 861 | 177.6 |
| B | 5 | 235 | 758518 | 4266.17 | 890 | 861 | 177.6 |
| B | 5 | 172 | 311969 | 1751.77 | 890 | 861 | 177.6 |
| C | 15 | 174 | 5450105 | 30577.91 | 755 | 759 | 178.2 |
| C | 15 | 158 | 1558179 | 8739.15 | 755 | 759 | 178.2 |
| C | 15 | 190 | 517796 | 2901.25 | 755 | 759 | 178.2 |
| D | 1 | 52 | 1655771 | 7603.61 | 860 | 835 | 217.7 |
| D | 12 | 233 | 470031 | 2155.72 | 860 | 835 | 217.7 |
| D | 5 | 235 | 417068 | 1912.39 | 860 | 835 | 217.7 |
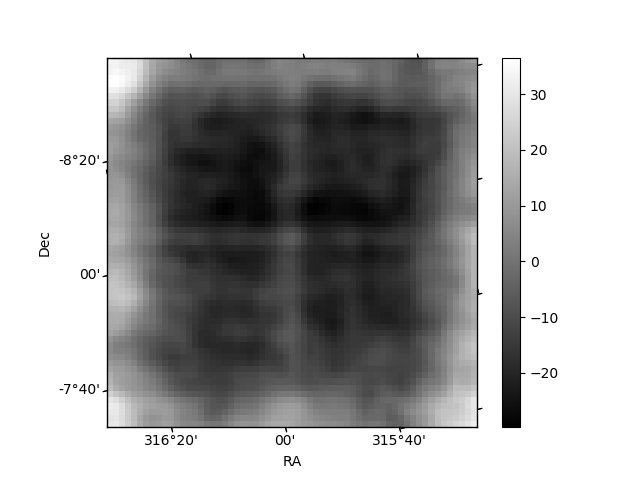
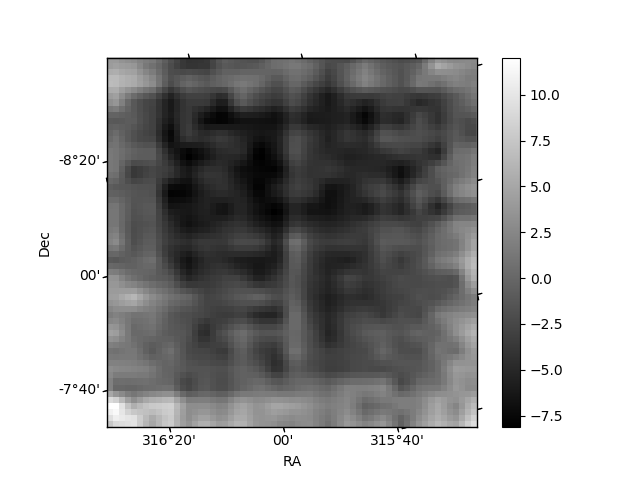
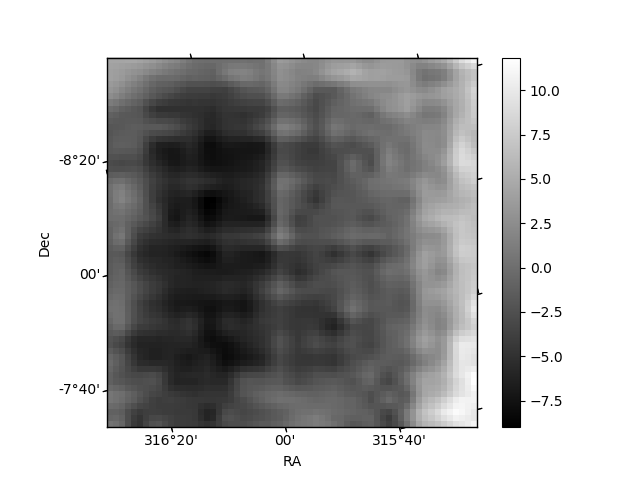
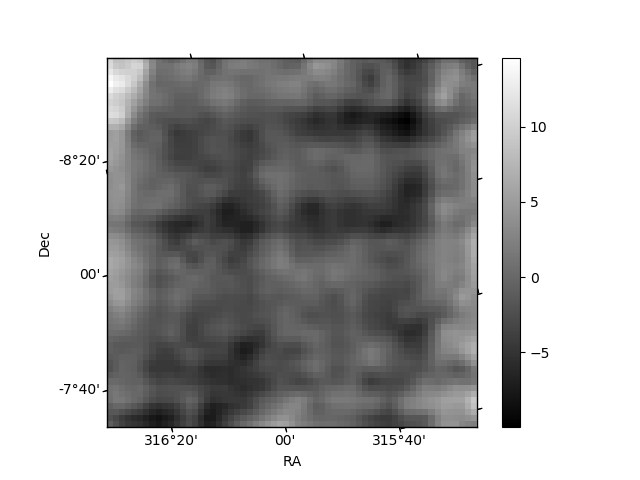
Histogram calculated using DETX and DETY for each event in the final _common_clean file
| Quadrant A | 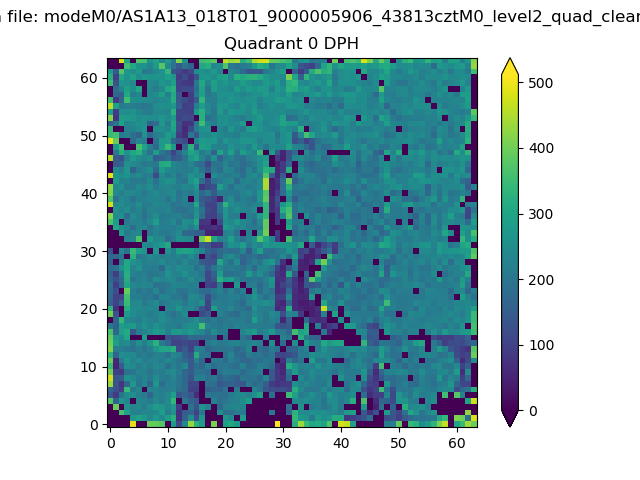 |
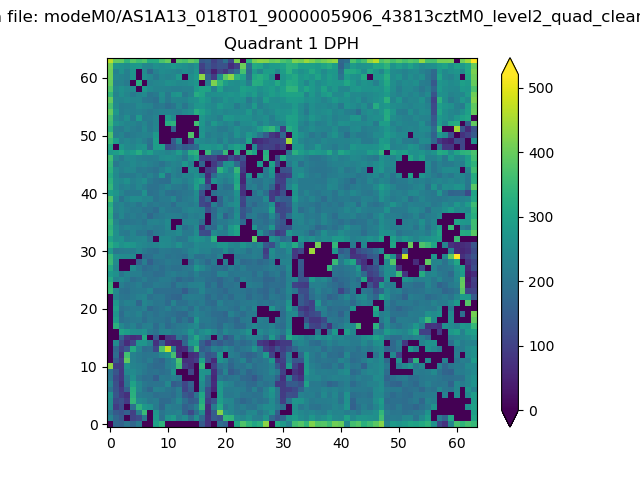 |
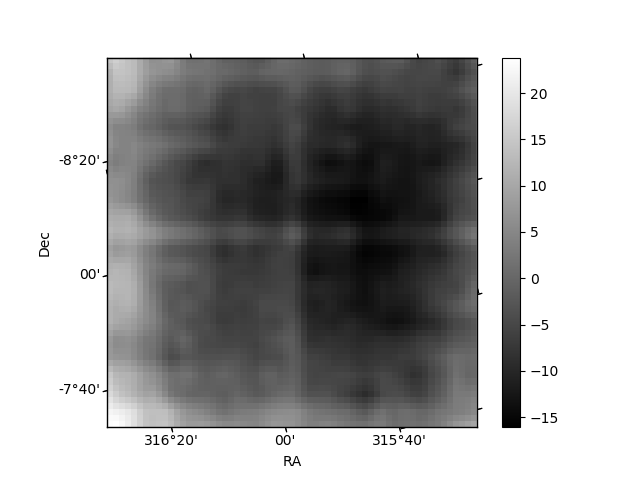
Quadrant B |
|---|---|---|---|
| Quadrant D | 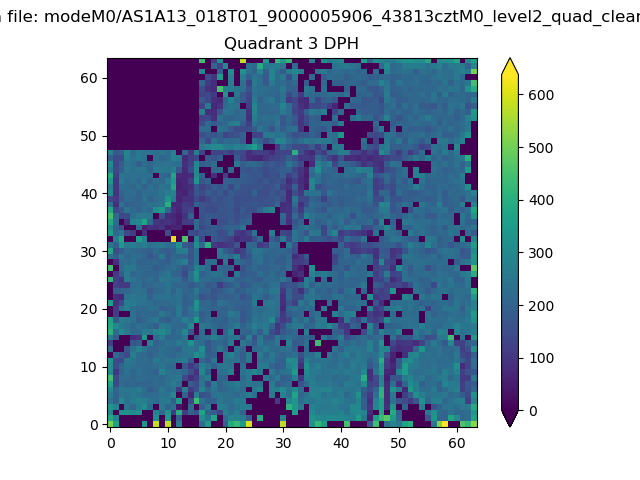 |
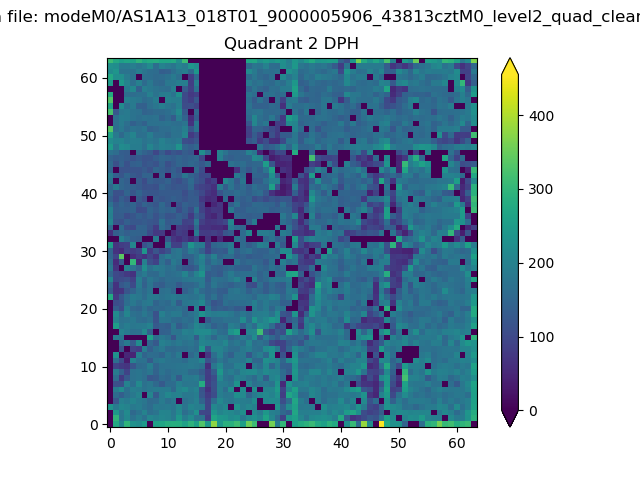 |
Quadrant C |
| Plot type | Count rate plots | Images |
|---|---|---|
| Comparison with Poisson distribution Blue bars denote a histogram of data divided into 1 sec bins. Red curve is a Poisson curve with rate = median count rate of data. |
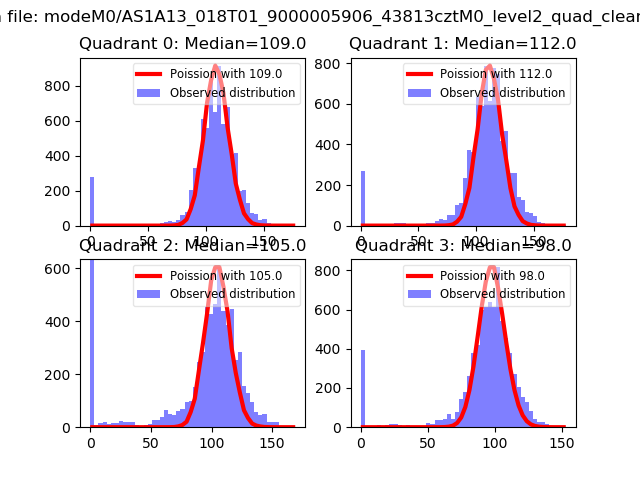 |
 |
| Quadrant-wise count rates Data is divided into 100 sec bins |
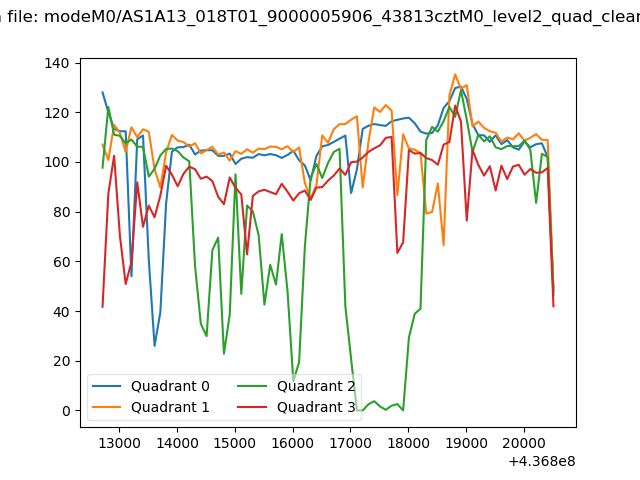 |
|
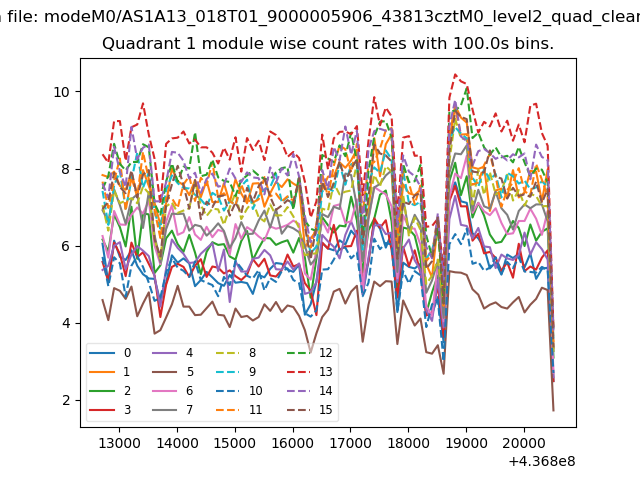
| Module-wise count rates for Quadrant A Data is divided into 100 sec bins |
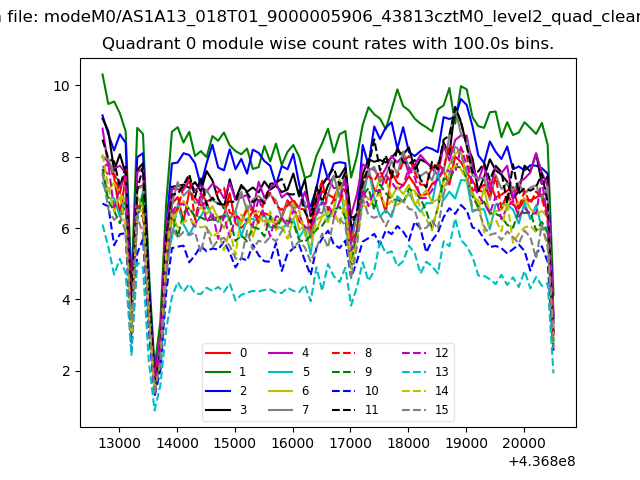 |
 |
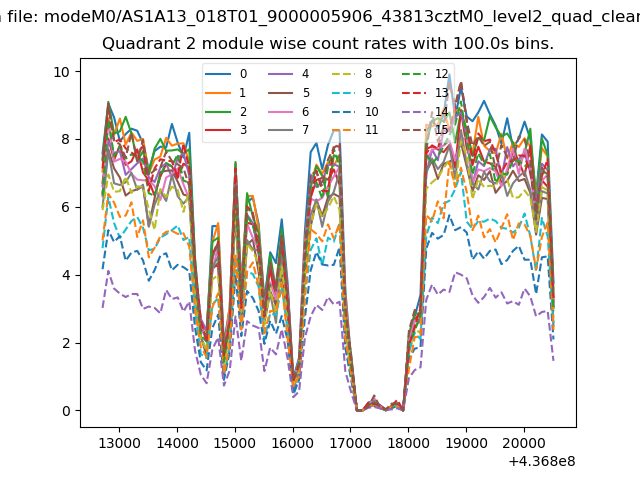
| Module-wise count rates for Quadrant B Data is divided into 100 sec bins |
 |
 |
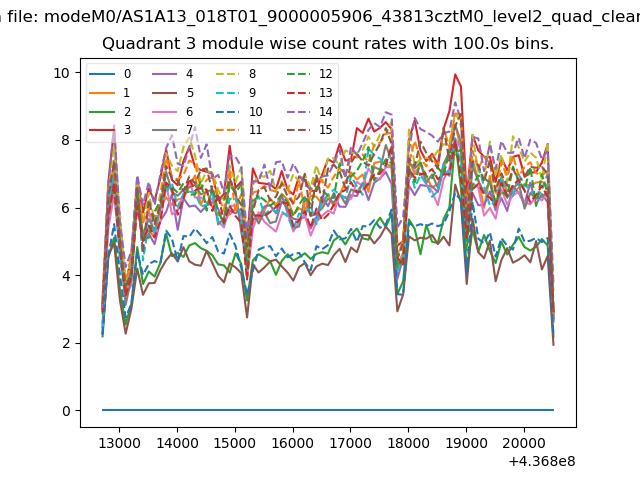
| Module-wise count rates for Quadrant C Data is divided into 100 sec bins |
 |
 |
| Module-wise count rates for Quadrant D Data is divided into 100 sec bins |
 |
 |
| Parameter | Plot |
|---|---|
| CZT HV Monitor | 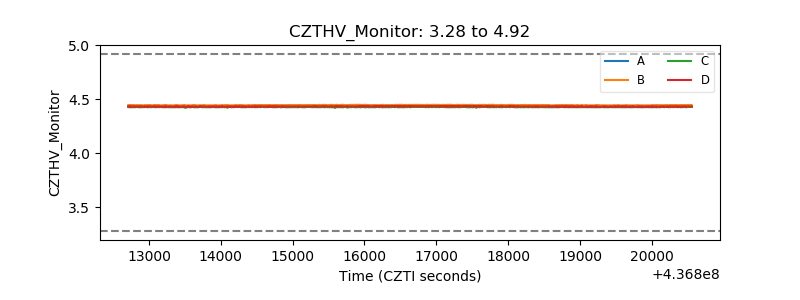 |
| D_VDD | 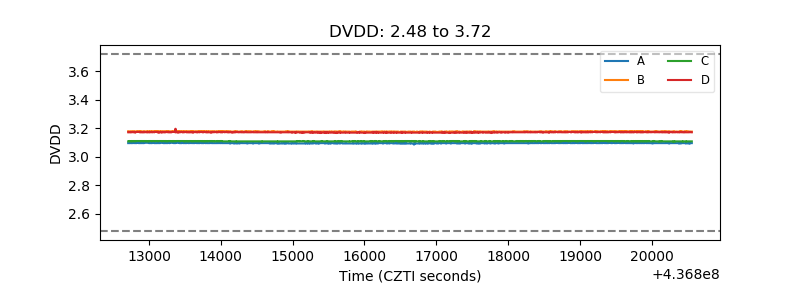 |
| Temperature 1 | 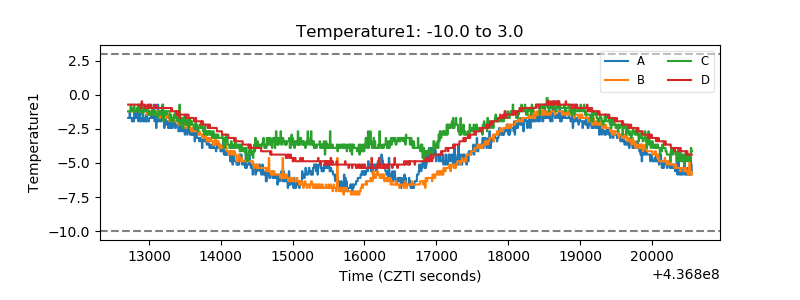 |
| Veto HV Monitor | 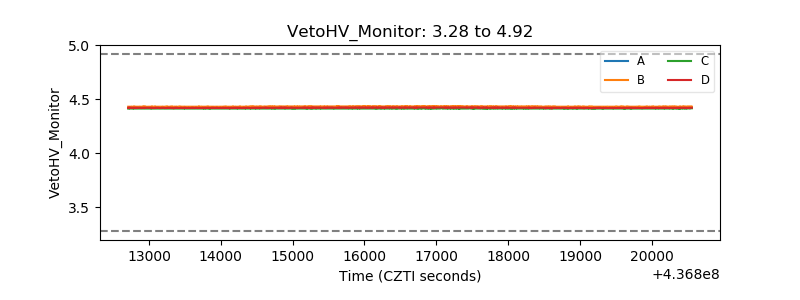 |
| Veto LLD | 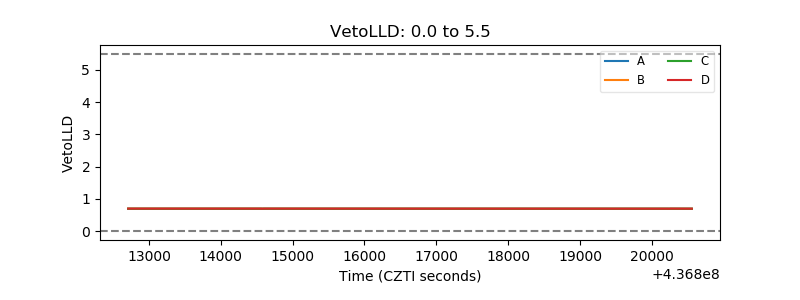 |
| Alpha Counter | 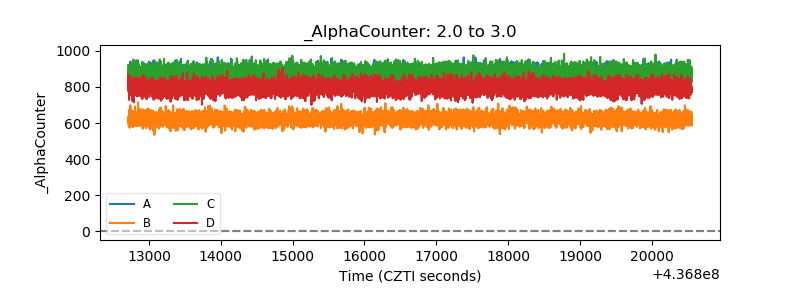 |
| _CPM_Rate | 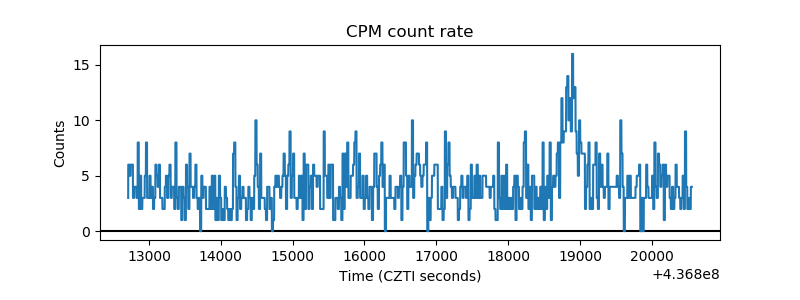 |
| CZT Counter | 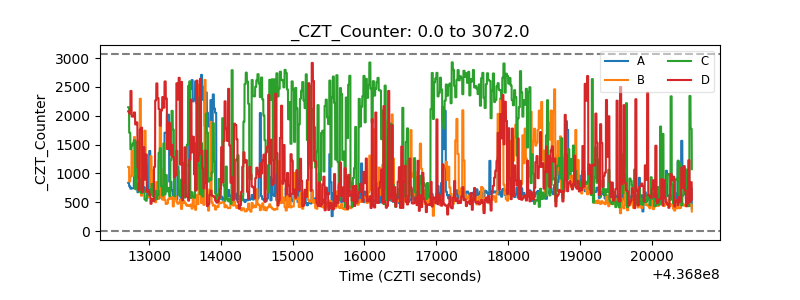 |
| +2.5 Volts monitor | 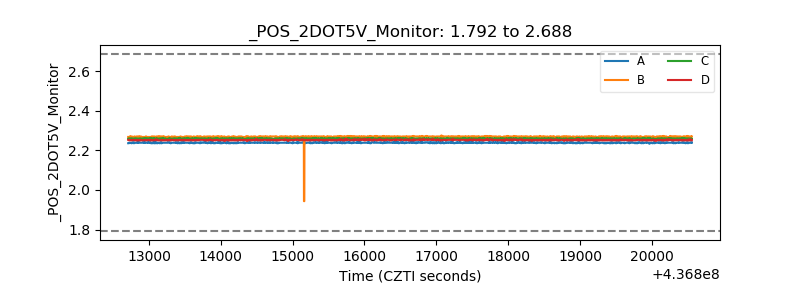 |
| +5 Volts monitor | 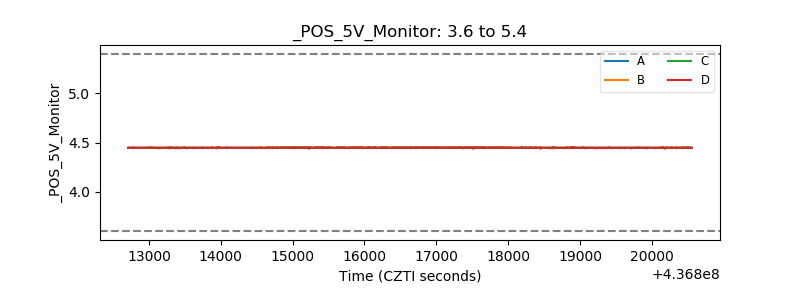 |
| _ROLL_ROT | 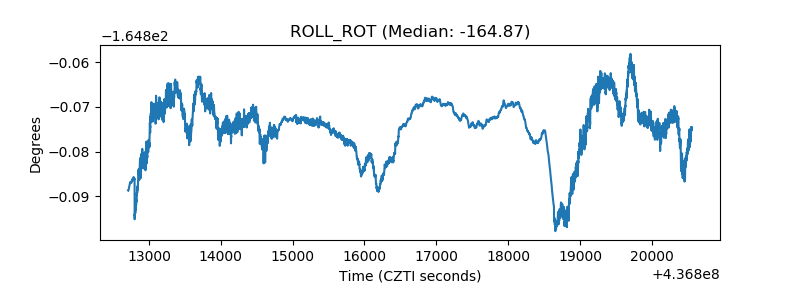 |
| _Roll_DEC | 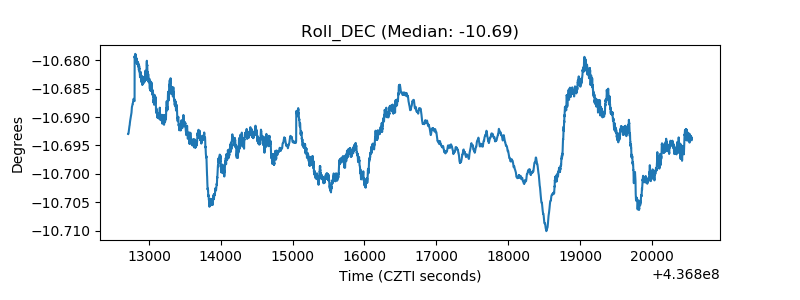 |
| _Roll_RA | 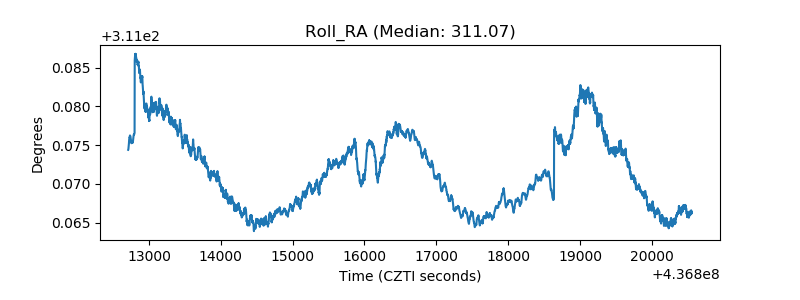 |
| Veto Counter | 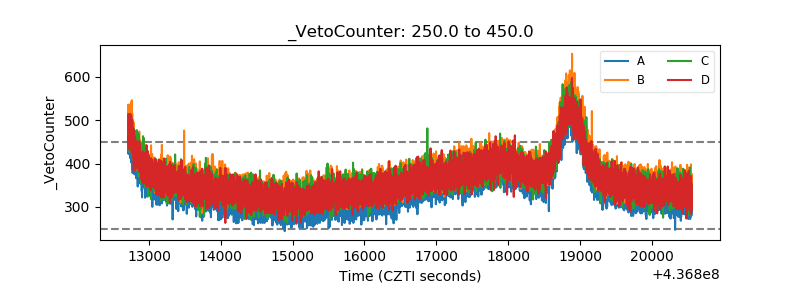 |