| Param | Original file | Final file |
|---|---|---|
| Filename | modeM0/AS1A13_018T01_9000005906_43815cztM0_level2.fits | modeM0/AS1A13_018T01_9000005906_43815cztM0_level2_quad_clean.evt |
| Size (bytes) | 839,413,440 | 127,503,360 |
| Size | 800.5 MB | 121.6 MB |
| Events in quadrant A | 6,408,244 | 903,955 |
| Events in quadrant B | 5,032,188 | 931,340 |
| Events in quadrant C | 9,942,497 | 692,419 |
| Events in quadrant D | 9,035,687 | 744,795 |
| Mode M0 | |||
|---|---|---|---|
| Quadrant | BADHDUFLAG | Total packets | Discarded packets |
| A | 0 | 25158 | 2 |
| B | 0 | 20647 | 2 |
| C | 0 | 35336 | 3 |
| D | 0 | 32722 | 2 |
| Mode SS | |||
|---|---|---|---|
| Quadrant | BADHDUFLAG | Total packets | Discarded packets |
| A | 0 | 174 | 0 |
| B | 0 | 174 | 0 |
| C | 0 | 174 | 0 |
| D | 0 | 174 | 0 |
| Mode M9 | |||
|---|---|---|---|
| Quadrant | BADHDUFLAG | Total packets | Discarded packets |
| A | 0 | 2 | 0 |
| B | 0 | 2 | 0 |
| C | 0 | 2 | 0 |
| D | 0 | 2 | 0 |
| Quadrant | Total seconds | Saturated seconds | Saturation percentage |
|---|---|---|---|
| A | 8451 | 370 | 4.378180% |
| B | 8451 | 312 | 3.691871% |
| C | 8450 | 2228 | 26.366864% |
| D | 8451 | 1185 | 14.022009% |
Noise dominated data is calculated using 1-second bins in cleaned event files. If a bin has >2000 counts, and if more than 50% of those come from <1% of pixels, then it is considered to be noise-dominated and hence unusable.
| Quadrant | # 1 sec bins | Bins with >0 counts | Bins with >2000 counts | High rate bins dominated by noise | Noise dominated (total time) | Noise dominated (detector-on time) | Marked lightcurve |
|---|---|---|---|---|---|---|---|
| A | 8730 | 8452 | 159 | 159 | 1.82% | 1.88% | 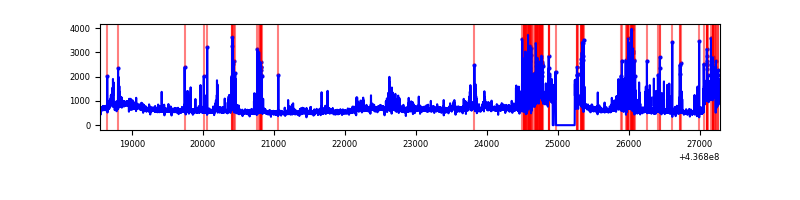 |
| B | 8731 | 8453 | 115 | 115 | 1.32% | 1.36% | 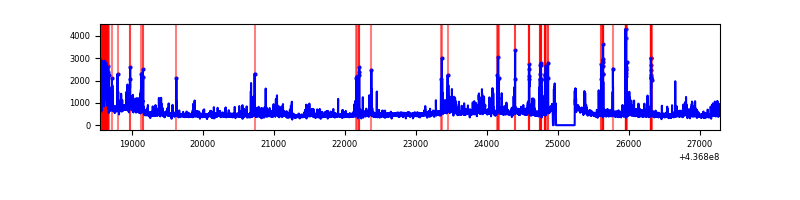 |
| C | 8730 | 8451 | 1896 | 1896 | 21.72% | 22.44% | 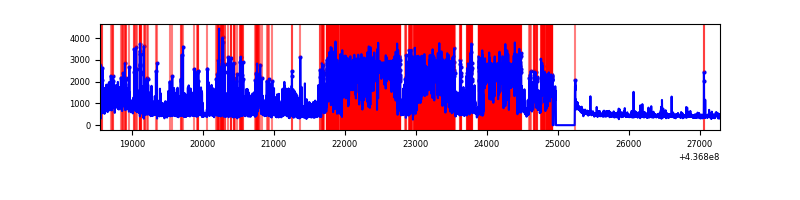 |
| D | 8731 | 8453 | 1019 | 1019 | 11.67% | 12.05% | 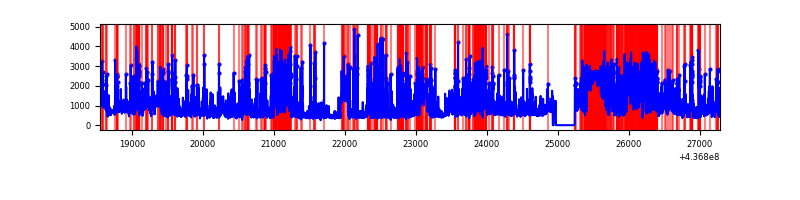 |
Top three noisy pixels from each quadrant. If the there are fewer than three noisy pixels in the level2.evt file, extra rows are filled as -1
| Pixel properties | Quadrant properties | ||||||
|---|---|---|---|---|---|---|---|
| Quadrant | DetID | PixID | Counts | Sigma | Mean | Median | Sigma |
| A | 10 | 83 | 1195764 | 5836.14 | 974 | 951 | 204.7 |
| A | 15 | 223 | 788051 | 3844.64 | 974 | 951 | 204.7 |
| A | 14 | 254 | 401195 | 1955.02 | 974 | 951 | 204.7 |
| B | 0 | 200 | 387281 | 1995.05 | 977 | 947 | 193.6 |
| B | 5 | 235 | 182732 | 938.75 | 977 | 947 | 193.6 |
| B | 4 | 170 | 169545 | 870.65 | 977 | 947 | 193.6 |
| C | 15 | 174 | 4066912 | 19857.57 | 867 | 872 | 204.8 |
| C | 15 | 158 | 1398708 | 6826.7 | 867 | 872 | 204.8 |
| C | 3 | 233 | 380512 | 1854.07 | 867 | 872 | 204.8 |
| D | 10 | 102 | 1103185 | 4816.9 | 910 | 883 | 228.8 |
| D | 12 | 33 | 941177 | 4108.95 | 910 | 883 | 228.8 |
| D | 1 | 52 | 729171 | 3182.51 | 910 | 883 | 228.8 |
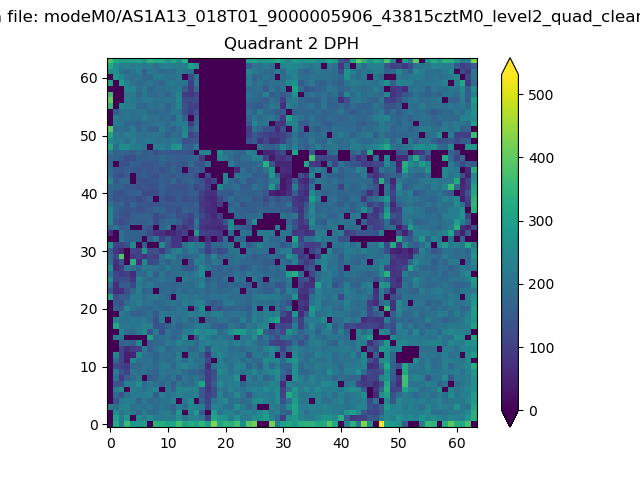
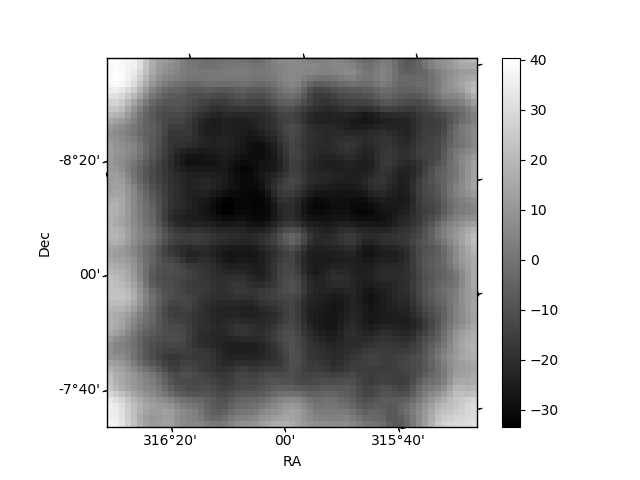
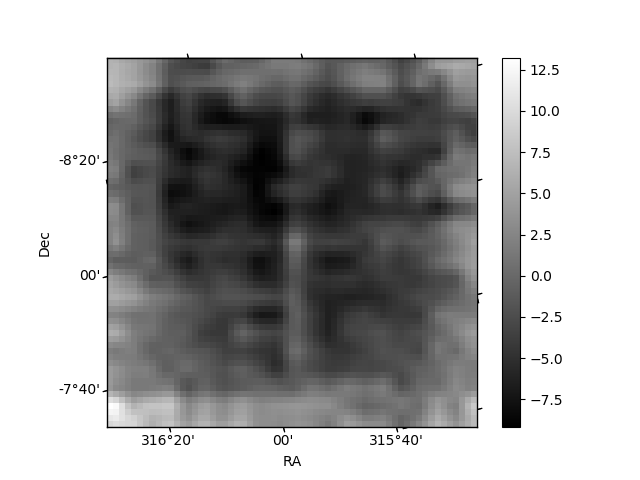
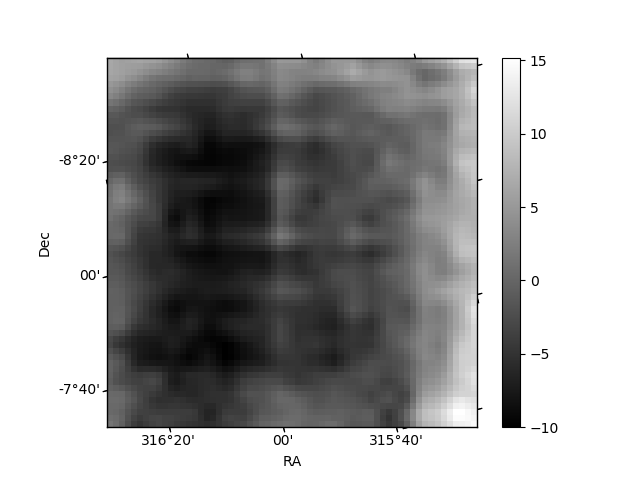
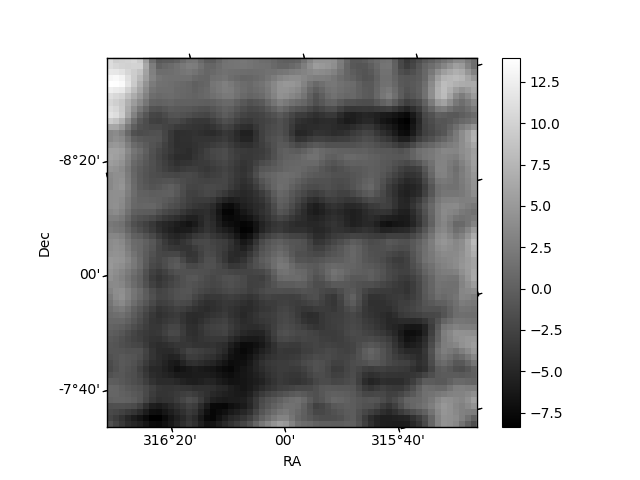
Histogram calculated using DETX and DETY for each event in the final _common_clean file
| Quadrant A | 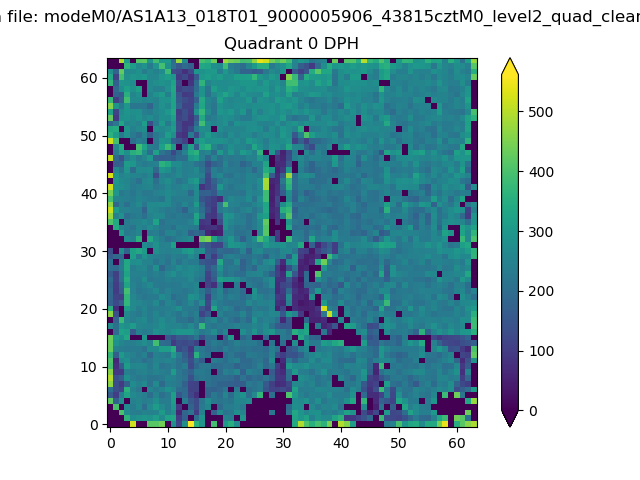 |
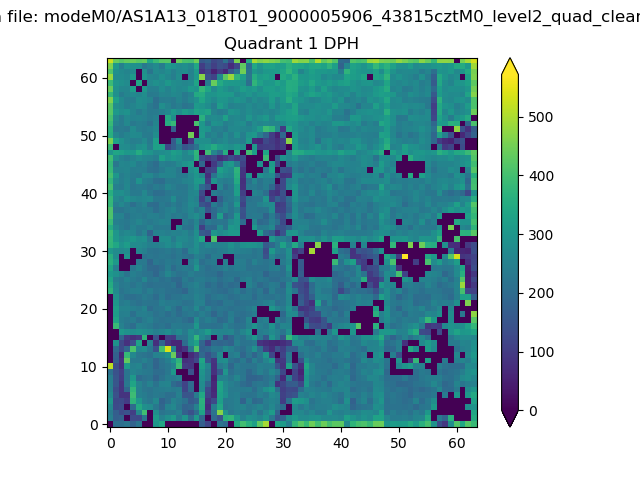 |
Quadrant B |
|---|---|---|---|
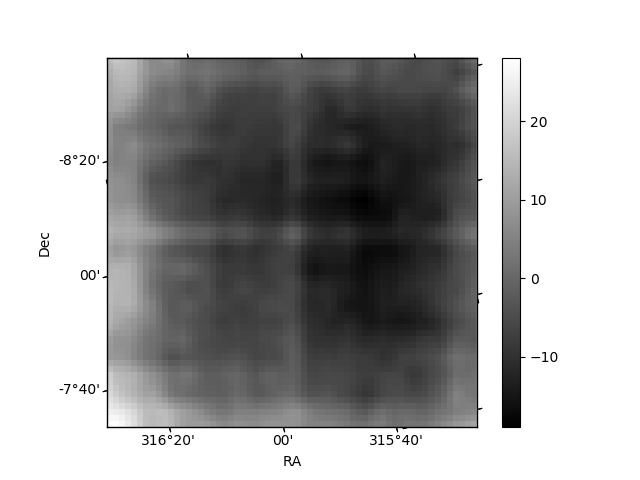
| Quadrant D | 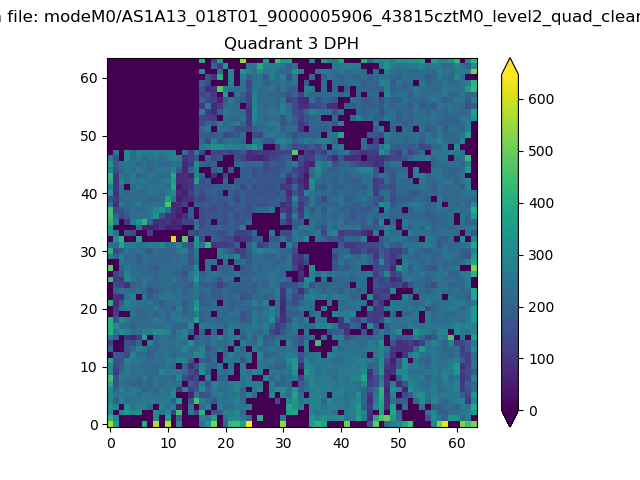 |
 |
Quadrant C |
| Plot type | Count rate plots | Images |
|---|---|---|
| Comparison with Poisson distribution Blue bars denote a histogram of data divided into 1 sec bins. Red curve is a Poisson curve with rate = median count rate of data. |
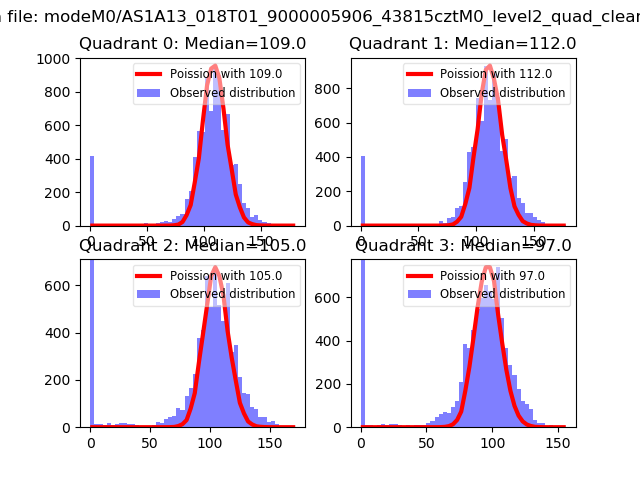 |
 |
| Quadrant-wise count rates Data is divided into 100 sec bins |
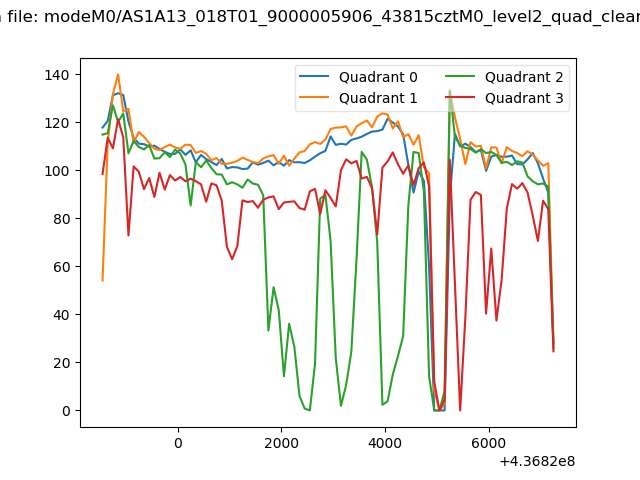 |
|
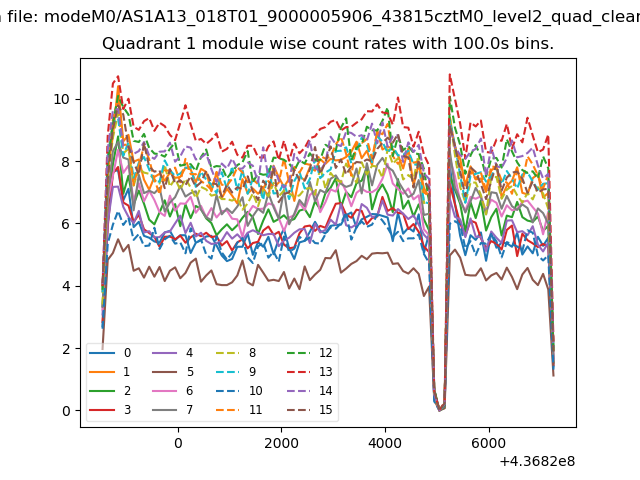
| Module-wise count rates for Quadrant A Data is divided into 100 sec bins |
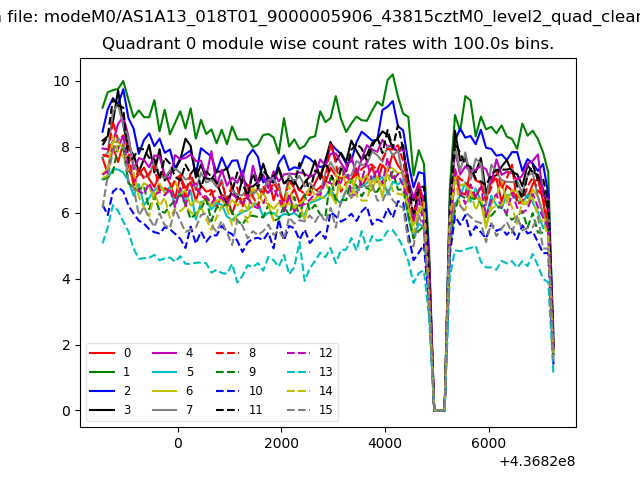 |
 |
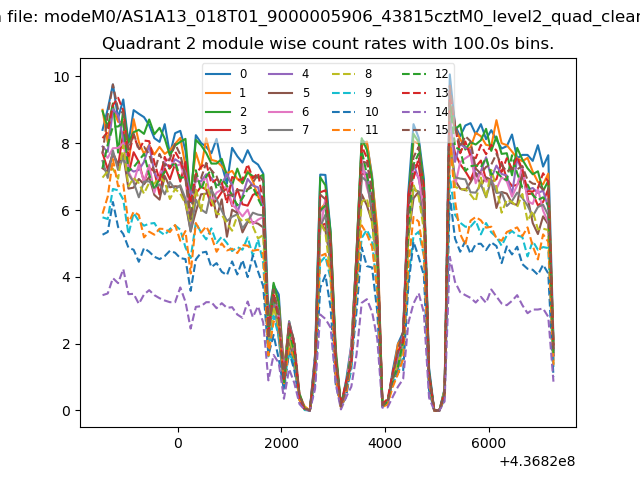
| Module-wise count rates for Quadrant B Data is divided into 100 sec bins |
 |
 |
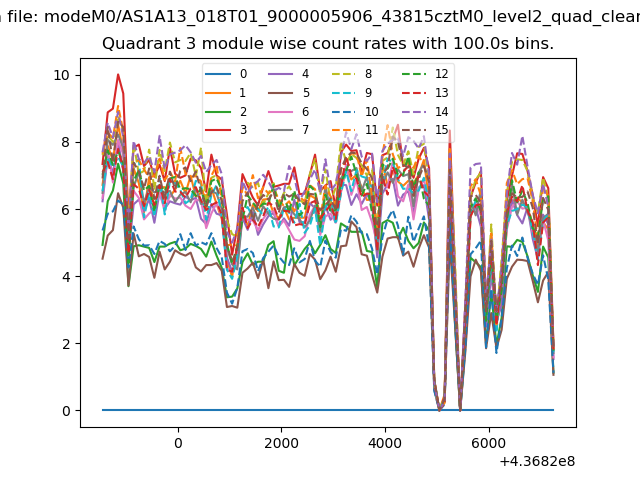
| Module-wise count rates for Quadrant C Data is divided into 100 sec bins |
 |
 |
| Module-wise count rates for Quadrant D Data is divided into 100 sec bins |
 |
 |
| Parameter | Plot |
|---|---|
| CZT HV Monitor |  |
| D_VDD | 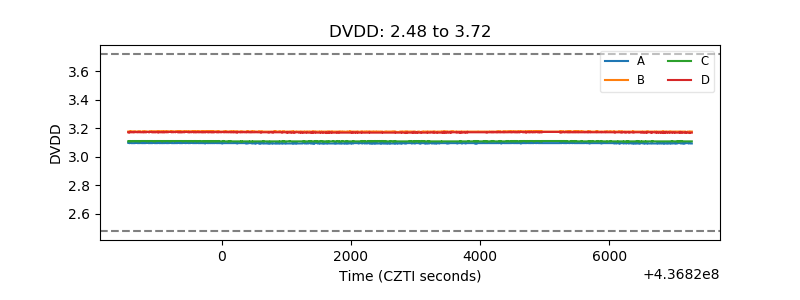 |
| Temperature 1 | 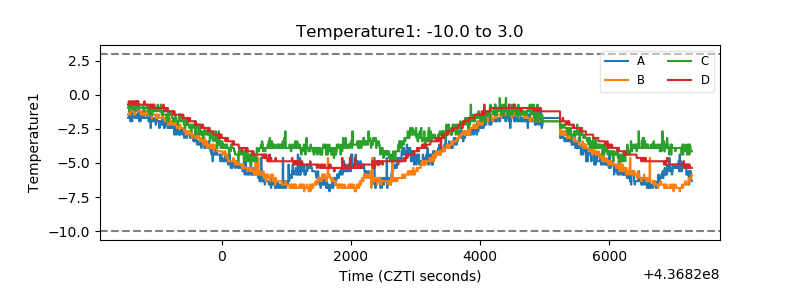 |
| Veto HV Monitor | 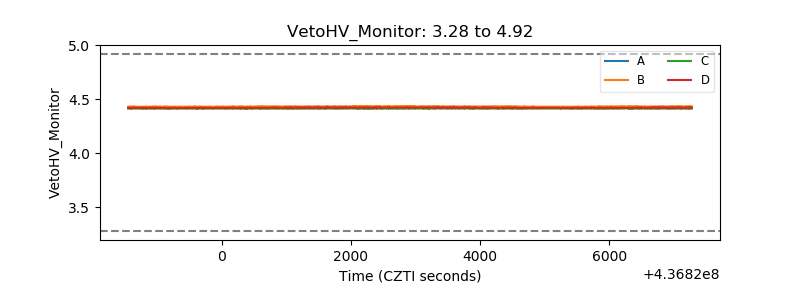 |
| Veto LLD | 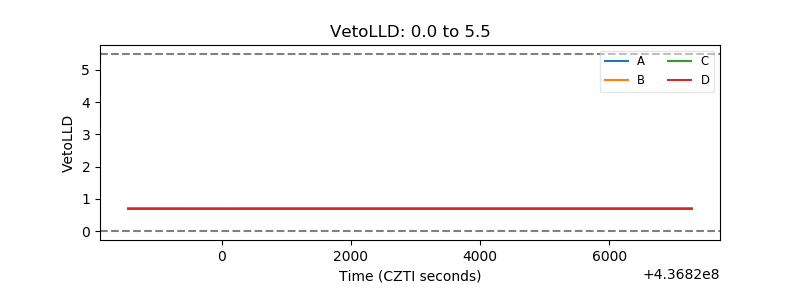 |
| Alpha Counter | 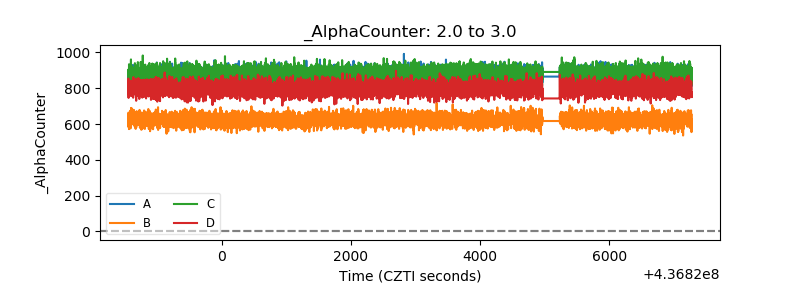 |
| _CPM_Rate | 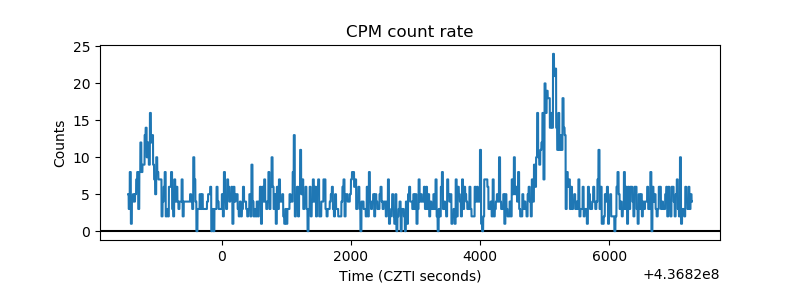 |
| CZT Counter | 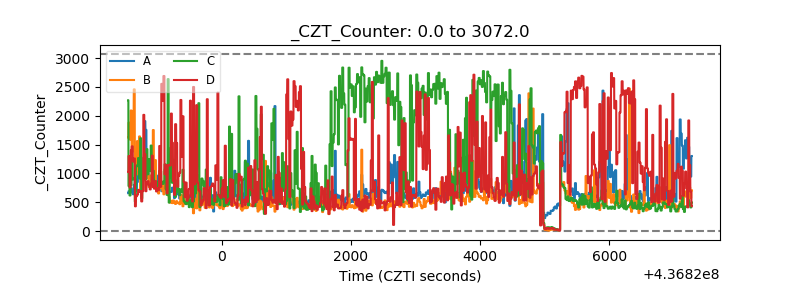 |
| +2.5 Volts monitor | 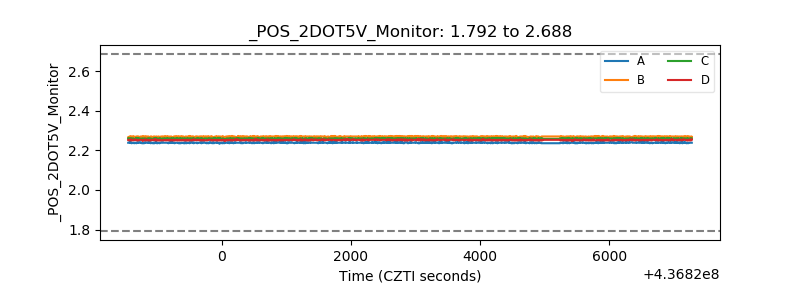 |
| +5 Volts monitor | 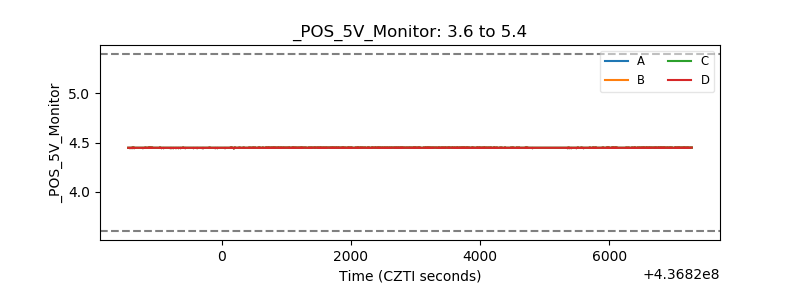 |
| _ROLL_ROT | 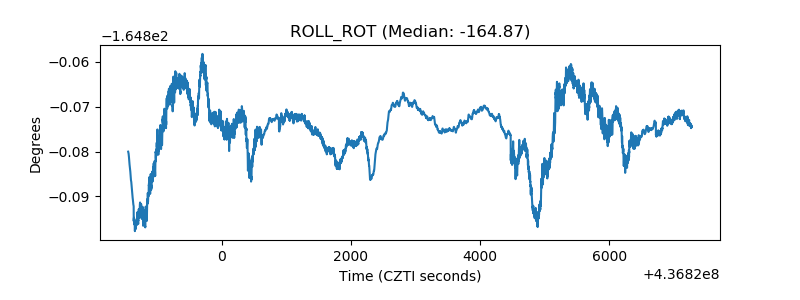 |
| _Roll_DEC | 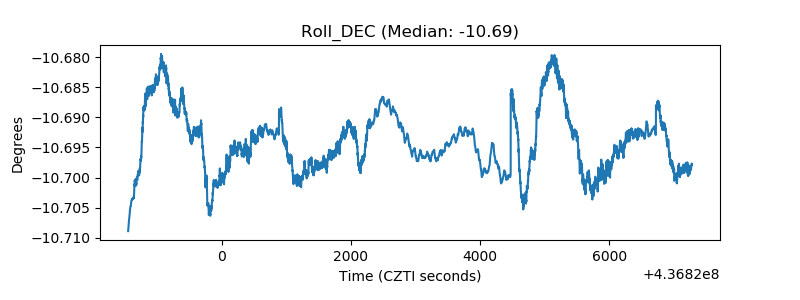 |
| _Roll_RA | 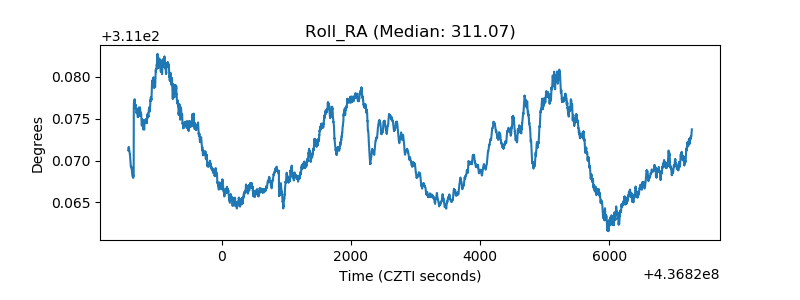 |
| Veto Counter | 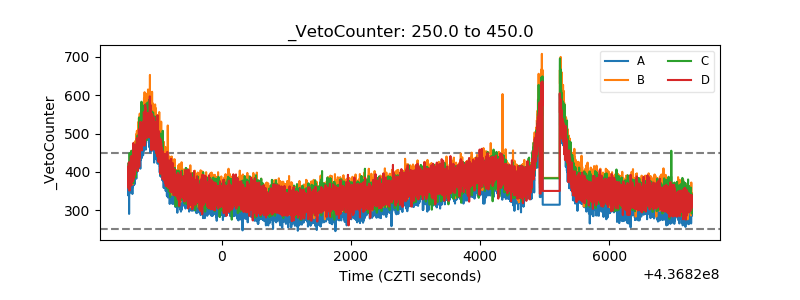 |