| Param | Original file | Final file |
|---|---|---|
| Filename | modeM0/AS1A13_018T01_9000005906_43816cztM0_level2.fits | modeM0/AS1A13_018T01_9000005906_43816cztM0_level2_quad_clean.evt |
| Size (bytes) | 1,357,125,120 | 169,159,680 |
| Size | 1.3 GB | 161.3 MB |
| Events in quadrant A | 13,361,871 | 1,106,609 |
| Events in quadrant B | 8,429,530 | 1,287,150 |
| Events in quadrant C | 9,928,792 | 1,137,949 |
| Events in quadrant D | 17,582,392 | 752,602 |
| Mode M0 | |||
|---|---|---|---|
| Quadrant | BADHDUFLAG | Total packets | Discarded packets |
| A | 0 | 48476 | 2 |
| B | 0 | 33202 | 2 |
| C | 0 | 37910 | 2 |
| D | 0 | 60519 | 2 |
| Mode SS | |||
|---|---|---|---|
| Quadrant | BADHDUFLAG | Total packets | Discarded packets |
| A | 0 | 246 | 0 |
| B | 0 | 246 | 0 |
| C | 0 | 246 | 0 |
| D | 0 | 246 | 0 |
| Mode M9 | |||
|---|---|---|---|
| Quadrant | BADHDUFLAG | Total packets | Discarded packets |
| A | 0 | 13 | 0 |
| B | 0 | 13 | 0 |
| C | 0 | 13 | 0 |
| D | 0 | 13 | 0 |
| Quadrant | Total seconds | Saturated seconds | Saturation percentage |
|---|---|---|---|
| A | 12098 | 1951 | 16.126633% |
| B | 12098 | 659 | 5.447181% |
| C | 12098 | 1476 | 12.200364% |
| D | 12099 | 4502 | 37.209687% |
Noise dominated data is calculated using 1-second bins in cleaned event files. If a bin has >2000 counts, and if more than 50% of those come from <1% of pixels, then it is considered to be noise-dominated and hence unusable.
| Quadrant | # 1 sec bins | Bins with >0 counts | Bins with >2000 counts | High rate bins dominated by noise | Noise dominated (total time) | Noise dominated (detector-on time) | Marked lightcurve |
|---|---|---|---|---|---|---|---|
| A | 13408 | 12099 | 1572 | 1572 | 11.72% | 12.99% | 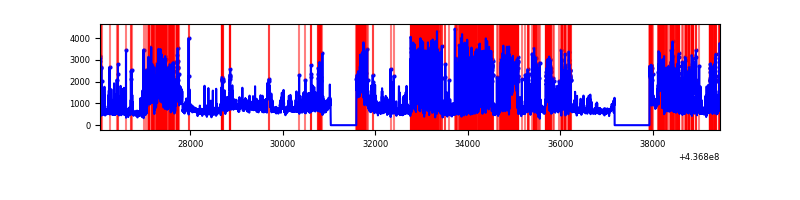 |
| B | 13408 | 12099 | 355 | 355 | 2.65% | 2.93% | 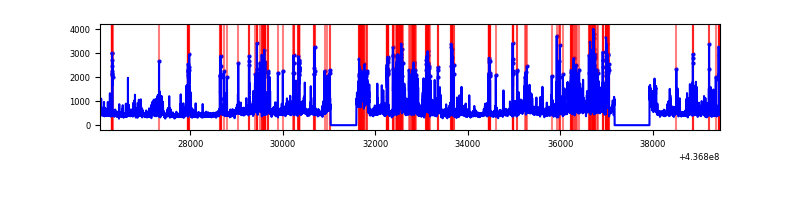 |
| C | 13408 | 12099 | 1341 | 1341 | 10.00% | 11.08% | 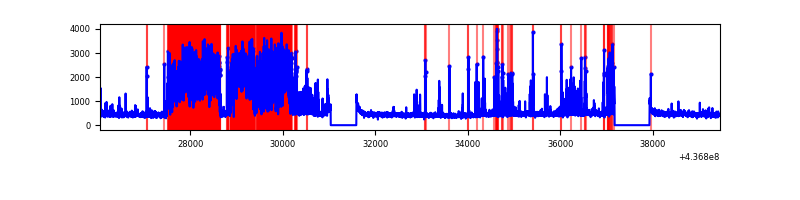 |
| D | 13409 | 12099 | 4098 | 4098 | 30.56% | 33.87% | 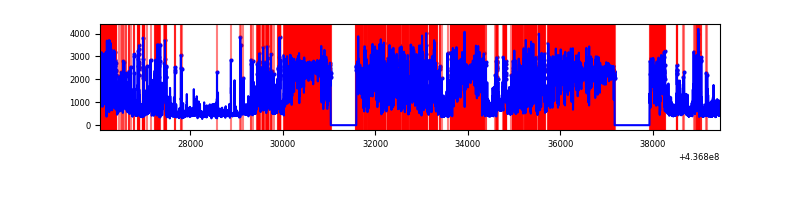 |
Top three noisy pixels from each quadrant. If the there are fewer than three noisy pixels in the level2.evt file, extra rows are filled as -1
| Pixel properties | Quadrant properties | ||||||
|---|---|---|---|---|---|---|---|
| Quadrant | DetID | PixID | Counts | Sigma | Mean | Median | Sigma |
| A | 14 | 254 | 3426077 | 12857.69 | 1279 | 1253 | 266.4 |
| A | 15 | 223 | 3011558 | 11301.48 | 1279 | 1253 | 266.4 |
| A | 10 | 83 | 1595501 | 5985.23 | 1279 | 1253 | 266.4 |
| B | 5 | 235 | 1605553 | 6067.27 | 1354 | 1313 | 264.4 |
| B | 0 | 200 | 387141 | 1459.21 | 1354 | 1313 | 264.4 |
| B | 5 | 172 | 377389 | 1422.33 | 1354 | 1313 | 264.4 |
| C | 15 | 174 | 3559169 | 11543.79 | 1310 | 1317 | 308.2 |
| C | 15 | 158 | 749739 | 2428.33 | 1310 | 1317 | 308.2 |
| C | 3 | 233 | 171031 | 550.65 | 1310 | 1317 | 308.2 |
| D | 12 | 33 | 6261869 | 22566.91 | 1080 | 1049 | 277.4 |
| D | 10 | 102 | 4501756 | 16222.64 | 1080 | 1049 | 277.4 |
| D | 5 | 235 | 664528 | 2391.49 | 1080 | 1049 | 277.4 |
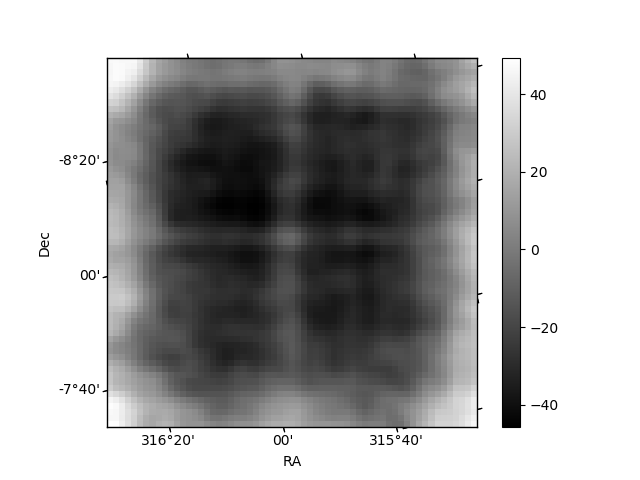
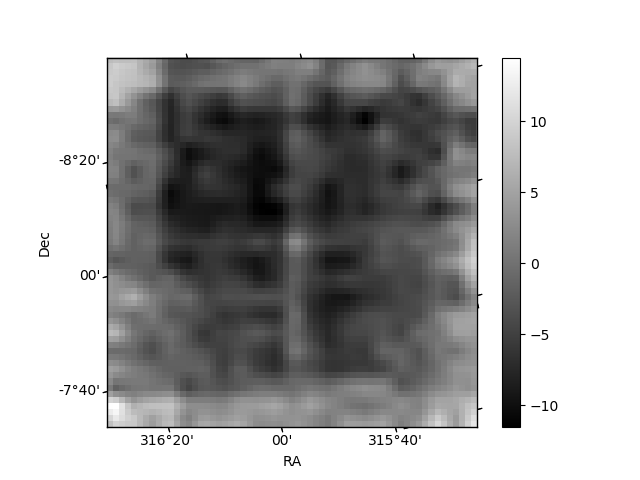
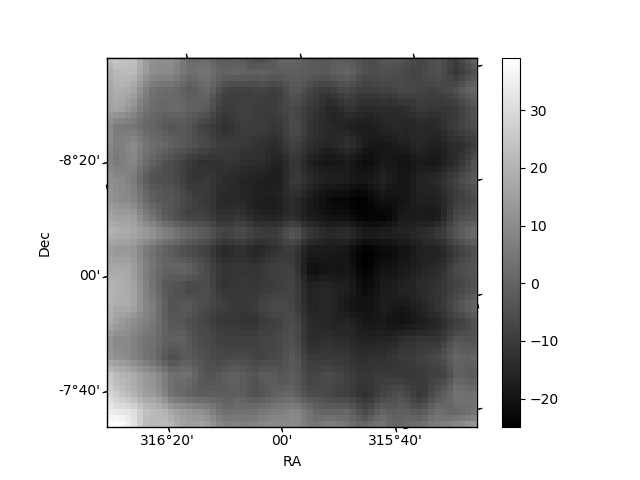
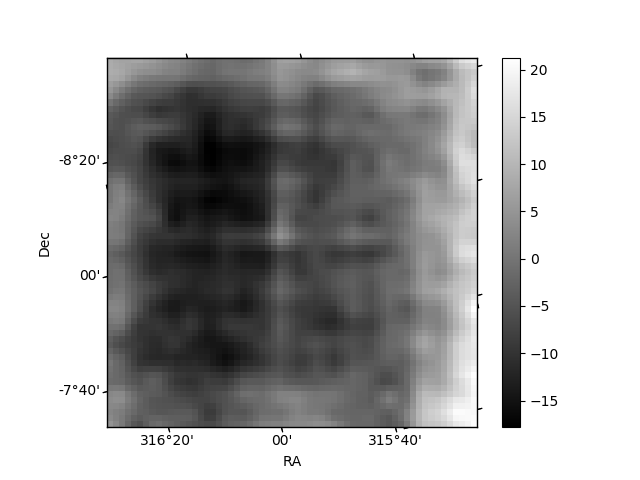
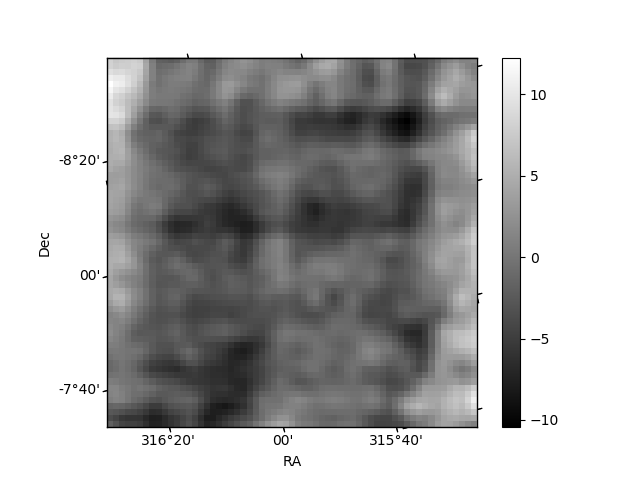
Histogram calculated using DETX and DETY for each event in the final _common_clean file
| Quadrant A | 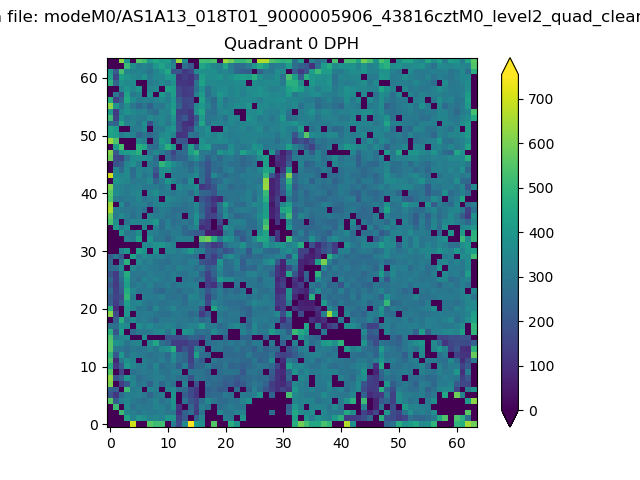 |
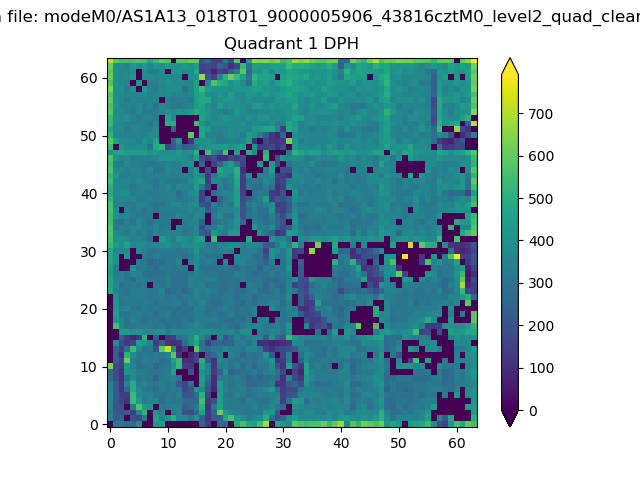 |
Quadrant B |
|---|---|---|---|
| Quadrant D | 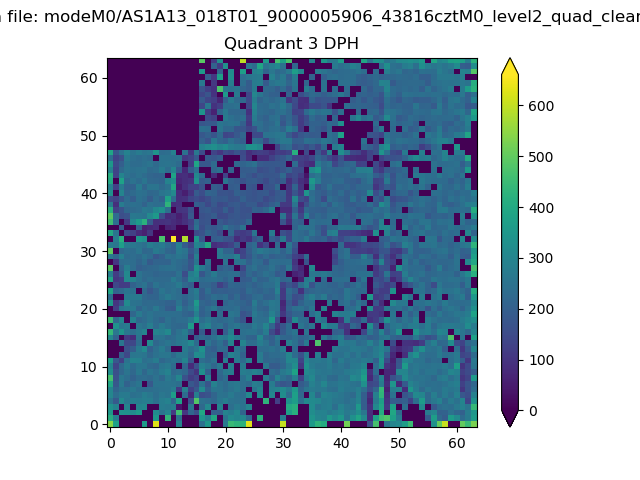 |
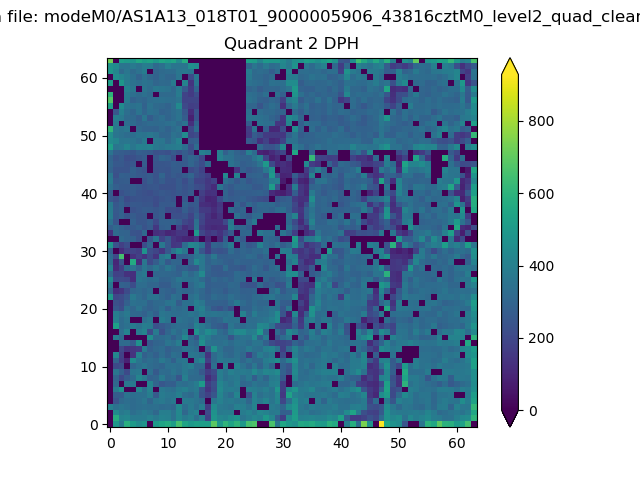 |
Quadrant C |
| Plot type | Count rate plots | Images |
|---|---|---|
| Comparison with Poisson distribution Blue bars denote a histogram of data divided into 1 sec bins. Red curve is a Poisson curve with rate = median count rate of data. |
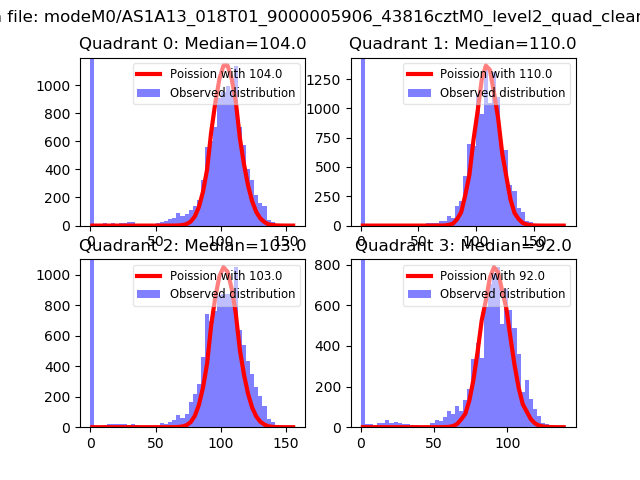 |
 |
| Quadrant-wise count rates Data is divided into 100 sec bins |
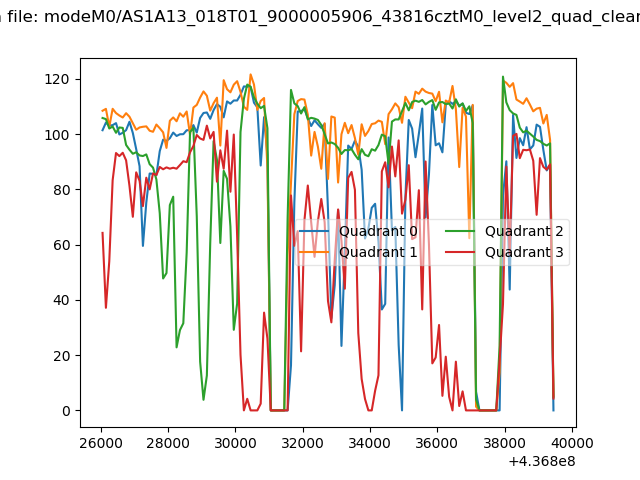 |
|
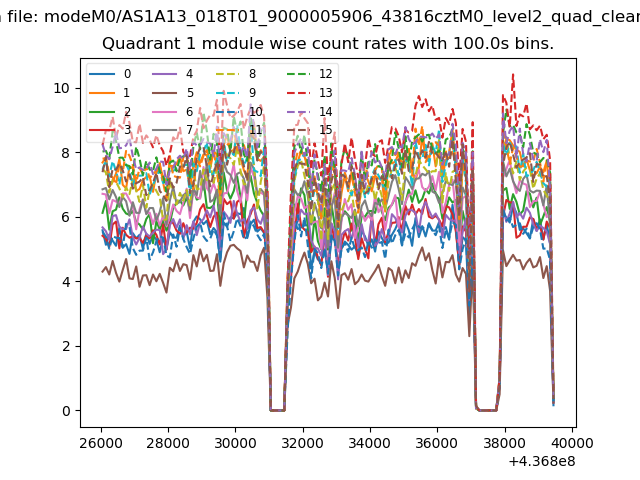
| Module-wise count rates for Quadrant A Data is divided into 100 sec bins |
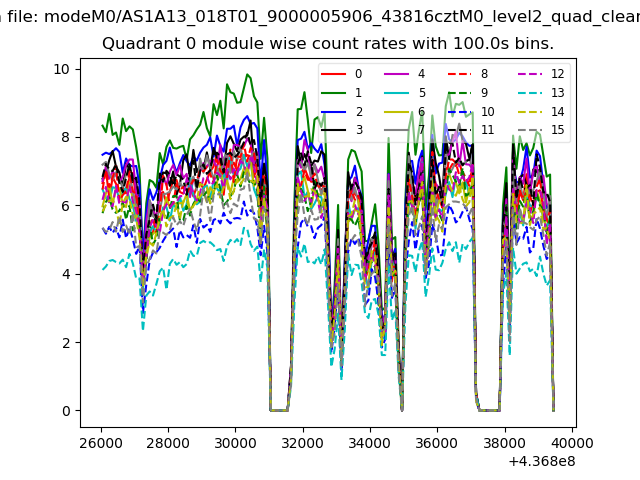 |
 |
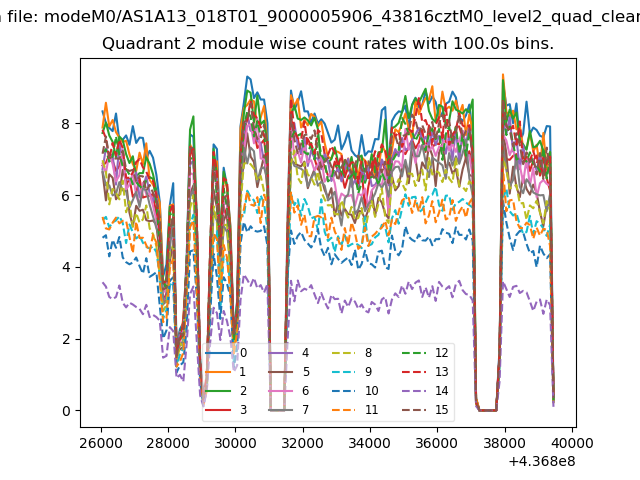
| Module-wise count rates for Quadrant B Data is divided into 100 sec bins |
 |
 |
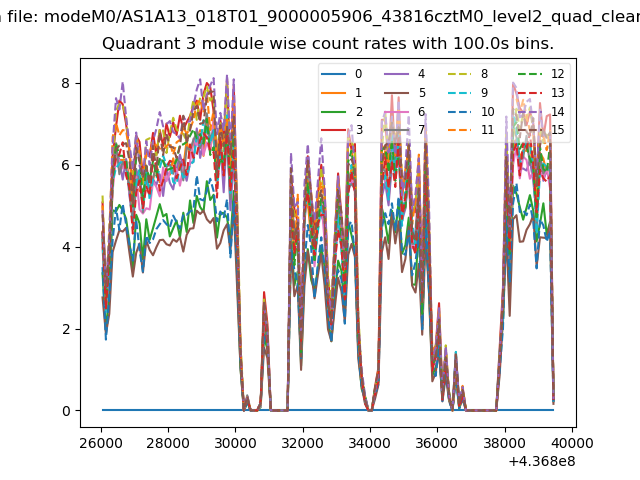
| Module-wise count rates for Quadrant C Data is divided into 100 sec bins |
 |
 |
| Module-wise count rates for Quadrant D Data is divided into 100 sec bins |
 |
 |
| Parameter | Plot |
|---|---|
| CZT HV Monitor | 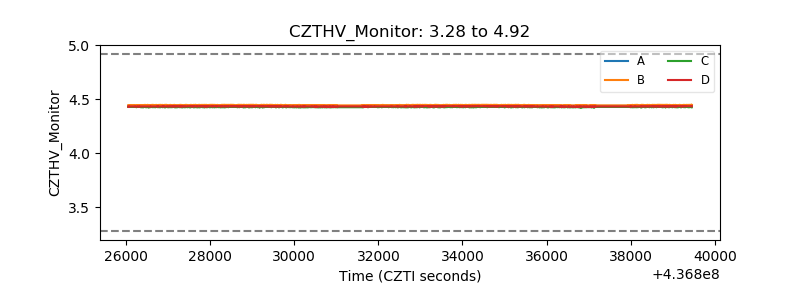 |
| D_VDD | 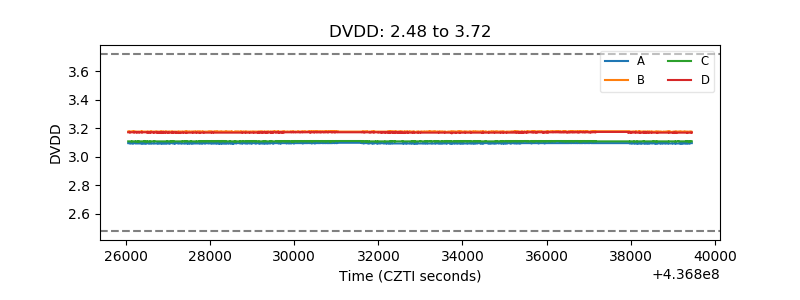 |
| Temperature 1 | 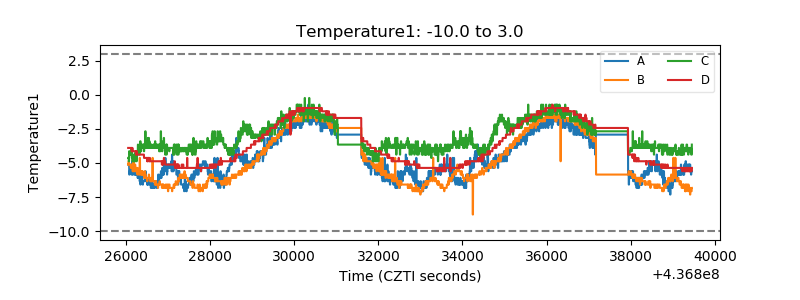 |
| Veto HV Monitor | 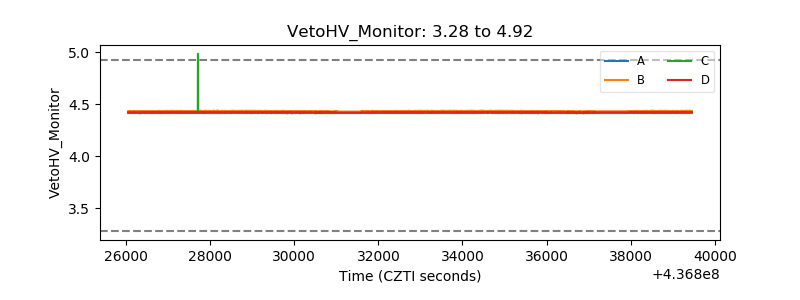 |
| Veto LLD | 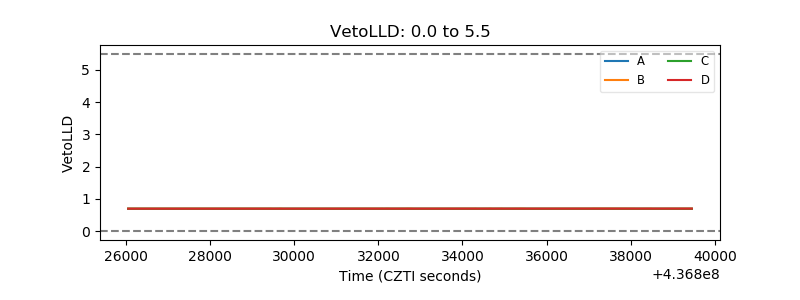 |
| Alpha Counter | 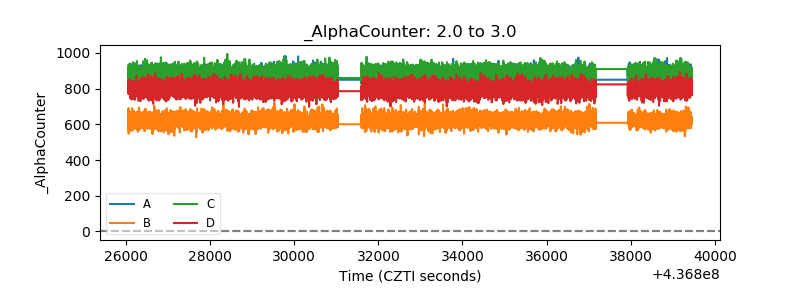 |
| _CPM_Rate | 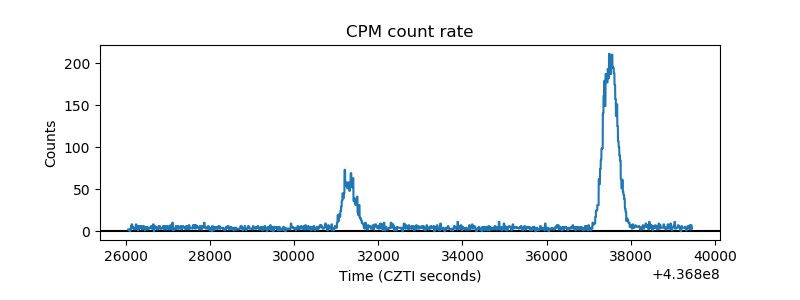 |
| CZT Counter | 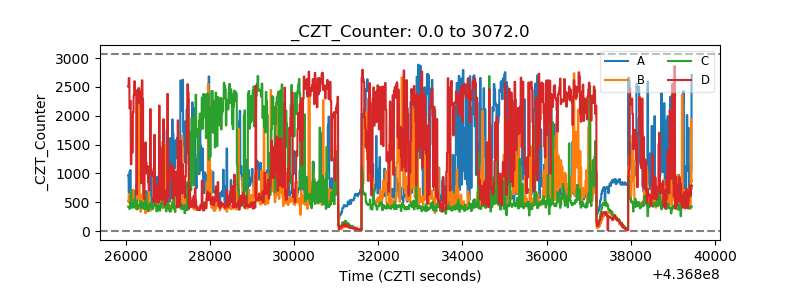 |
| +2.5 Volts monitor | 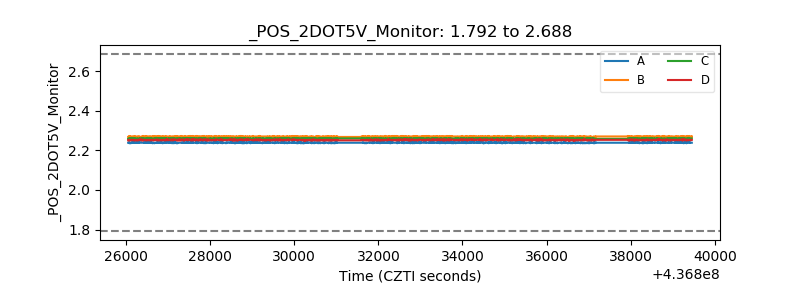 |
| +5 Volts monitor | 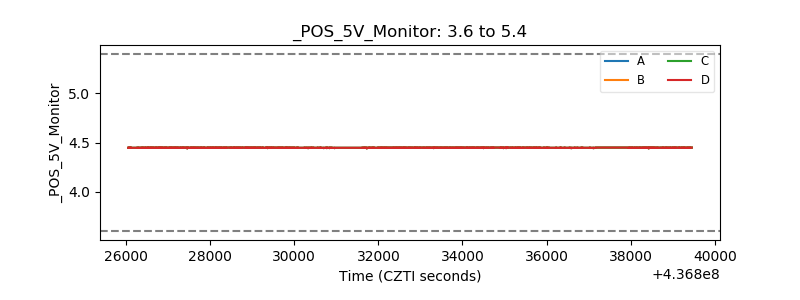 |
| _ROLL_ROT | 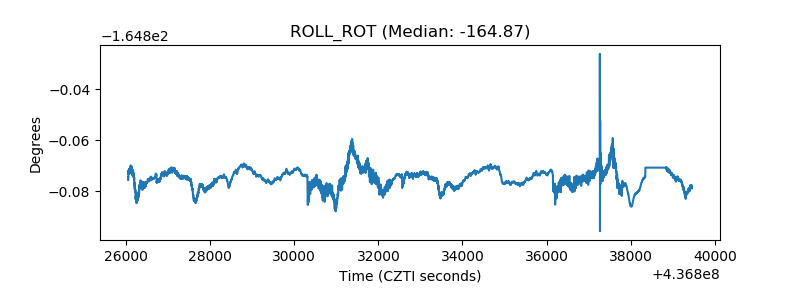 |
| _Roll_DEC | 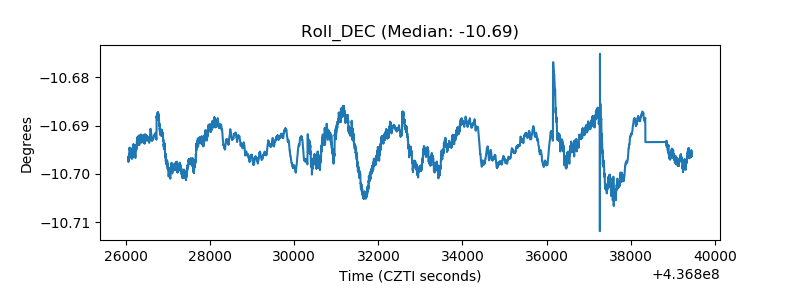 |
| _Roll_RA | 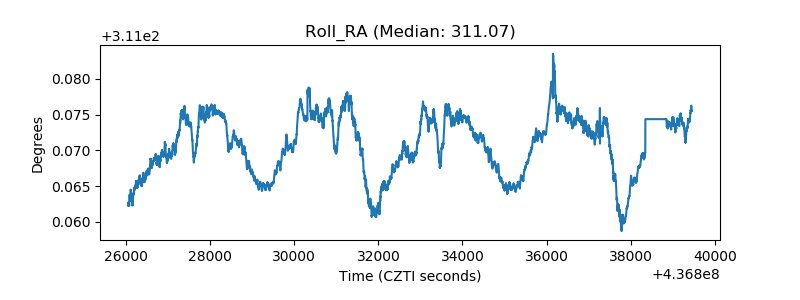 |
| Veto Counter | 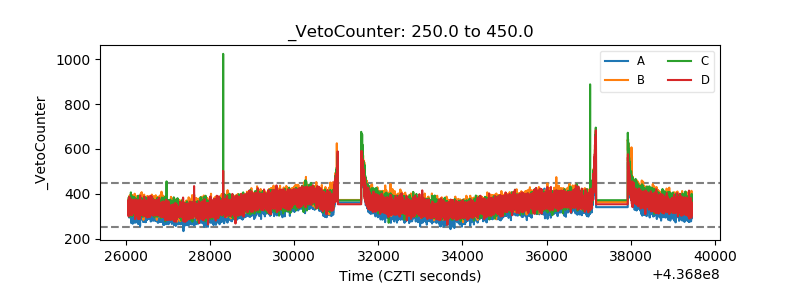 |