| Param | Original file | Final file |
|---|---|---|
| Filename | modeM0/AS1A13_018T01_9000005906_43819cztM0_level2.fits | modeM0/AS1A13_018T01_9000005906_43819cztM0_level2_quad_clean.evt |
| Size (bytes) | 662,319,360 | 101,024,640 |
| Size | 631.6 MB | 96.3 MB |
| Events in quadrant A | 5,538,206 | 689,700 |
| Events in quadrant B | 5,081,849 | 736,230 |
| Events in quadrant C | 4,474,371 | 697,076 |
| Events in quadrant D | 8,915,316 | 479,626 |
| Mode M0 | |||
|---|---|---|---|
| Quadrant | BADHDUFLAG | Total packets | Discarded packets |
| A | 0 | 20825 | 2 |
| B | 0 | 19377 | 2 |
| C | 0 | 17612 | 2 |
| D | 0 | 30970 | 3 |
| Mode SS | |||
|---|---|---|---|
| Quadrant | BADHDUFLAG | Total packets | Discarded packets |
| A | 0 | 132 | 0 |
| B | 0 | 132 | 0 |
| C | 0 | 132 | 0 |
| D | 0 | 132 | 0 |
| Mode M9 | |||
|---|---|---|---|
| Quadrant | BADHDUFLAG | Total packets | Discarded packets |
| A | 0 | 14 | 0 |
| B | 0 | 14 | 0 |
| C | 0 | 15 | 0 |
| D | 0 | 15 | 0 |
| Quadrant | Total seconds | Saturated seconds | Saturation percentage |
|---|---|---|---|
| A | 6543 | 570 | 8.711600% |
| B | 6543 | 484 | 7.397218% |
| C | 6543 | 434 | 6.633043% |
| D | 6542 | 2106 | 32.191990% |
Noise dominated data is calculated using 1-second bins in cleaned event files. If a bin has >2000 counts, and if more than 50% of those come from <1% of pixels, then it is considered to be noise-dominated and hence unusable.
| Quadrant | # 1 sec bins | Bins with >0 counts | Bins with >2000 counts | High rate bins dominated by noise | Noise dominated (total time) | Noise dominated (detector-on time) | Marked lightcurve |
|---|---|---|---|---|---|---|---|
| A | 7623 | 6543 | 428 | 428 | 5.61% | 6.54% | 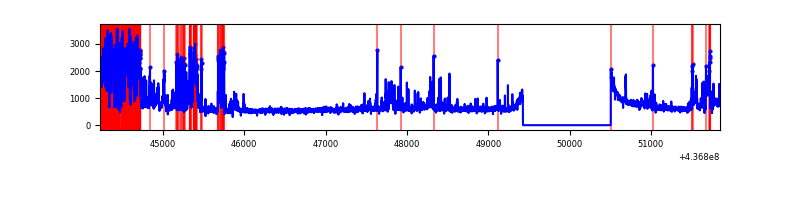 |
| B | 7623 | 6543 | 293 | 293 | 3.84% | 4.48% | 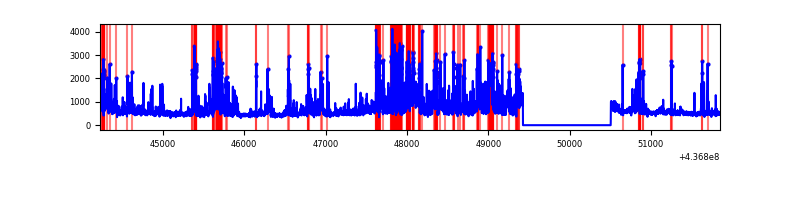 |
| C | 7623 | 6543 | 341 | 341 | 4.47% | 5.21% | 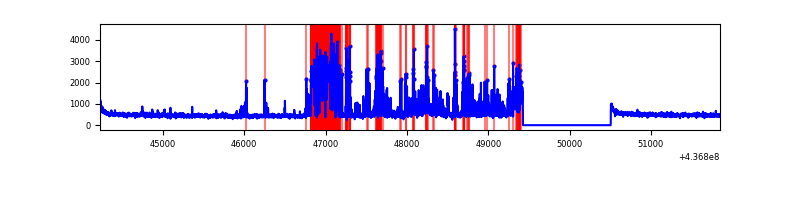 |
| D | 7622 | 6542 | 1773 | 1773 | 23.26% | 27.10% | 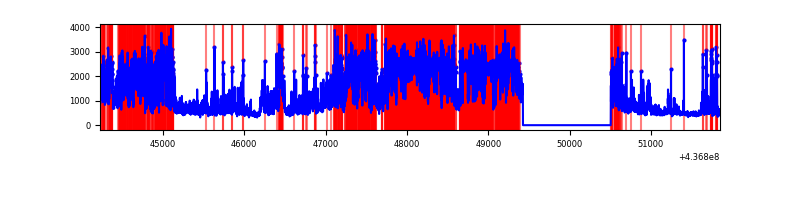 |
Top three noisy pixels from each quadrant. If the there are fewer than three noisy pixels in the level2.evt file, extra rows are filled as -1
| Pixel properties | Quadrant properties | ||||||
|---|---|---|---|---|---|---|---|
| Quadrant | DetID | PixID | Counts | Sigma | Mean | Median | Sigma |
| A | 15 | 223 | 1551952 | 10088.58 | 742 | 729 | 153.8 |
| A | 10 | 83 | 981649 | 6379.54 | 742 | 729 | 153.8 |
| A | 13 | 248 | 63391 | 407.53 | 742 | 729 | 153.8 |
| B | 5 | 235 | 1045360 | 7047.78 | 757 | 735 | 148.2 |
| B | 0 | 200 | 379205 | 2553.43 | 757 | 735 | 148.2 |
| B | 5 | 172 | 225886 | 1519.03 | 757 | 735 | 148.2 |
| C | 15 | 174 | 1088253 | 6252.39 | 743 | 748 | 173.9 |
| C | 15 | 158 | 237185 | 1359.35 | 743 | 748 | 173.9 |
| C | 3 | 233 | 96857 | 552.56 | 743 | 748 | 173.9 |
| D | 10 | 102 | 2513833 | 14794.5 | 660 | 638 | 169.9 |
| D | 12 | 33 | 2308369 | 13584.99 | 660 | 638 | 169.9 |
| D | 5 | 235 | 779777 | 4586.58 | 660 | 638 | 169.9 |
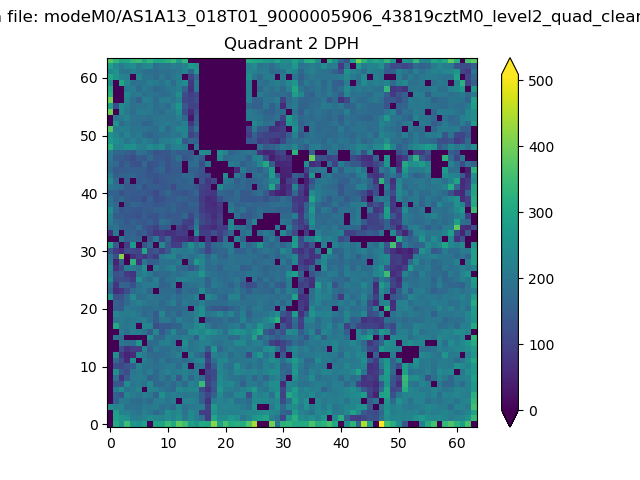
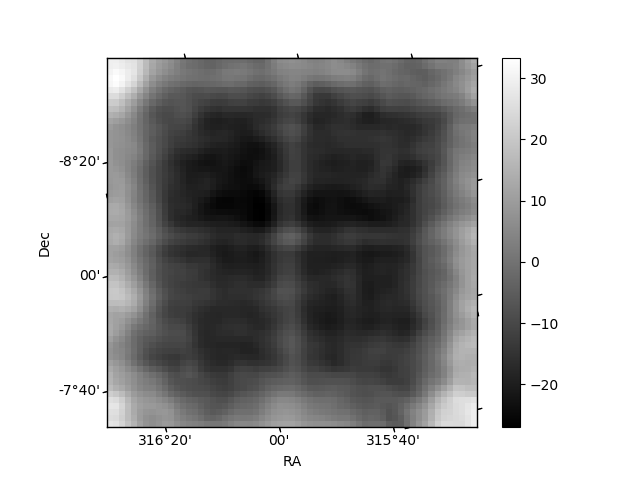
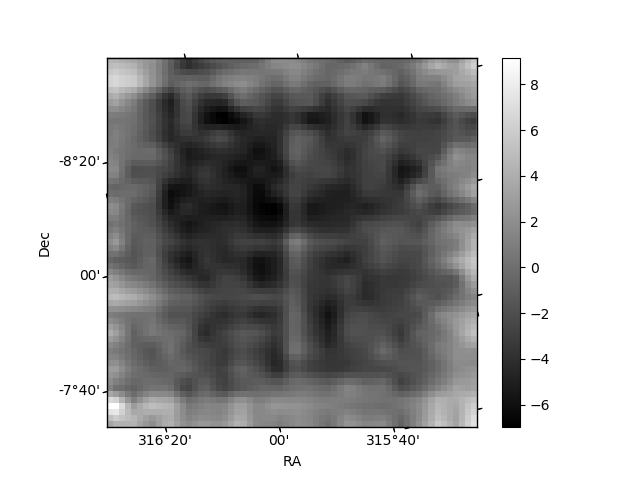
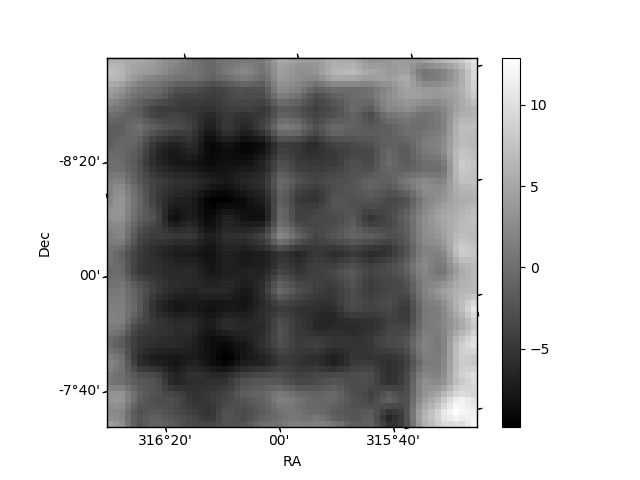
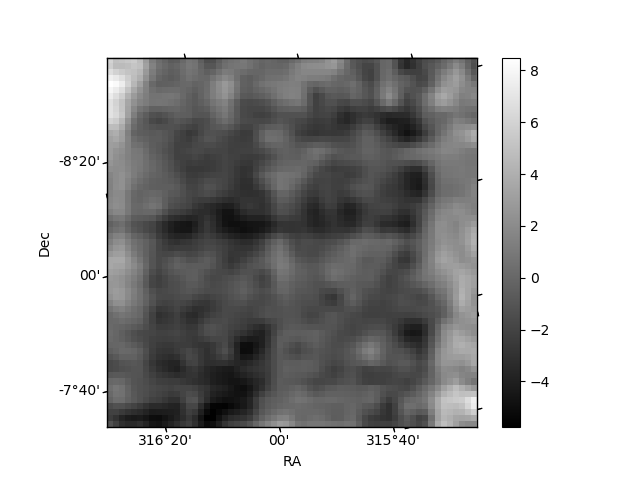
Histogram calculated using DETX and DETY for each event in the final _common_clean file
| Quadrant A | 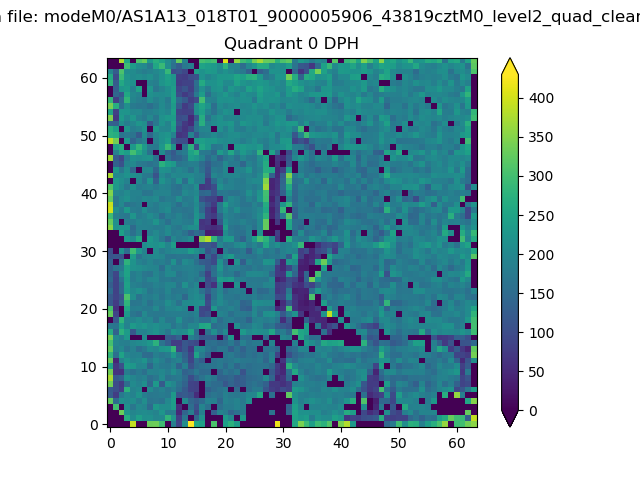 |
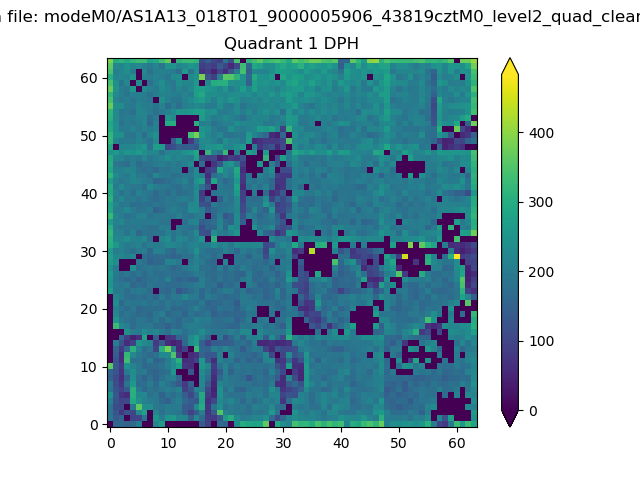 |
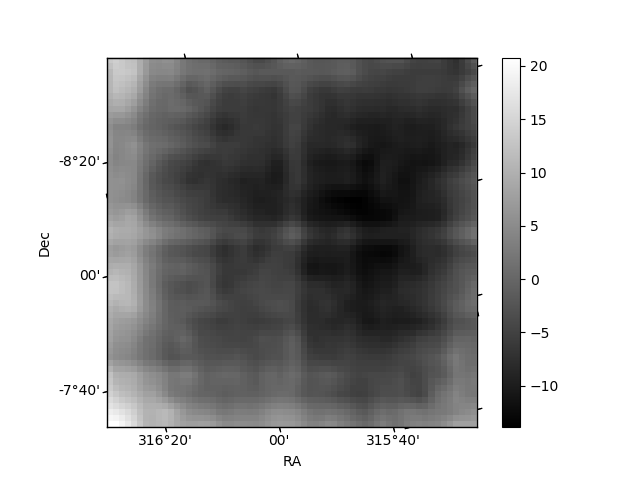
Quadrant B |
|---|---|---|---|
| Quadrant D | 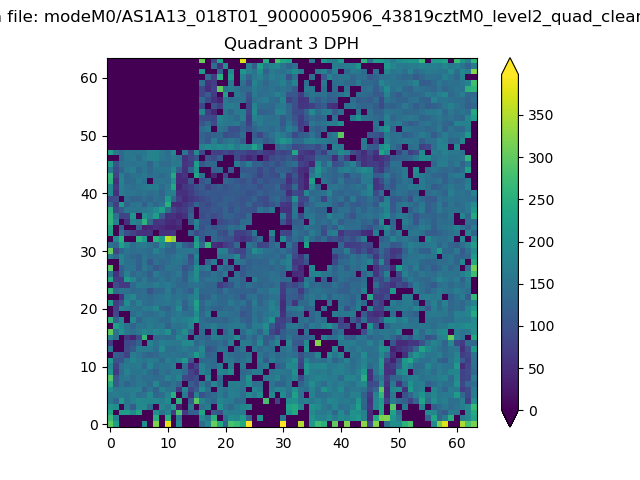 |
 |
Quadrant C |
| Plot type | Count rate plots | Images |
|---|---|---|
| Comparison with Poisson distribution Blue bars denote a histogram of data divided into 1 sec bins. Red curve is a Poisson curve with rate = median count rate of data. |
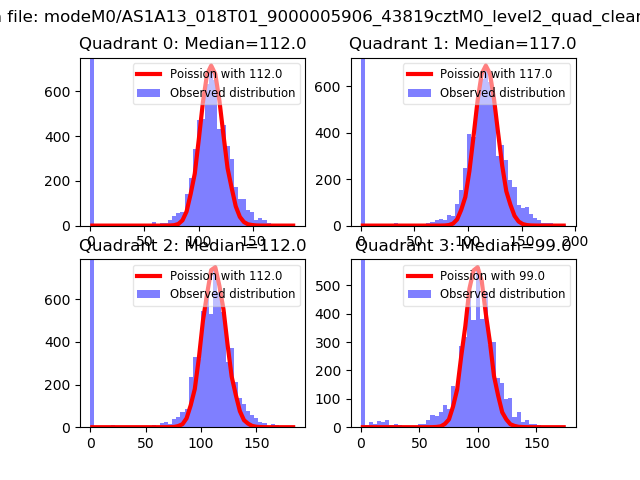 |
 |
| Quadrant-wise count rates Data is divided into 100 sec bins |
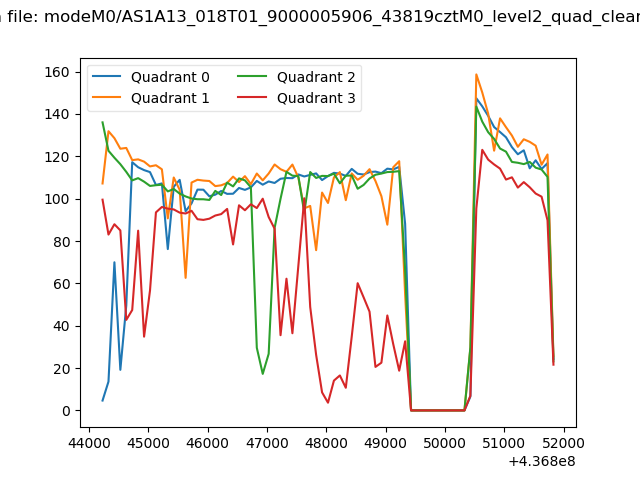 |
|
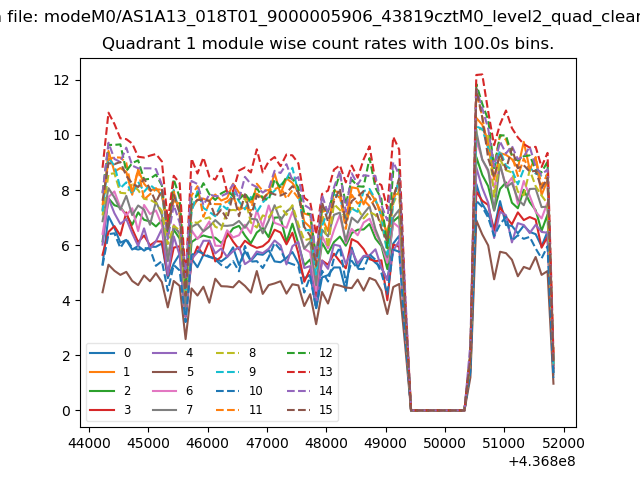
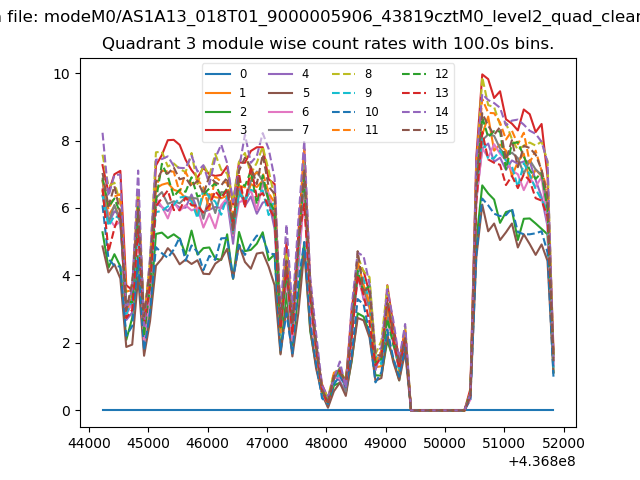
| Module-wise count rates for Quadrant A Data is divided into 100 sec bins |
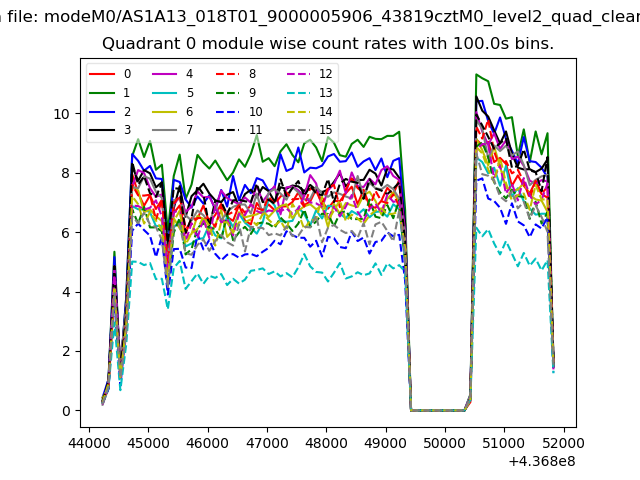 |
 |
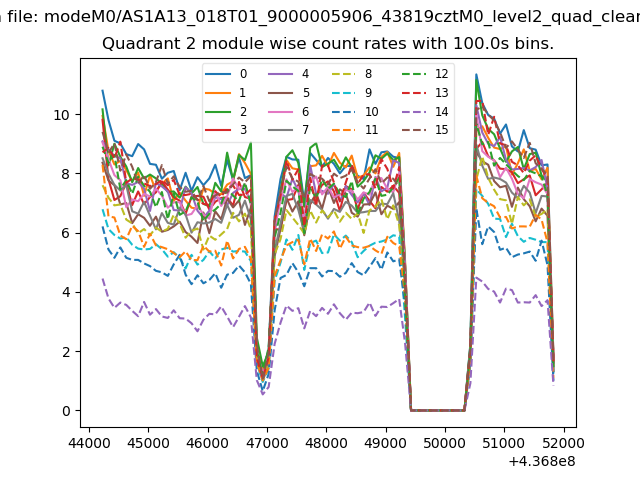
| Module-wise count rates for Quadrant B Data is divided into 100 sec bins |
 |
 |
| Module-wise count rates for Quadrant C Data is divided into 100 sec bins |
 |
 |
| Module-wise count rates for Quadrant D Data is divided into 100 sec bins |
 |
 |
| Parameter | Plot |
|---|---|
| CZT HV Monitor | 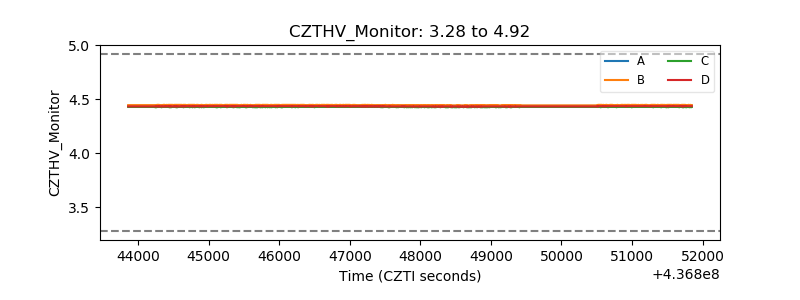 |
| D_VDD | 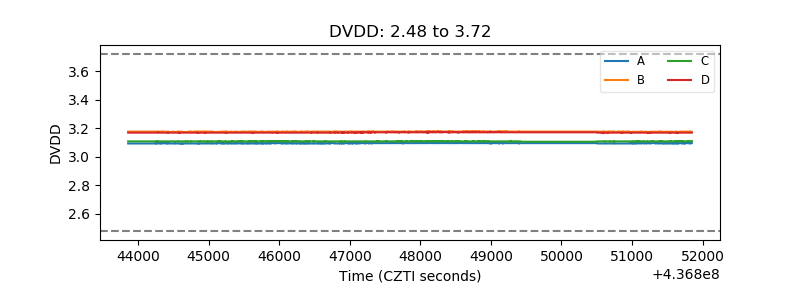 |
| Temperature 1 | 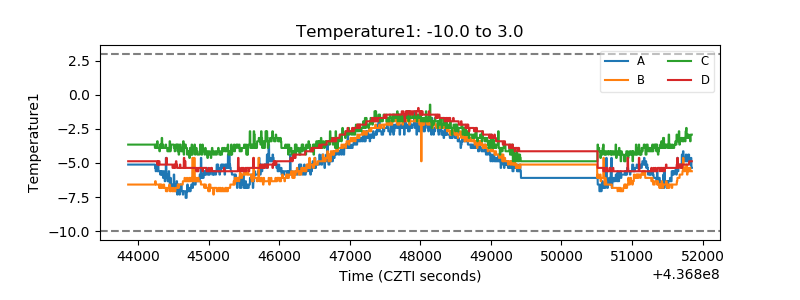 |
| Veto HV Monitor | 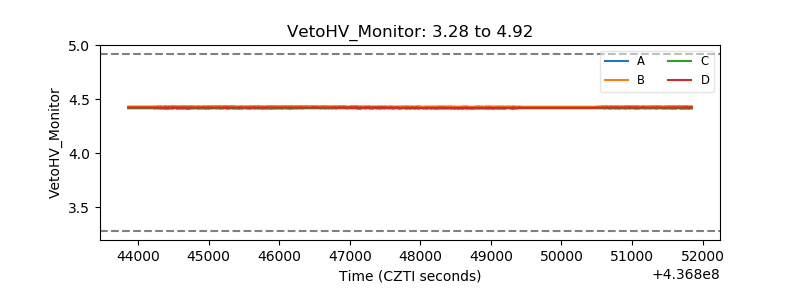 |
| Veto LLD | 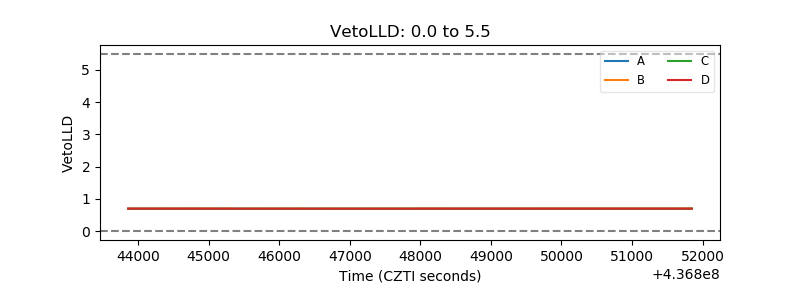 |
| Alpha Counter | 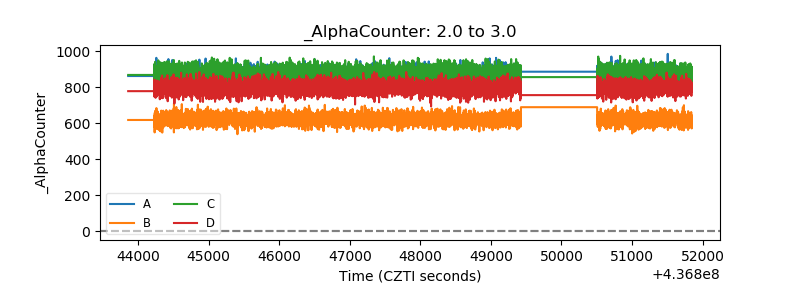 |
| _CPM_Rate | 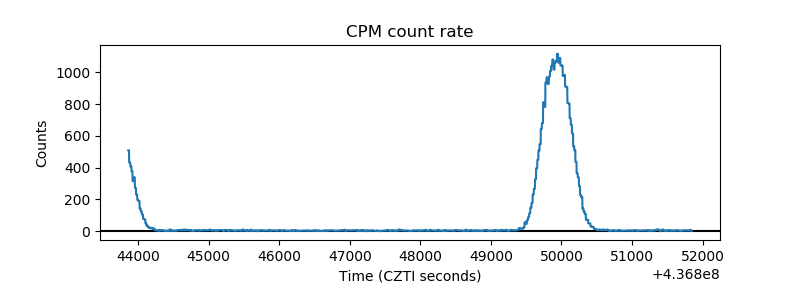 |
| CZT Counter | 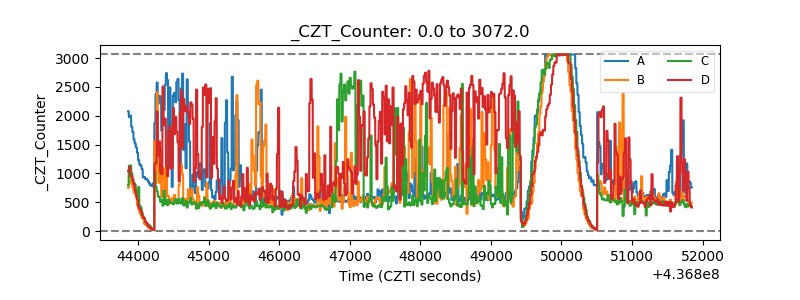 |
| +2.5 Volts monitor | 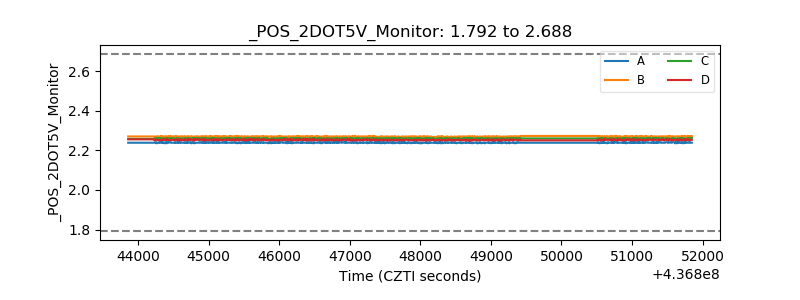 |
| +5 Volts monitor | 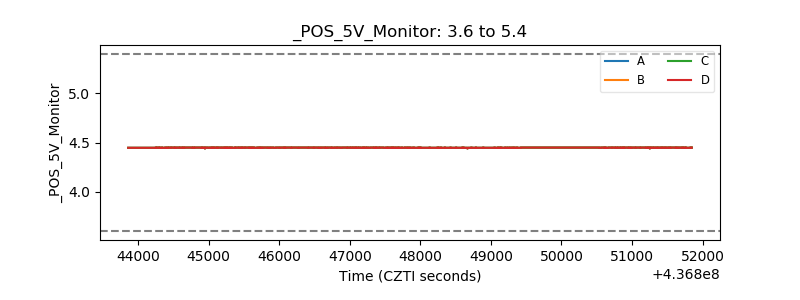 |
| _ROLL_ROT | 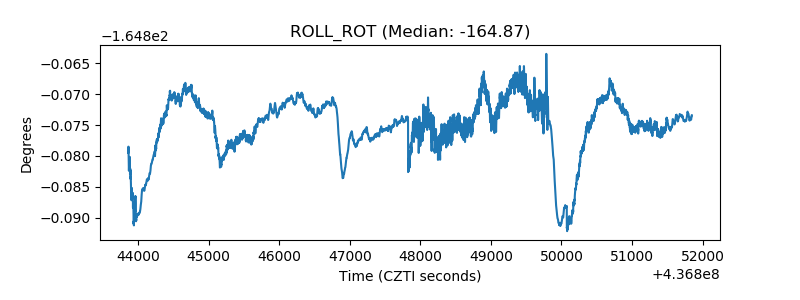 |
| _Roll_DEC | 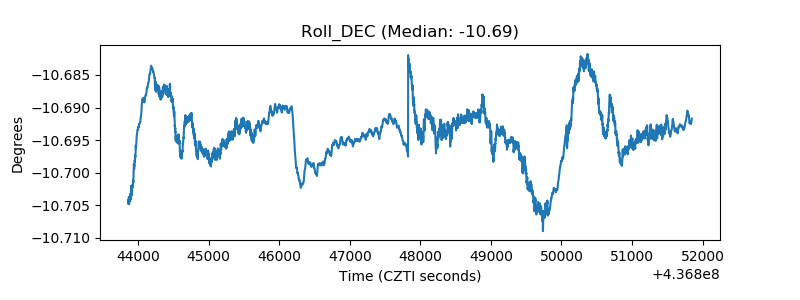 |
| _Roll_RA | 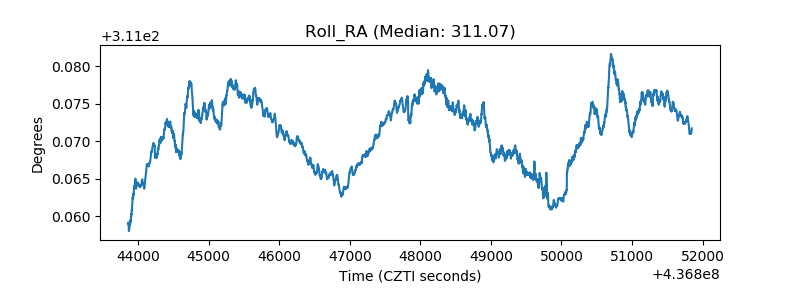 |
| Veto Counter | 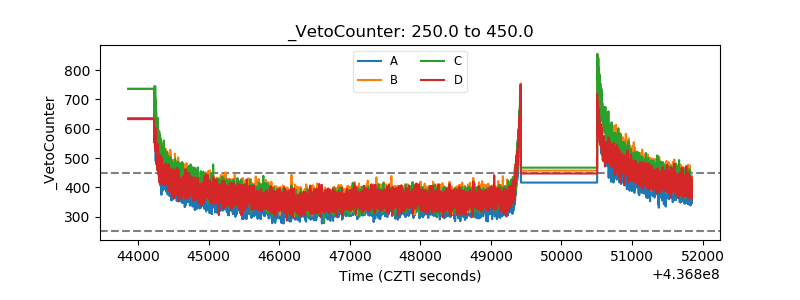 |