| Param | Original file | Final file |
|---|---|---|
| Filename | modeM0/AS1A13_018T01_9000005906_43821cztM0_level2.fits | modeM0/AS1A13_018T01_9000005906_43821cztM0_level2_quad_clean.evt |
| Size (bytes) | 733,599,360 | 109,226,880 |
| Size | 699.6 MB | 104.2 MB |
| Events in quadrant A | 5,445,182 | 795,128 |
| Events in quadrant B | 6,594,090 | 752,230 |
| Events in quadrant C | 4,477,045 | 784,534 |
| Events in quadrant D | 10,144,949 | 529,023 |
| Mode M0 | |||
|---|---|---|---|
| Quadrant | BADHDUFLAG | Total packets | Discarded packets |
| A | 0 | 20942 | 2 |
| B | 0 | 23954 | 2 |
| C | 0 | 17325 | 2 |
| D | 0 | 34626 | 2 |
| Mode SS | |||
|---|---|---|---|
| Quadrant | BADHDUFLAG | Total packets | Discarded packets |
| A | 0 | 132 | 0 |
| B | 0 | 132 | 0 |
| C | 0 | 132 | 0 |
| D | 0 | 132 | 0 |
| Mode M9 | |||
|---|---|---|---|
| Quadrant | BADHDUFLAG | Total packets | Discarded packets |
| A | 0 | 11 | 0 |
| B | 0 | 11 | 0 |
| C | 0 | 11 | 0 |
| D | 0 | 11 | 0 |
| Quadrant | Total seconds | Saturated seconds | Saturation percentage |
|---|---|---|---|
| A | 6391 | 337 | 5.273040% |
| B | 6392 | 1085 | 16.974343% |
| C | 6392 | 377 | 5.897997% |
| D | 6392 | 2237 | 34.996871% |
Noise dominated data is calculated using 1-second bins in cleaned event files. If a bin has >2000 counts, and if more than 50% of those come from <1% of pixels, then it is considered to be noise-dominated and hence unusable.
| Quadrant | # 1 sec bins | Bins with >0 counts | Bins with >2000 counts | High rate bins dominated by noise | Noise dominated (total time) | Noise dominated (detector-on time) | Marked lightcurve |
|---|---|---|---|---|---|---|---|
| A | 7576 | 6391 | 113 | 113 | 1.49% | 1.77% | 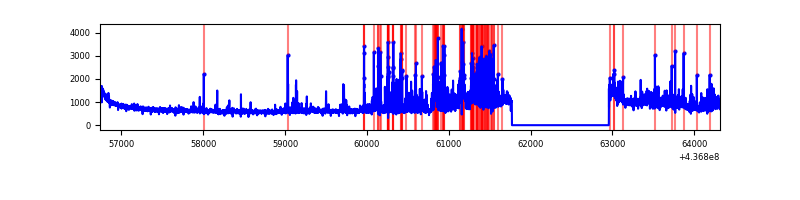 |
| B | 7577 | 6392 | 702 | 702 | 9.26% | 10.98% | 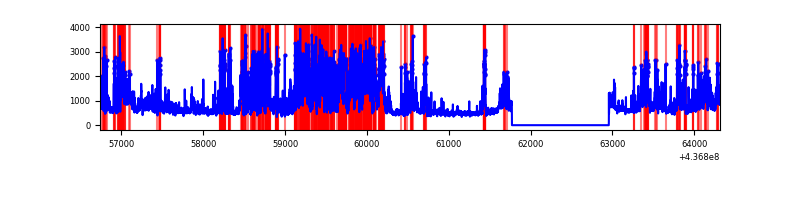 |
| C | 7577 | 6392 | 241 | 241 | 3.18% | 3.77% | 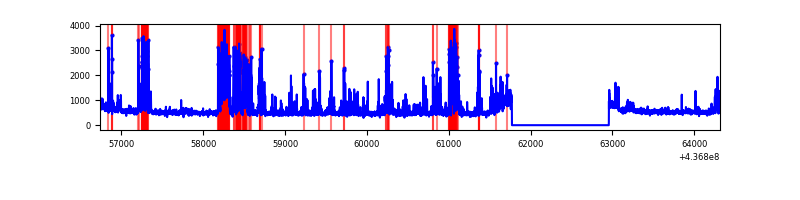 |
| D | 7577 | 6392 | 1909 | 1909 | 25.19% | 29.87% | 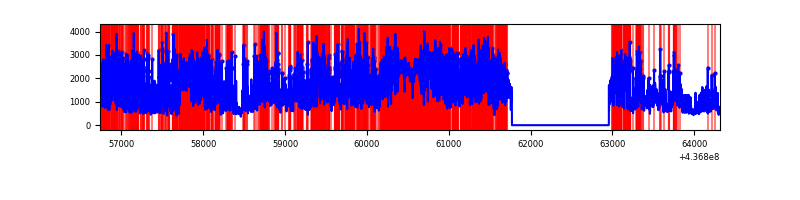 |
Top three noisy pixels from each quadrant. If the there are fewer than three noisy pixels in the level2.evt file, extra rows are filled as -1
| Pixel properties | Quadrant properties | ||||||
|---|---|---|---|---|---|---|---|
| Quadrant | DetID | PixID | Counts | Sigma | Mean | Median | Sigma |
| A | 10 | 83 | 991109 | 5931.3 | 816 | 799 | 167.0 |
| A | 15 | 223 | 644230 | 3853.72 | 816 | 799 | 167.0 |
| A | 14 | 254 | 560314 | 3351.12 | 816 | 799 | 167.0 |
| B | 0 | 200 | 1935242 | 12722.14 | 786 | 765 | 152.1 |
| B | 5 | 235 | 875264 | 5751.17 | 786 | 765 | 152.1 |
| B | 5 | 172 | 337557 | 2214.92 | 786 | 765 | 152.1 |
| C | 15 | 174 | 726844 | 3877.63 | 797 | 804 | 187.2 |
| C | 14 | 96 | 268842 | 1431.54 | 797 | 804 | 187.2 |
| C | 15 | 158 | 175901 | 935.16 | 797 | 804 | 187.2 |
| D | 10 | 102 | 2517822 | 14118.03 | 702 | 682 | 178.3 |
| D | 12 | 2 | 1891893 | 10607.34 | 702 | 682 | 178.3 |
| D | 12 | 33 | 1721268 | 9650.35 | 702 | 682 | 178.3 |
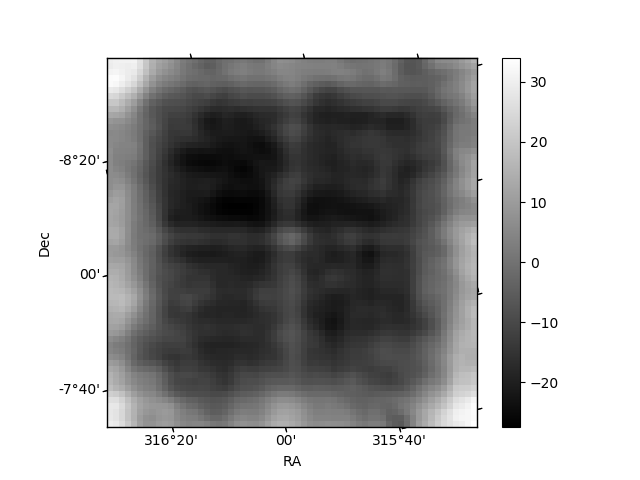
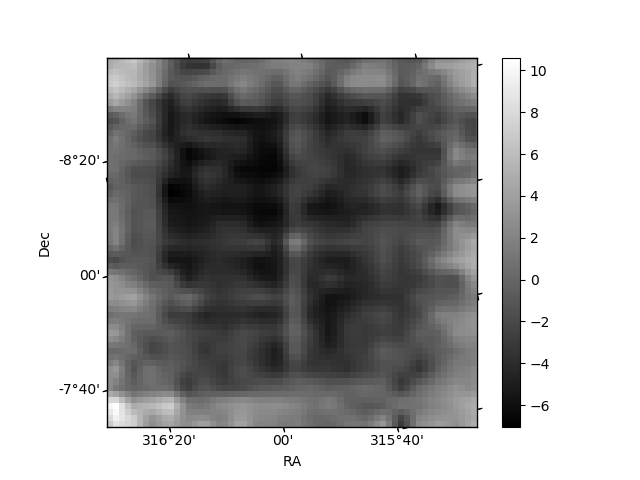
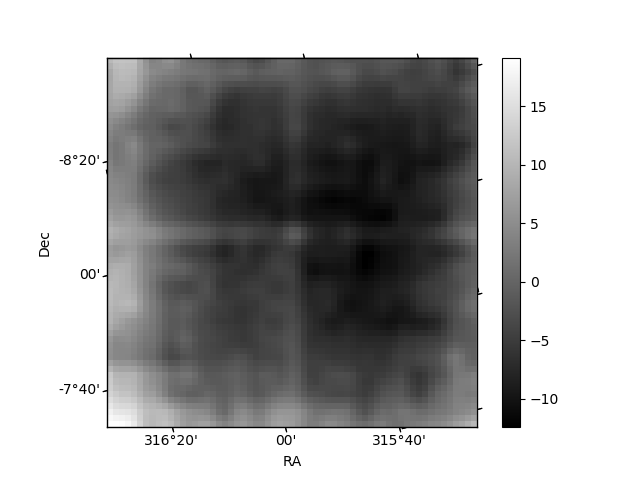
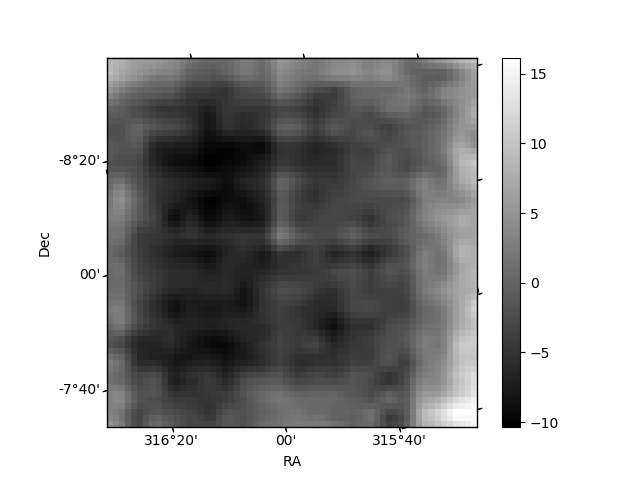
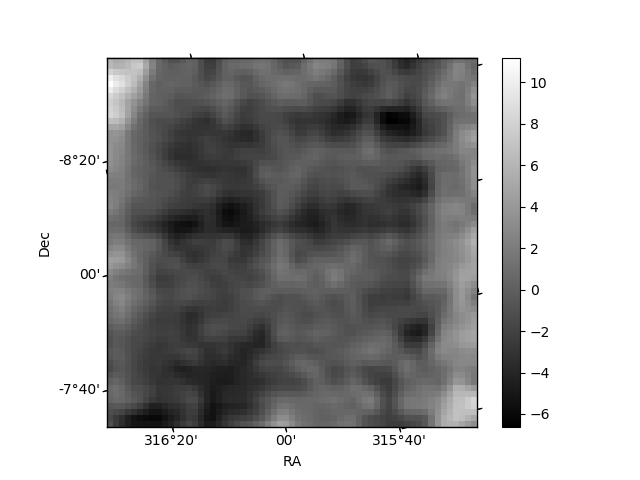
Histogram calculated using DETX and DETY for each event in the final _common_clean file
| Quadrant A | 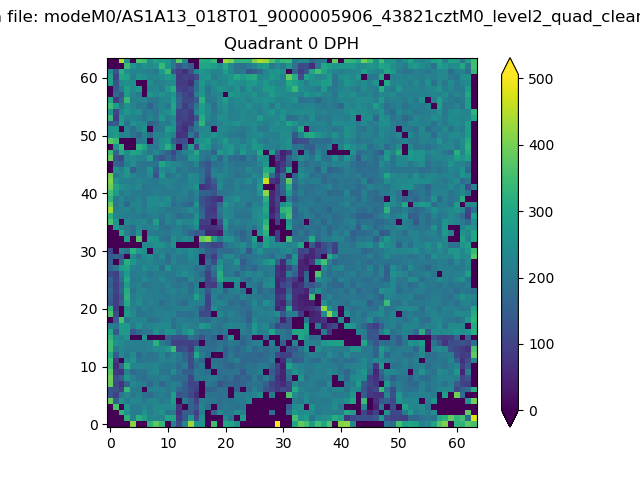 |
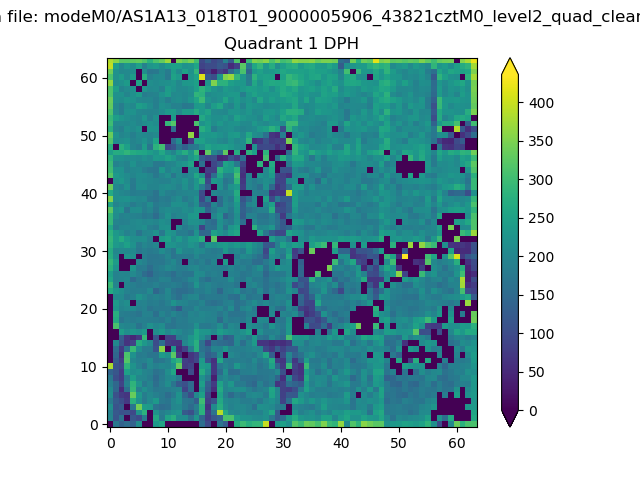 |
Quadrant B |
|---|---|---|---|
| Quadrant D | 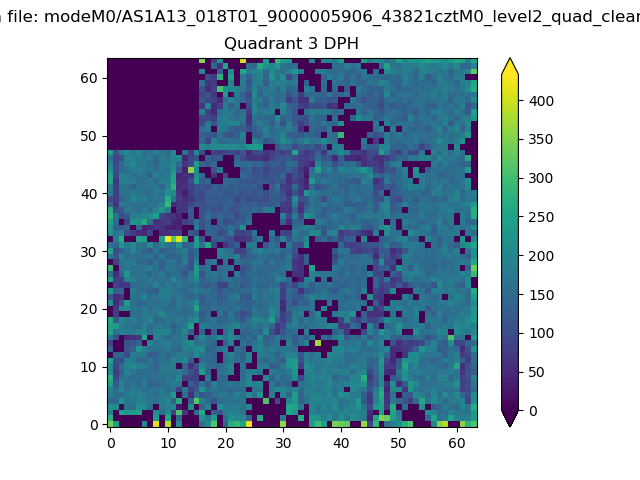 |
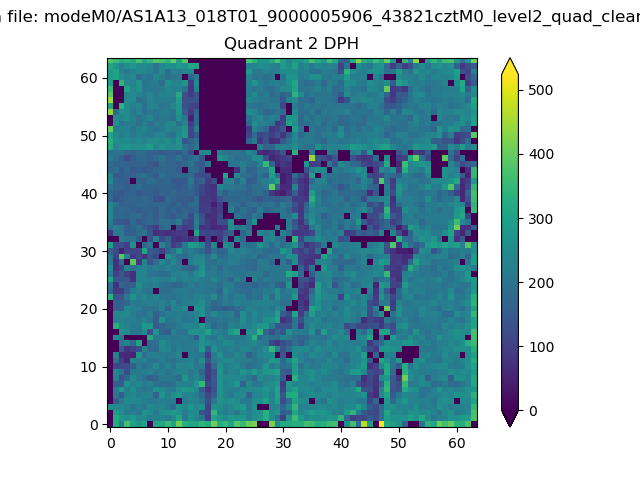 |
Quadrant C |
| Plot type | Count rate plots | Images |
|---|---|---|
| Comparison with Poisson distribution Blue bars denote a histogram of data divided into 1 sec bins. Red curve is a Poisson curve with rate = median count rate of data. |
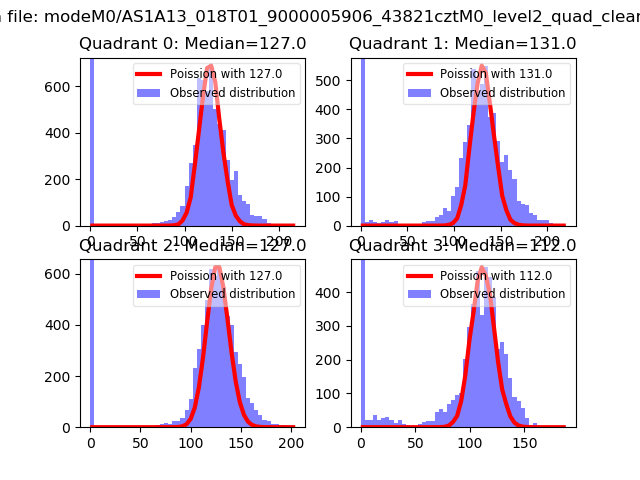 |
 |
| Quadrant-wise count rates Data is divided into 100 sec bins |
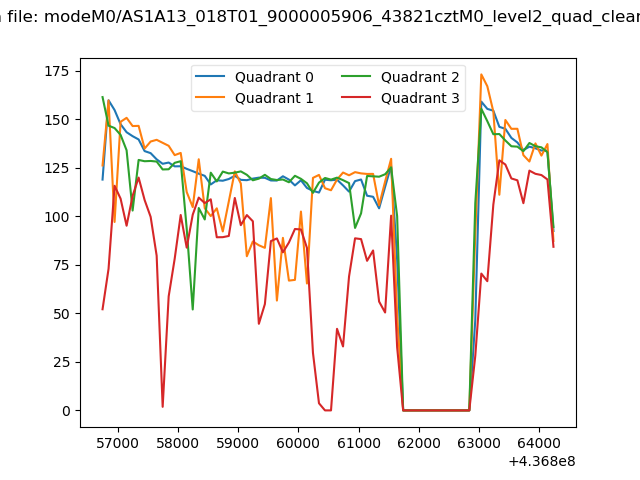 |
|
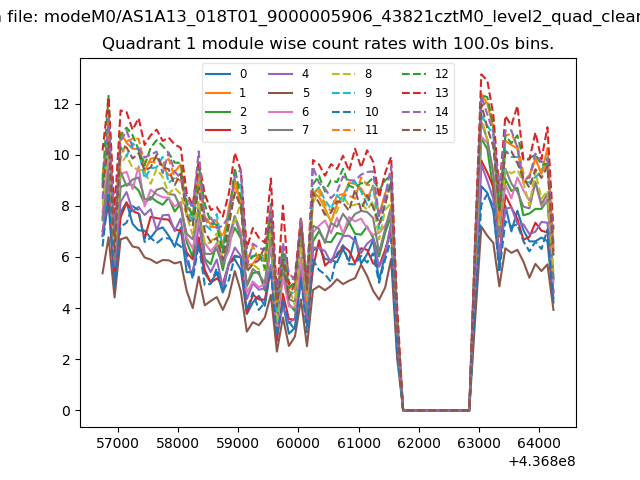
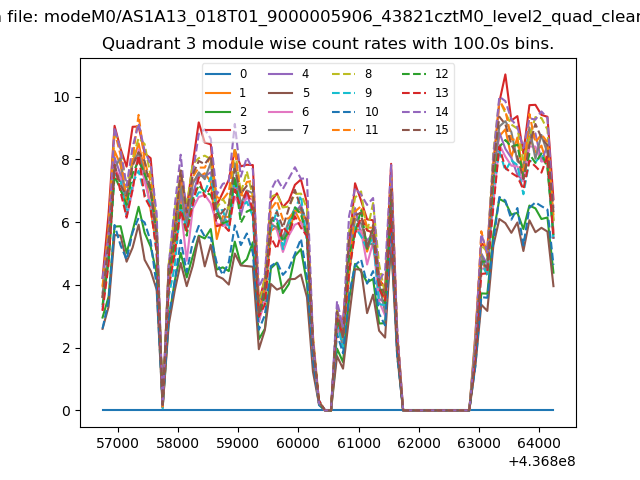
| Module-wise count rates for Quadrant A Data is divided into 100 sec bins |
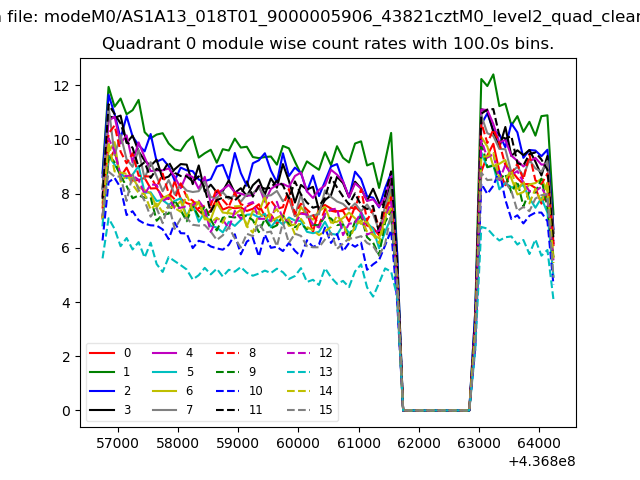 |
 |
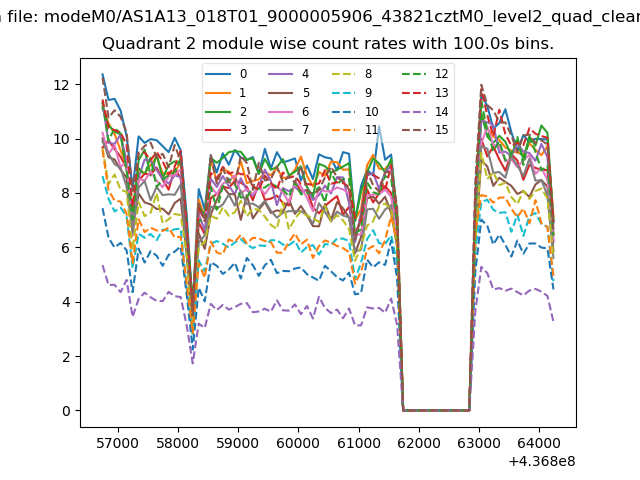
| Module-wise count rates for Quadrant B Data is divided into 100 sec bins |
 |
 |
| Module-wise count rates for Quadrant C Data is divided into 100 sec bins |
 |
 |
| Module-wise count rates for Quadrant D Data is divided into 100 sec bins |
 |
 |
| Parameter | Plot |
|---|---|
| CZT HV Monitor | 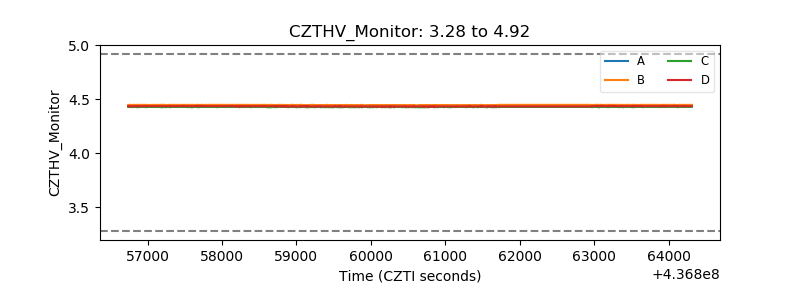 |
| D_VDD | 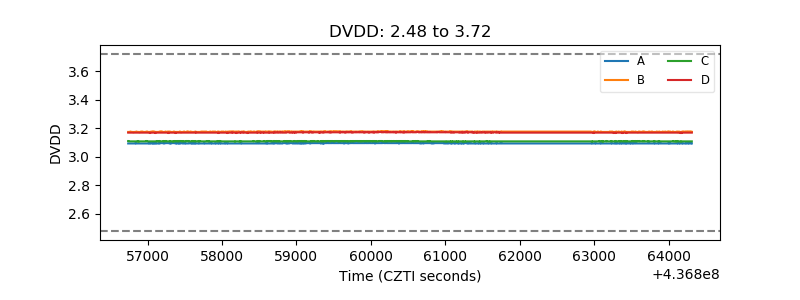 |
| Temperature 1 | 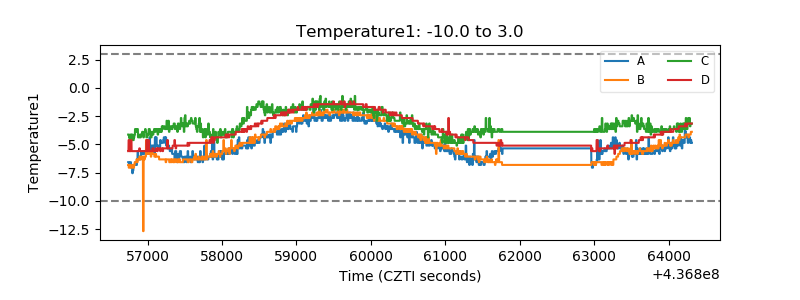 |
| Veto HV Monitor | 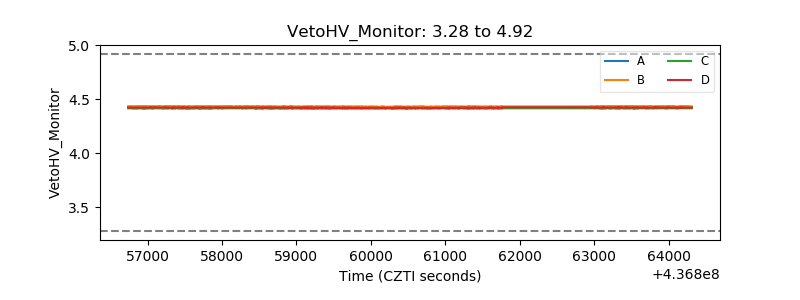 |
| Veto LLD | 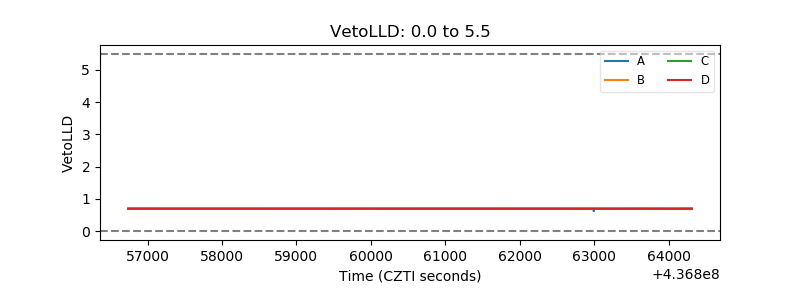 |
| Alpha Counter | 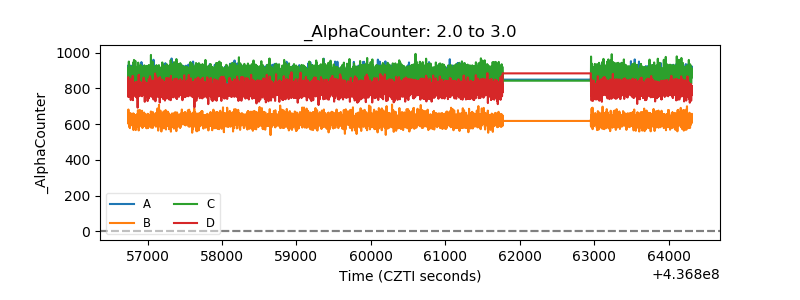 |
| _CPM_Rate | 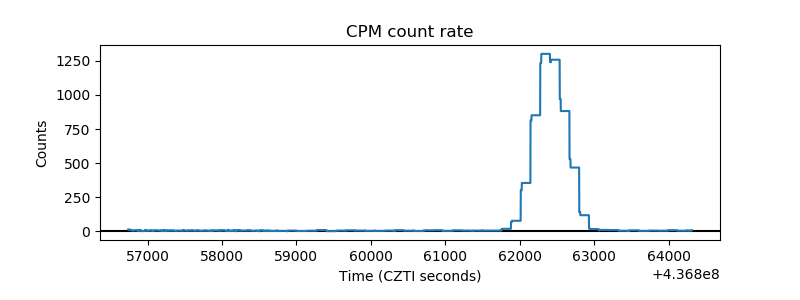 |
| CZT Counter | 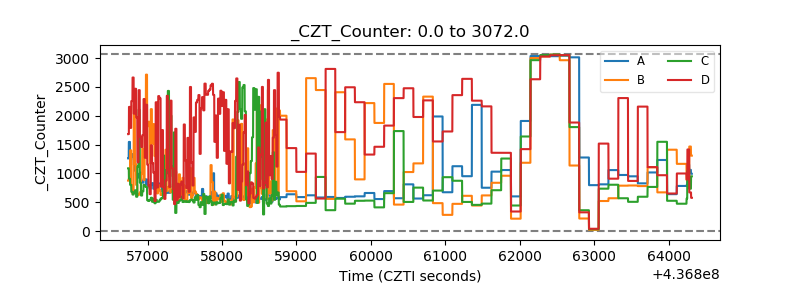 |
| +2.5 Volts monitor | 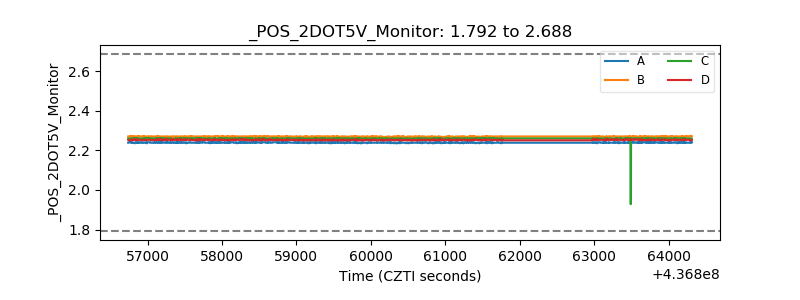 |
| +5 Volts monitor | 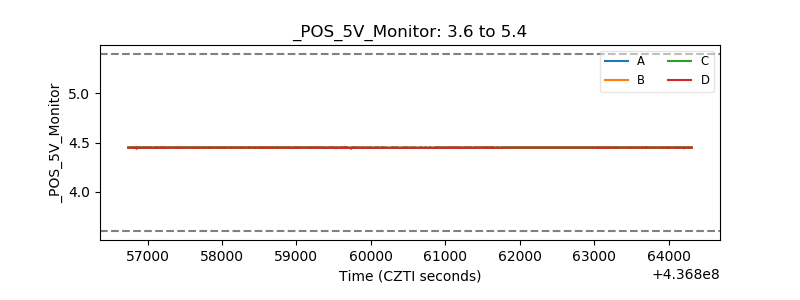 |
| _ROLL_ROT | 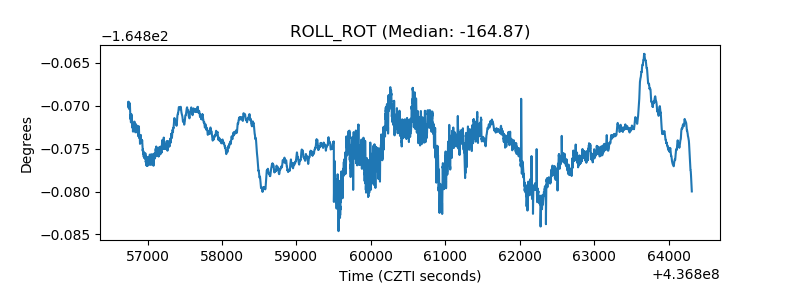 |
| _Roll_DEC | 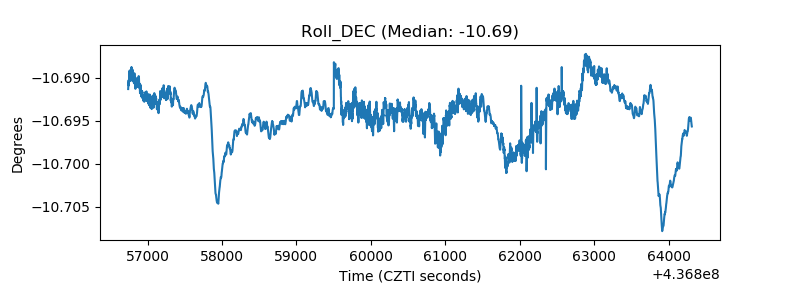 |
| _Roll_RA | 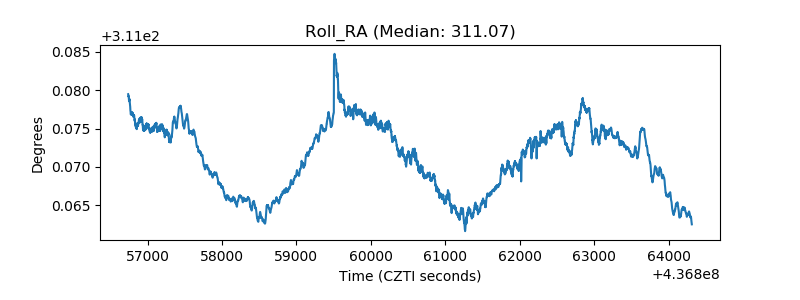 |
| Veto Counter | 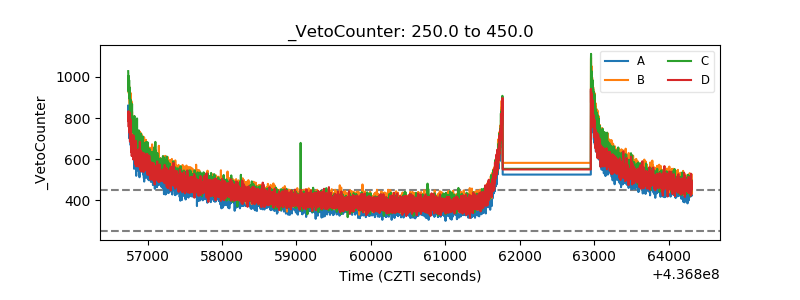 |