| Param | Original file | Final file |
|---|---|---|
| Filename | modeM0/AS1A13_018T01_9000005906_43822cztM0_level2.fits | modeM0/AS1A13_018T01_9000005906_43822cztM0_level2_quad_clean.evt |
| Size (bytes) | 2,393,752,320 | 341,426,880 |
| Size | 2.2 GB | 325.6 MB |
| Events in quadrant A | 20,315,309 | 2,302,901 |
| Events in quadrant B | 17,746,335 | 2,522,141 |
| Events in quadrant C | 14,468,273 | 2,519,119 |
| Events in quadrant D | 34,399,542 | 1,491,227 |
| Mode M0 | |||
|---|---|---|---|
| Quadrant | BADHDUFLAG | Total packets | Discarded packets |
| A | 0 | 75792 | 9 |
| B | 0 | 67061 | 5 |
| C | 0 | 57202 | 5 |
| D | 0 | 117297 | 12 |
| Mode SS | |||
|---|---|---|---|
| Quadrant | BADHDUFLAG | Total packets | Discarded packets |
| A | 0 | 448 | 0 |
| B | 0 | 448 | 0 |
| C | 0 | 448 | 0 |
| D | 0 | 448 | 0 |
| Mode M9 | |||
|---|---|---|---|
| Quadrant | BADHDUFLAG | Total packets | Discarded packets |
| A | 0 | 48 | 0 |
| B | 0 | 49 | 0 |
| C | 0 | 49 | 0 |
| D | 0 | 49 | 0 |
| Quadrant | Total seconds | Saturated seconds | Saturation percentage |
|---|---|---|---|
| A | 21804 | 2428 | 11.135571% |
| B | 21805 | 2004 | 9.190553% |
| C | 21805 | 1296 | 5.943591% |
| D | 21804 | 8399 | 38.520455% |
Noise dominated data is calculated using 1-second bins in cleaned event files. If a bin has >2000 counts, and if more than 50% of those come from <1% of pixels, then it is considered to be noise-dominated and hence unusable.
| Quadrant | # 1 sec bins | Bins with >0 counts | Bins with >2000 counts | High rate bins dominated by noise | Noise dominated (total time) | Noise dominated (detector-on time) | Marked lightcurve |
|---|---|---|---|---|---|---|---|
| A | 26435 | 21805 | 1678 | 1678 | 6.35% | 7.70% | 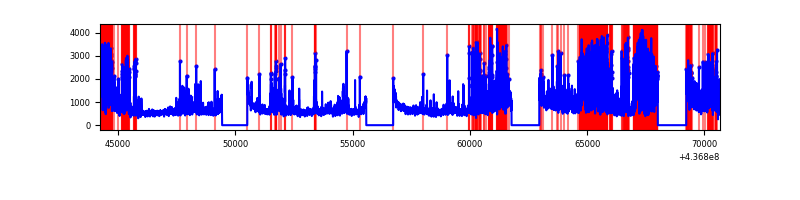 |
| B | 26435 | 21806 | 1205 | 1205 | 4.56% | 5.53% | 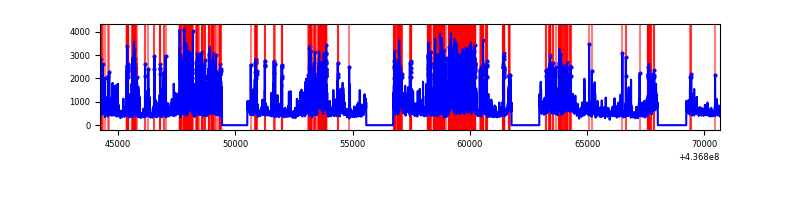 |
| C | 26435 | 21805 | 938 | 938 | 3.55% | 4.30% | 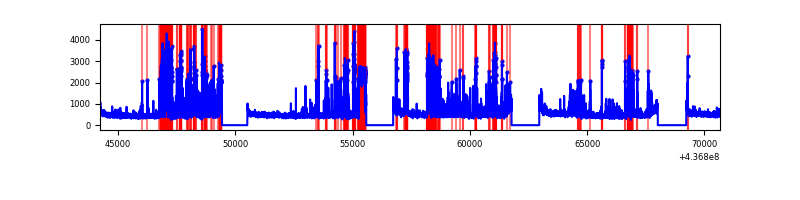 |
| D | 26433 | 21803 | 7260 | 7260 | 27.47% | 33.30% | 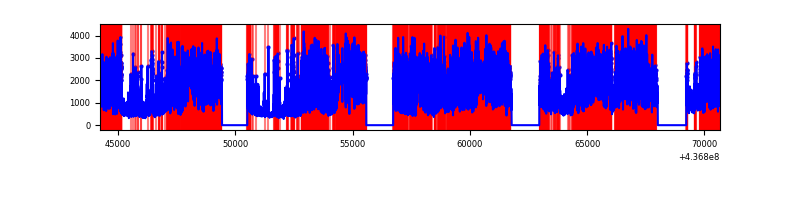 |
Top three noisy pixels from each quadrant. If the there are fewer than three noisy pixels in the level2.evt file, extra rows are filled as -1
| Pixel properties | Quadrant properties | ||||||
|---|---|---|---|---|---|---|---|
| Quadrant | DetID | PixID | Counts | Sigma | Mean | Median | Sigma |
| A | 15 | 223 | 4747018 | 9062.09 | 2565 | 2518 | 523.6 |
| A | 10 | 83 | 3147502 | 6006.98 | 2565 | 2518 | 523.6 |
| A | 14 | 254 | 2104920 | 4015.63 | 2565 | 2518 | 523.6 |
| B | 0 | 200 | 3189691 | 6333.56 | 2609 | 2538 | 503.2 |
| B | 5 | 235 | 2441537 | 4846.82 | 2609 | 2538 | 503.2 |
| B | 5 | 172 | 582408 | 1152.33 | 2609 | 2538 | 503.2 |
| C | 15 | 174 | 2724479 | 4543.89 | 2569 | 2586 | 599.0 |
| C | 15 | 158 | 711965 | 1184.23 | 2569 | 2586 | 599.0 |
| C | 14 | 96 | 276002 | 456.44 | 2569 | 2586 | 599.0 |
| D | 10 | 102 | 8858310 | 15546.08 | 2232 | 2163 | 569.7 |
| D | 12 | 33 | 7428952 | 13036.99 | 2232 | 2163 | 569.7 |
| D | 12 | 2 | 4101080 | 7195.24 | 2232 | 2163 | 569.7 |
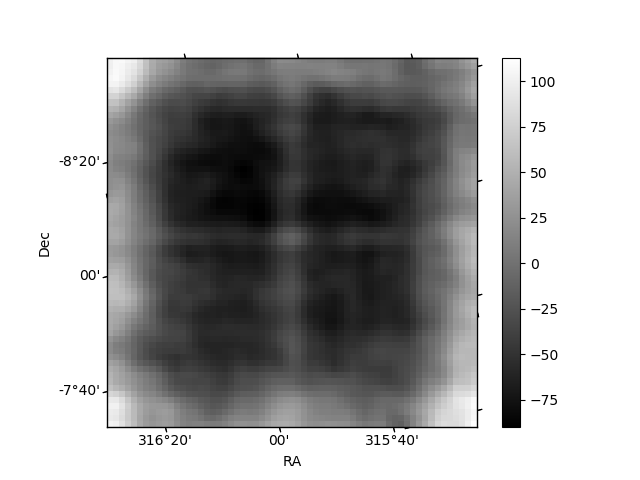
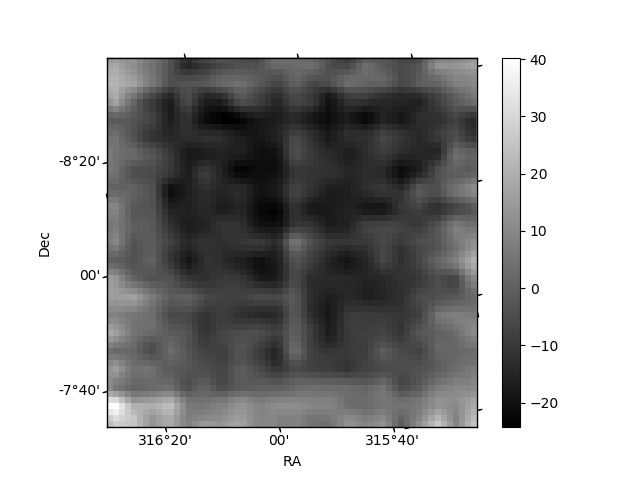
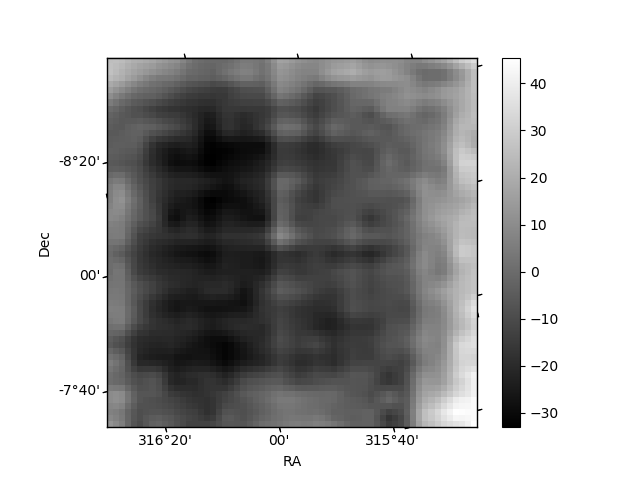
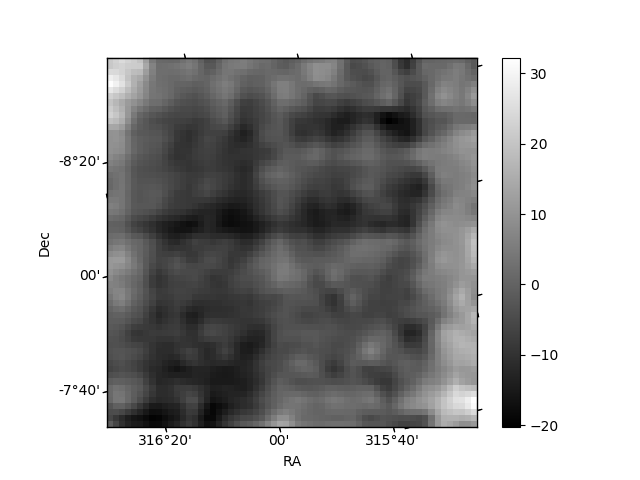
Histogram calculated using DETX and DETY for each event in the final _common_clean file
| Quadrant A | 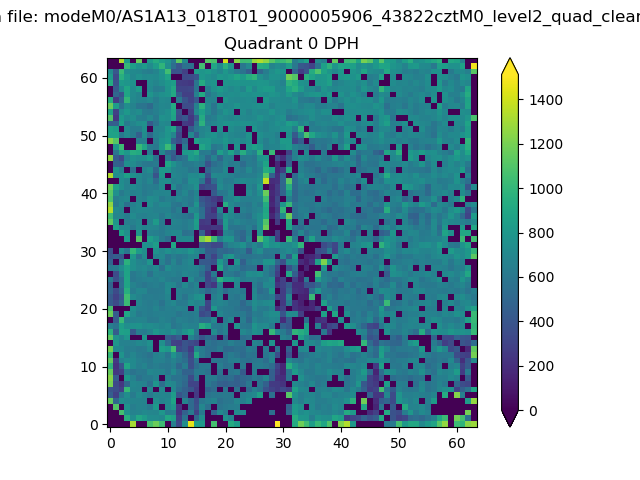 |
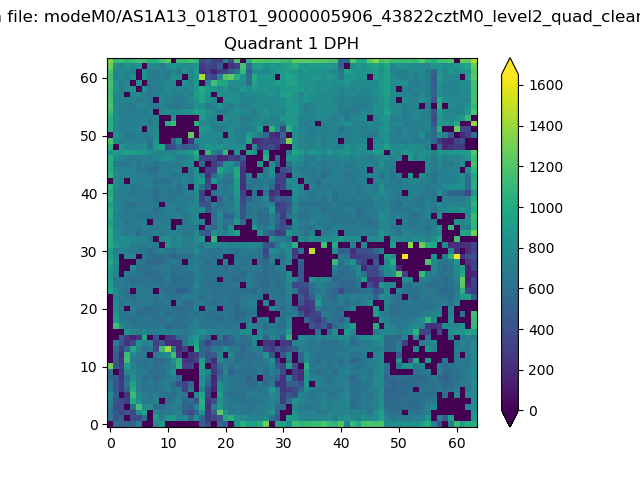 |
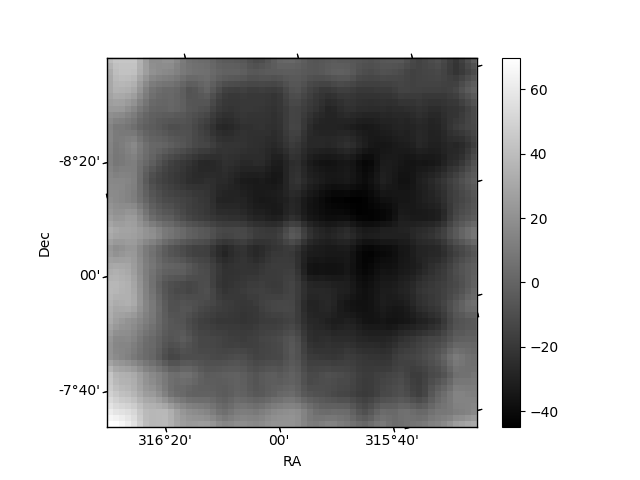
Quadrant B |
|---|---|---|---|
| Quadrant D | 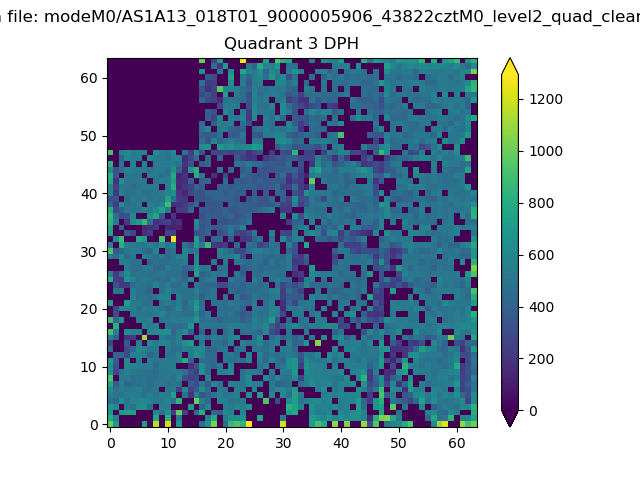 |
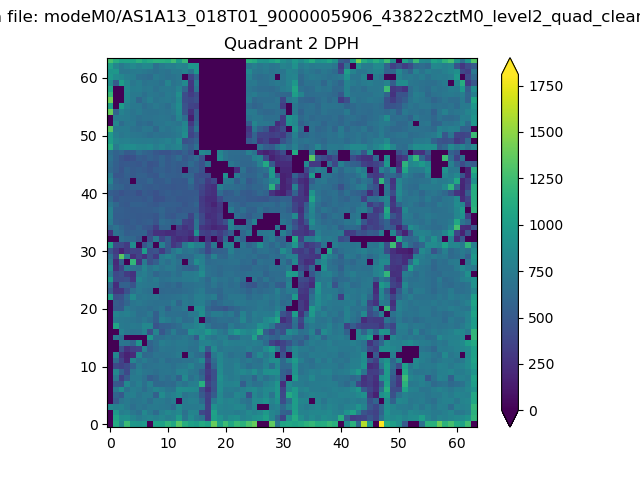 |
Quadrant C |
| Plot type | Count rate plots | Images |
|---|---|---|
| Comparison with Poisson distribution Blue bars denote a histogram of data divided into 1 sec bins. Red curve is a Poisson curve with rate = median count rate of data. |
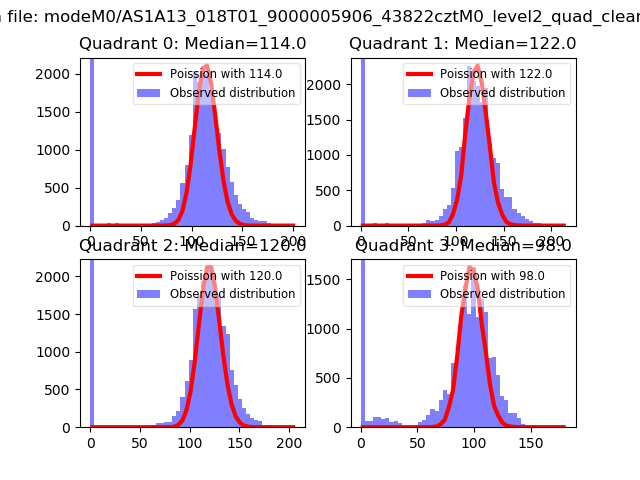 |
 |
| Quadrant-wise count rates Data is divided into 100 sec bins |
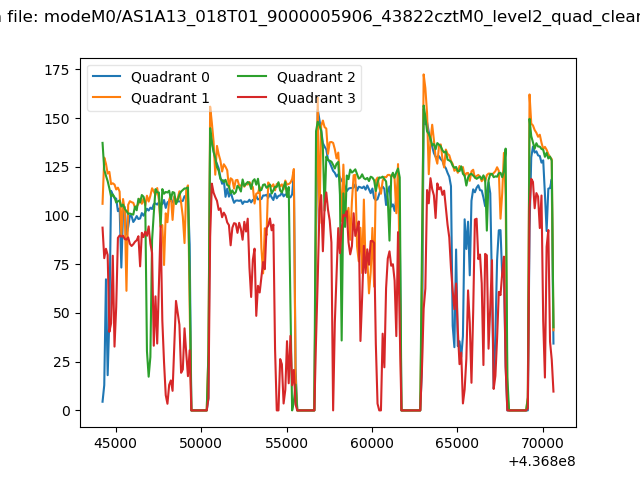 |
|
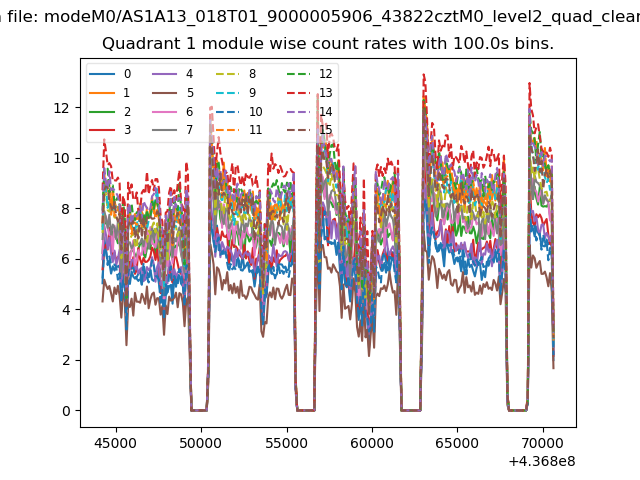
| Module-wise count rates for Quadrant A Data is divided into 100 sec bins |
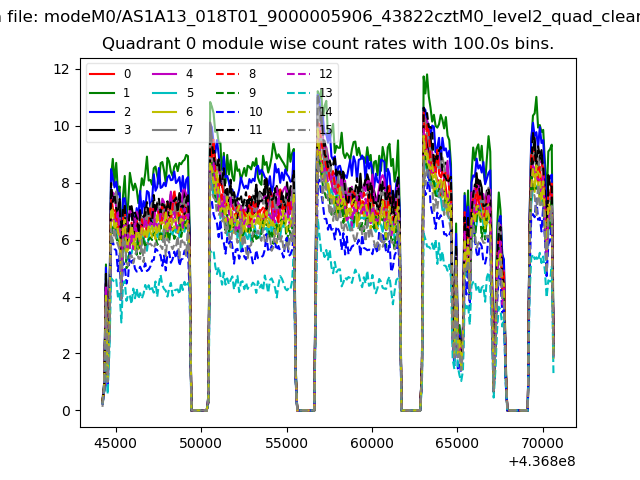 |
 |
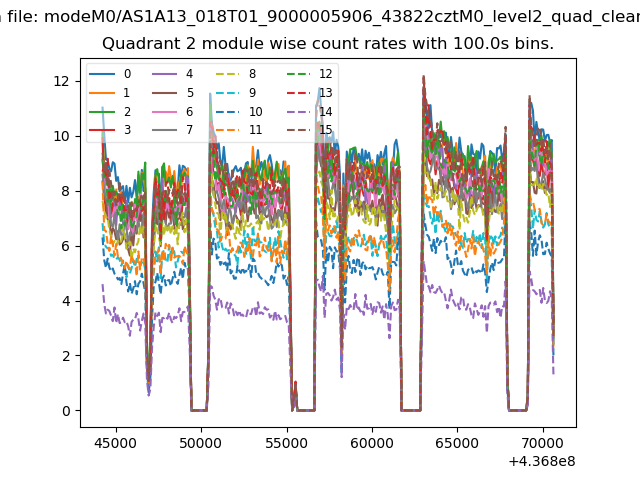
| Module-wise count rates for Quadrant B Data is divided into 100 sec bins |
 |
 |
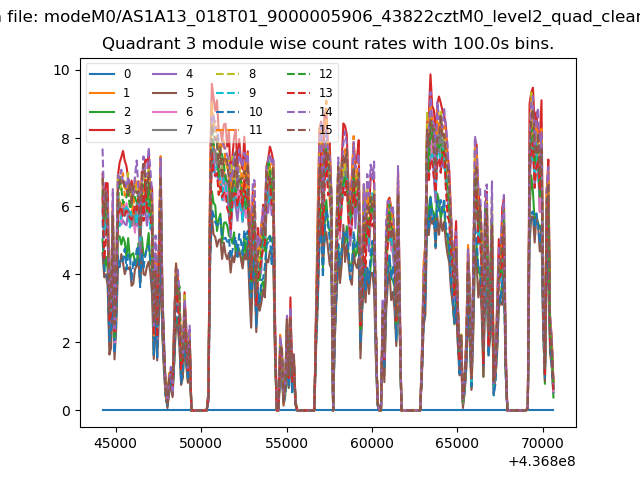
| Module-wise count rates for Quadrant C Data is divided into 100 sec bins |
 |
 |
| Module-wise count rates for Quadrant D Data is divided into 100 sec bins |
 |
 |
| Parameter | Plot |
|---|---|
| CZT HV Monitor | 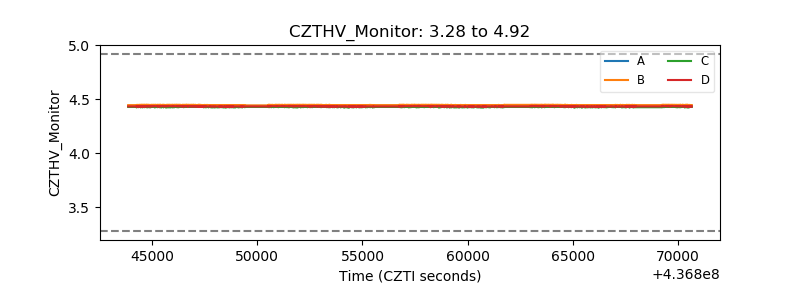 |
| D_VDD | 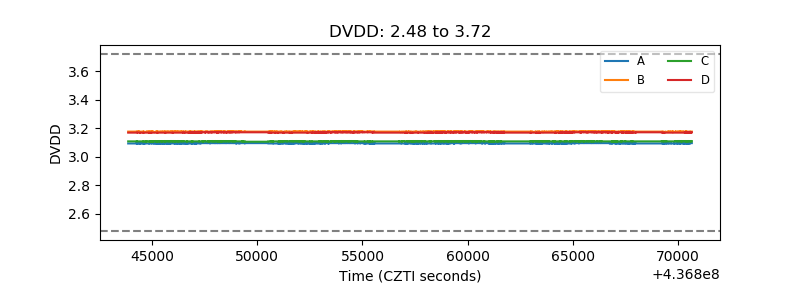 |
| Temperature 1 | 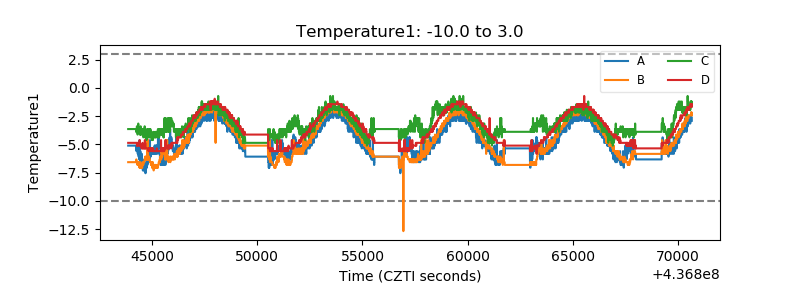 |
| Veto HV Monitor | 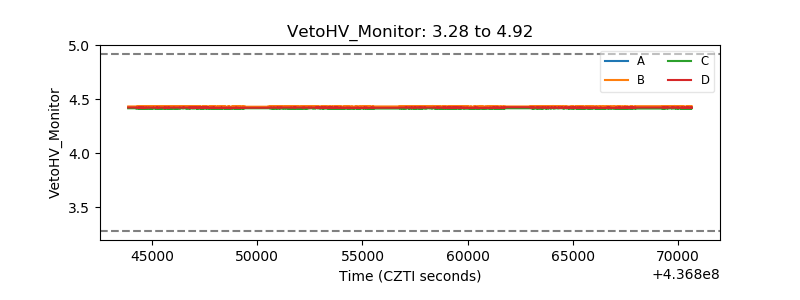 |
| Veto LLD | 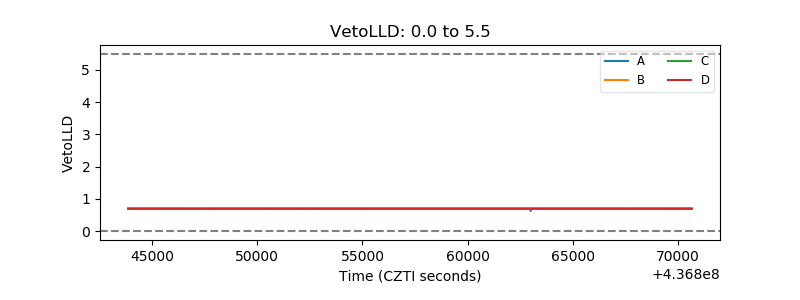 |
| Alpha Counter | 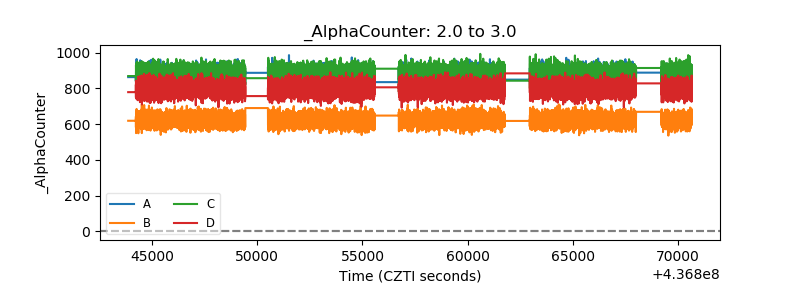 |
| _CPM_Rate | 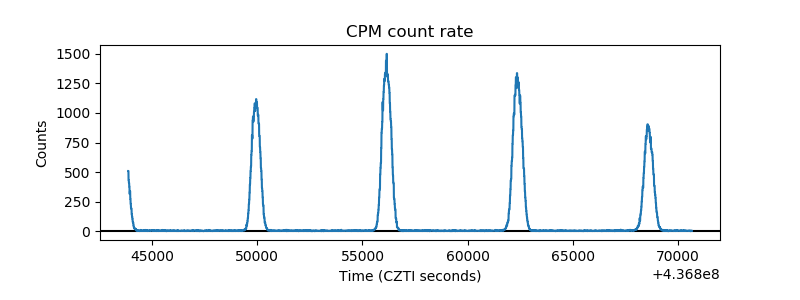 |
| CZT Counter |  |
| +2.5 Volts monitor | 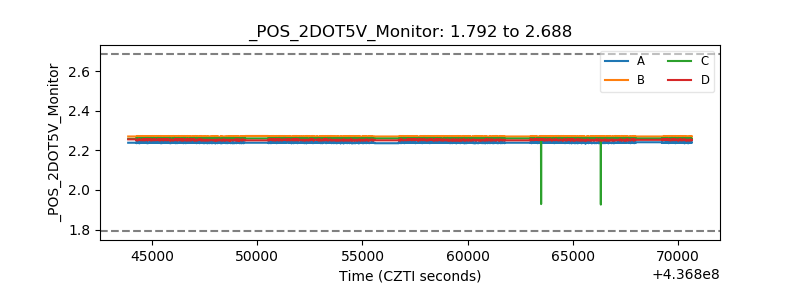 |
| +5 Volts monitor | 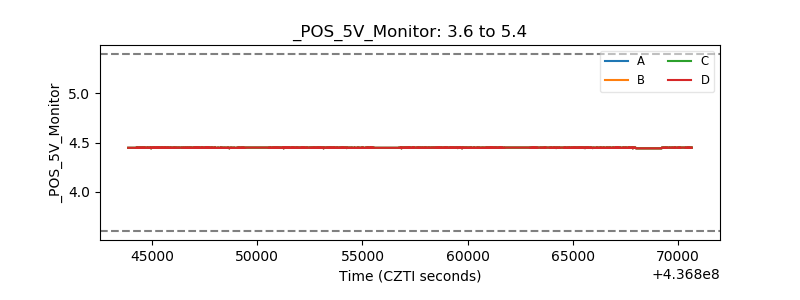 |
| _ROLL_ROT | 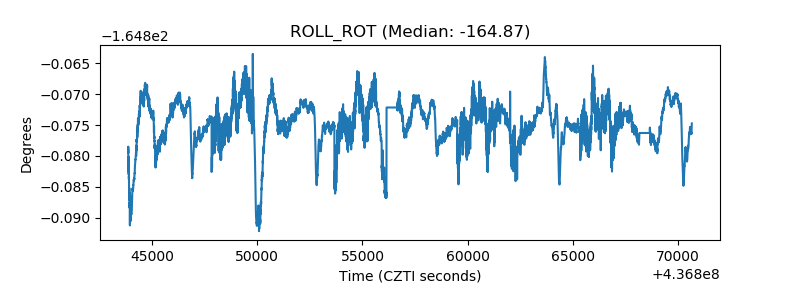 |
| _Roll_DEC | 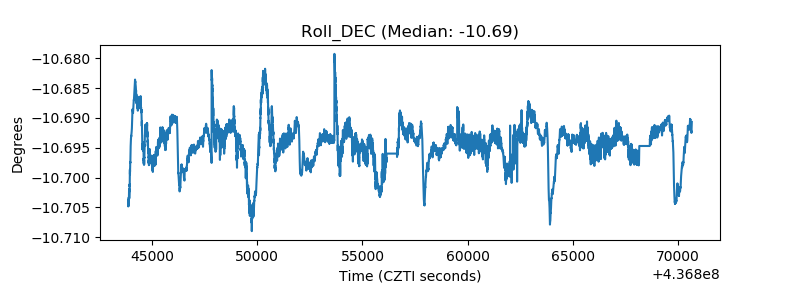 |
| _Roll_RA | 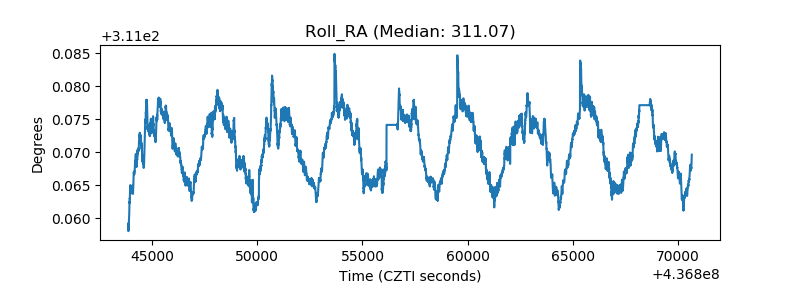 |
| Veto Counter | 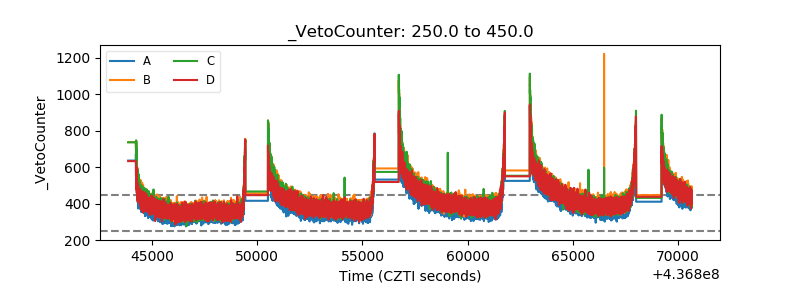 |