| Param | Original file | Final file |
|---|---|---|
| Filename | modeM0/AS1A13_018T01_9000005906_43823cztM0_level2.fits | modeM0/AS1A13_018T01_9000005906_43823cztM0_level2_quad_clean.evt |
| Size (bytes) | 761,515,200 | 102,035,520 |
| Size | 726.2 MB | 97.3 MB |
| Events in quadrant A | 10,207,506 | 481,542 |
| Events in quadrant B | 4,291,416 | 812,802 |
| Events in quadrant C | 3,610,851 | 800,422 |
| Events in quadrant D | 9,571,190 | 537,415 |
| Mode M0 | |||
|---|---|---|---|
| Quadrant | BADHDUFLAG | Total packets | Discarded packets |
| A | 0 | 34996 | 2 |
| B | 0 | 17021 | 2 |
| C | 0 | 14845 | 2 |
| D | 0 | 33025 | 2 |
| Mode SS | |||
|---|---|---|---|
| Quadrant | BADHDUFLAG | Total packets | Discarded packets |
| A | 0 | 134 | 0 |
| B | 0 | 134 | 0 |
| C | 0 | 134 | 0 |
| D | 0 | 134 | 0 |
| Mode M9 | |||
|---|---|---|---|
| Quadrant | BADHDUFLAG | Total packets | Discarded packets |
| A | 0 | 15 | 0 |
| B | 0 | 16 | 0 |
| C | 0 | 16 | 0 |
| D | 0 | 16 | 0 |
| Quadrant | Total seconds | Saturated seconds | Saturation percentage |
|---|---|---|---|
| A | 6556 | 2942 | 44.874924% |
| B | 6556 | 338 | 5.155583% |
| C | 6556 | 113 | 1.723612% |
| D | 6556 | 2109 | 32.169005% |
Noise dominated data is calculated using 1-second bins in cleaned event files. If a bin has >2000 counts, and if more than 50% of those come from <1% of pixels, then it is considered to be noise-dominated and hence unusable.
| Quadrant | # 1 sec bins | Bins with >0 counts | Bins with >2000 counts | High rate bins dominated by noise | Noise dominated (total time) | Noise dominated (detector-on time) | Marked lightcurve |
|---|---|---|---|---|---|---|---|
| A | 7666 | 6556 | 2370 | 2370 | 30.92% | 36.15% | 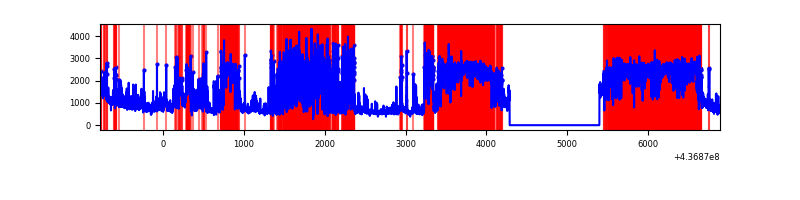 |
| B | 7666 | 6557 | 147 | 147 | 1.92% | 2.24% | 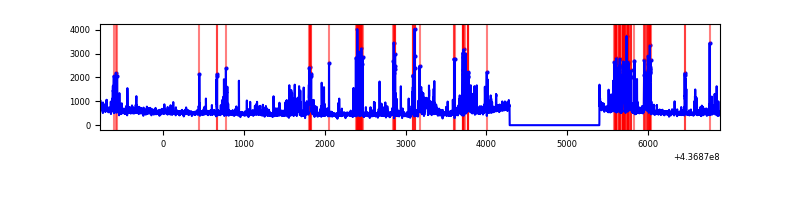 |
| C | 7666 | 6556 | 37 | 37 | 0.48% | 0.56% | 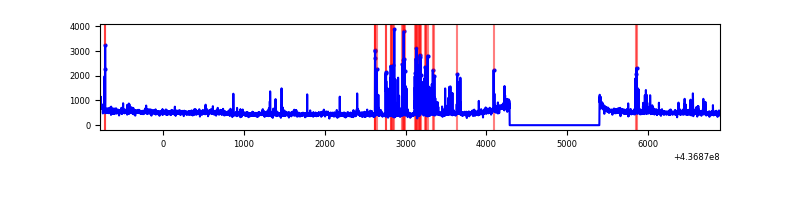 |
| D | 7666 | 6556 | 1783 | 1783 | 23.26% | 27.20% | 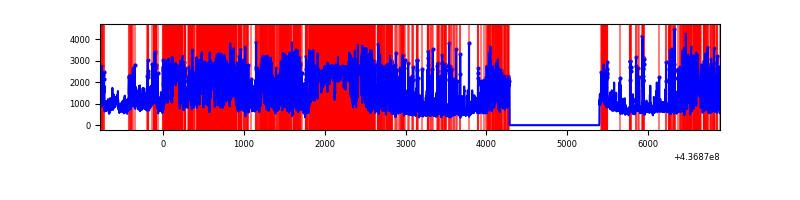 |
Top three noisy pixels from each quadrant. If the there are fewer than three noisy pixels in the level2.evt file, extra rows are filled as -1
| Pixel properties | Quadrant properties | ||||||
|---|---|---|---|---|---|---|---|
| Quadrant | DetID | PixID | Counts | Sigma | Mean | Median | Sigma |
| A | 15 | 223 | 5068024 | 38116.43 | 644 | 633 | 132.9 |
| A | 14 | 254 | 1630681 | 12261.07 | 644 | 633 | 132.9 |
| A | 10 | 83 | 872306 | 6556.64 | 644 | 633 | 132.9 |
| B | 5 | 235 | 555564 | 3470.02 | 806 | 782 | 159.9 |
| B | 5 | 172 | 309993 | 1934.03 | 806 | 782 | 159.9 |
| B | 4 | 170 | 124005 | 770.73 | 806 | 782 | 159.9 |
| C | 15 | 158 | 187913 | 998.1 | 799 | 805 | 187.5 |
| C | 3 | 233 | 144565 | 766.86 | 799 | 805 | 187.5 |
| C | 15 | 157 | 88138 | 465.86 | 799 | 805 | 187.5 |
| D | 12 | 2 | 1791849 | 10323.6 | 693 | 673 | 173.5 |
| D | 10 | 102 | 1622364 | 9346.75 | 693 | 673 | 173.5 |
| D | 12 | 33 | 1409362 | 8119.1 | 693 | 673 | 173.5 |
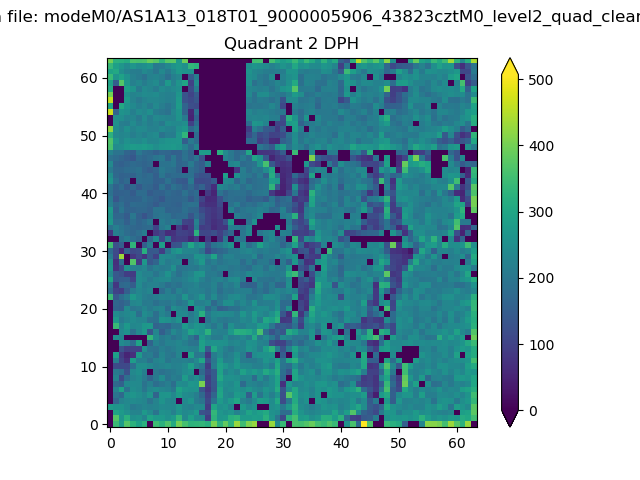
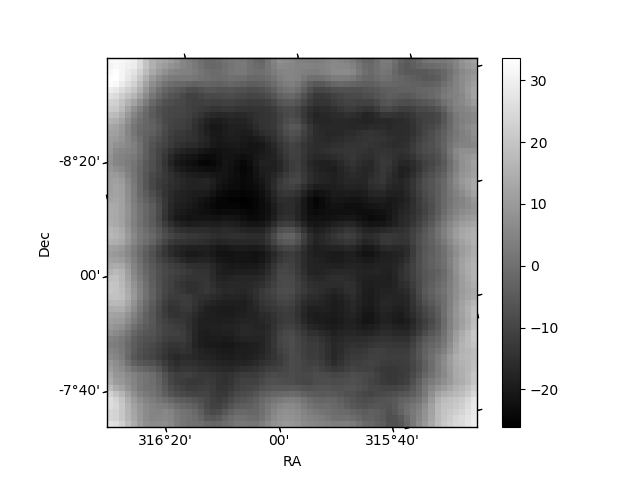
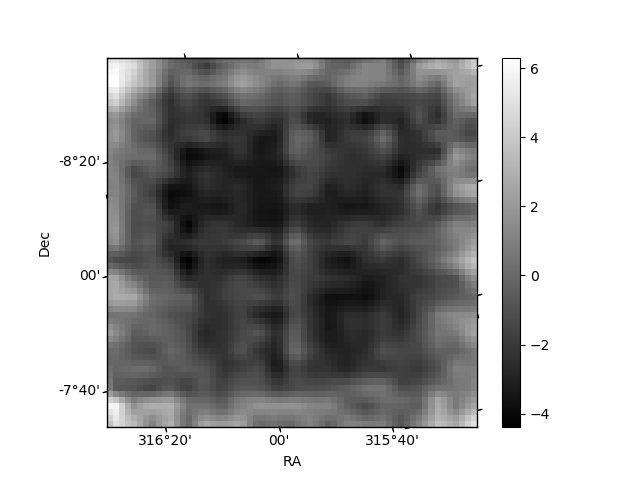
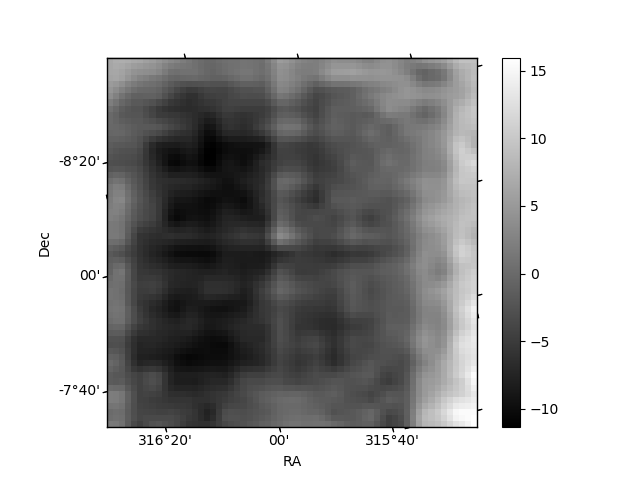
Histogram calculated using DETX and DETY for each event in the final _common_clean file
| Quadrant A | 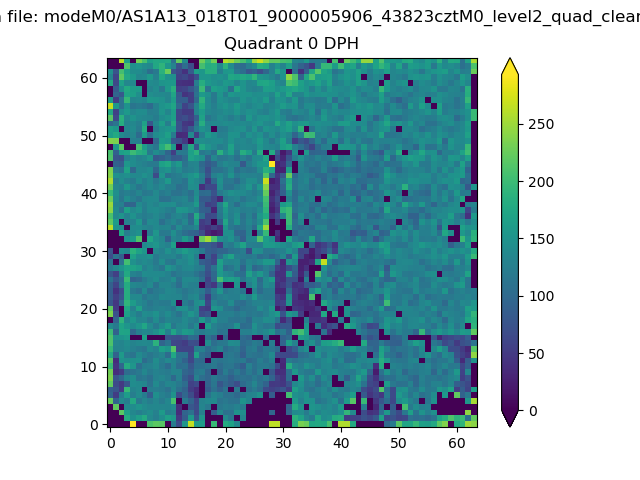 |
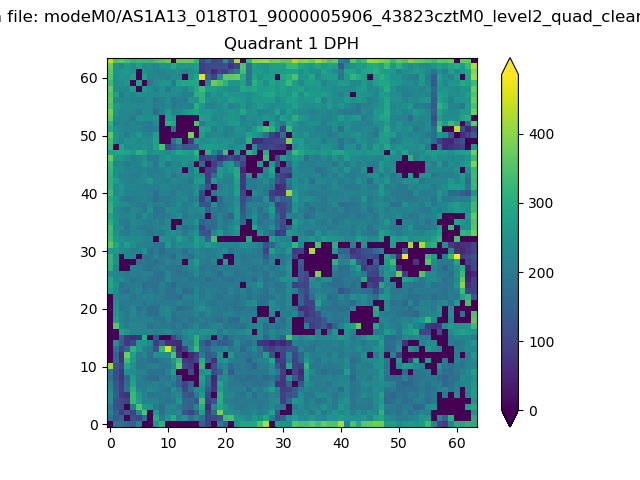 |
Quadrant B |
|---|---|---|---|
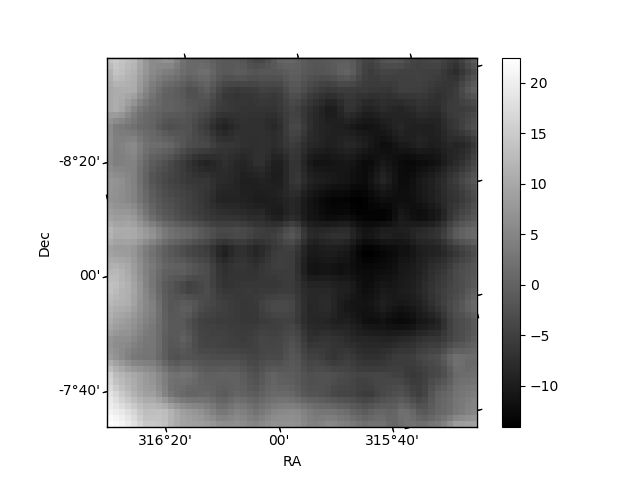
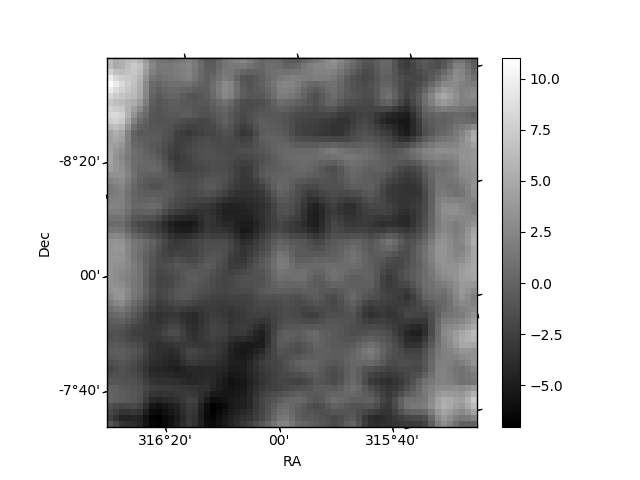
| Quadrant D | 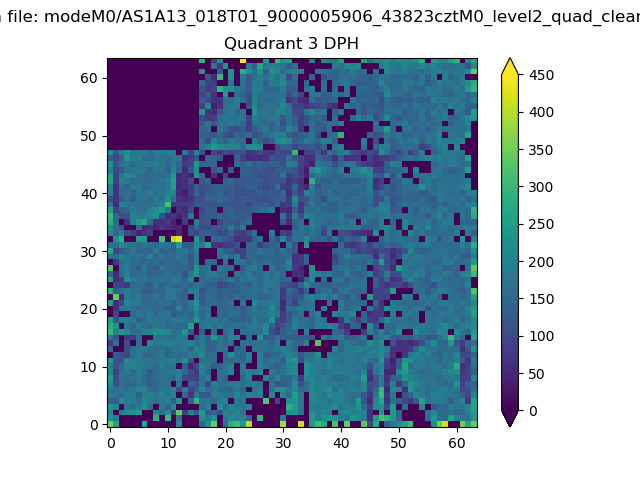 |
 |
Quadrant C |
| Plot type | Count rate plots | Images |
|---|---|---|
| Comparison with Poisson distribution Blue bars denote a histogram of data divided into 1 sec bins. Red curve is a Poisson curve with rate = median count rate of data. |
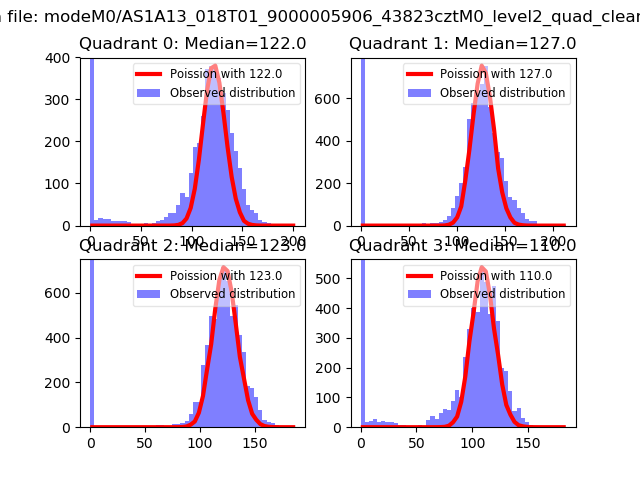 |
 |
| Quadrant-wise count rates Data is divided into 100 sec bins |
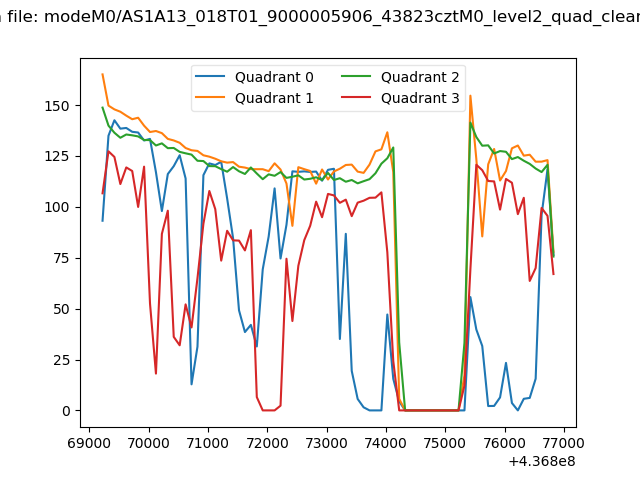 |
|
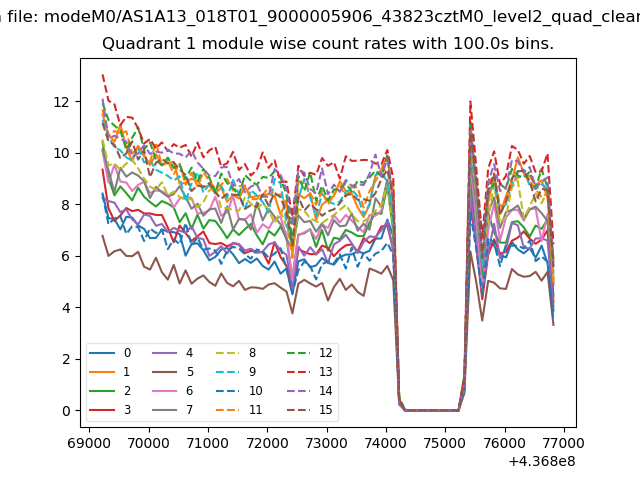
| Module-wise count rates for Quadrant A Data is divided into 100 sec bins |
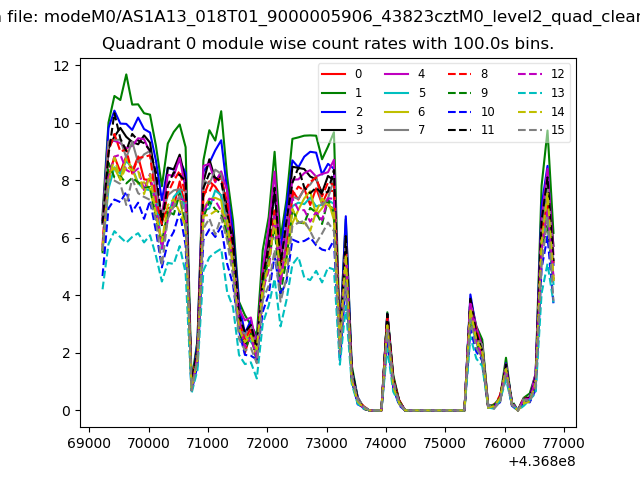 |
 |
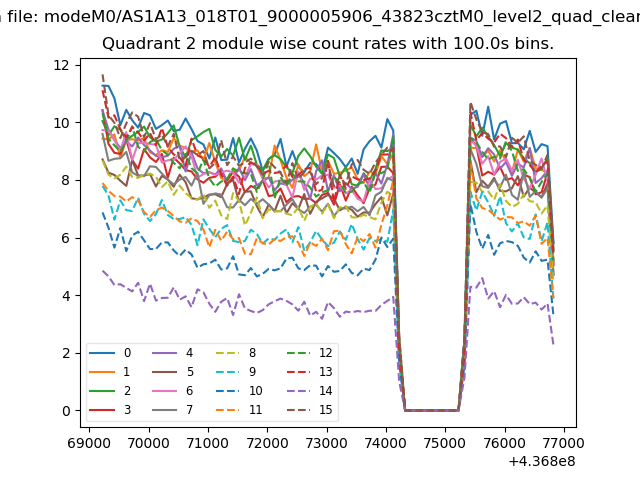
| Module-wise count rates for Quadrant B Data is divided into 100 sec bins |
 |
 |
| Module-wise count rates for Quadrant C Data is divided into 100 sec bins |
 |
 |
| Module-wise count rates for Quadrant D Data is divided into 100 sec bins |
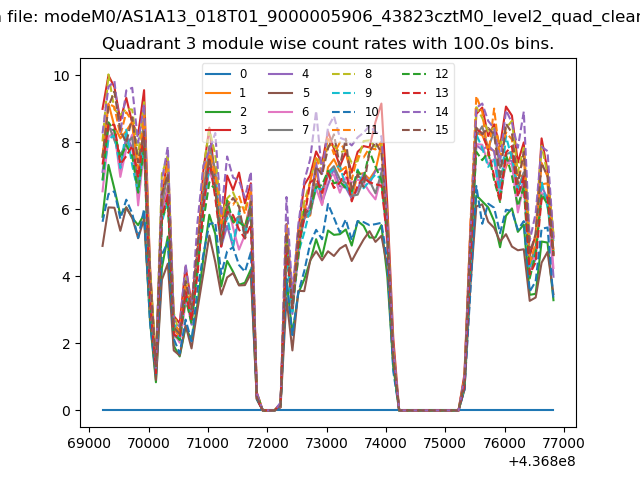 |
 |
| Parameter | Plot |
|---|---|
| CZT HV Monitor | 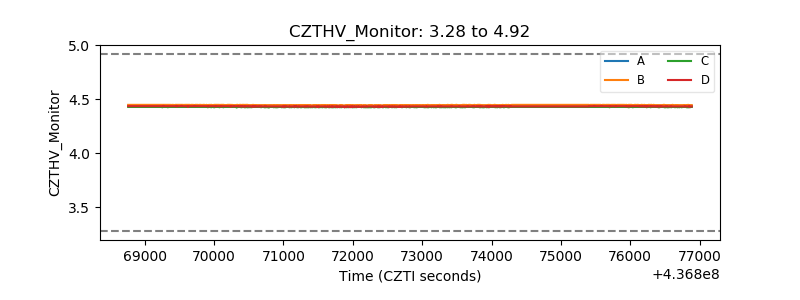 |
| D_VDD | 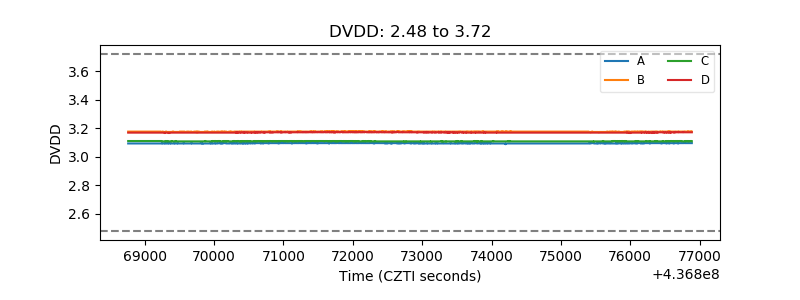 |
| Temperature 1 | 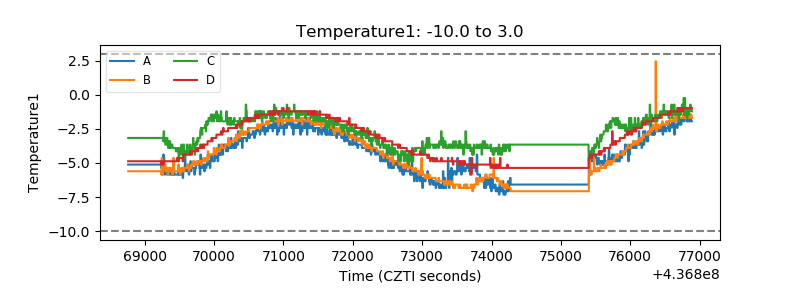 |
| Veto HV Monitor | 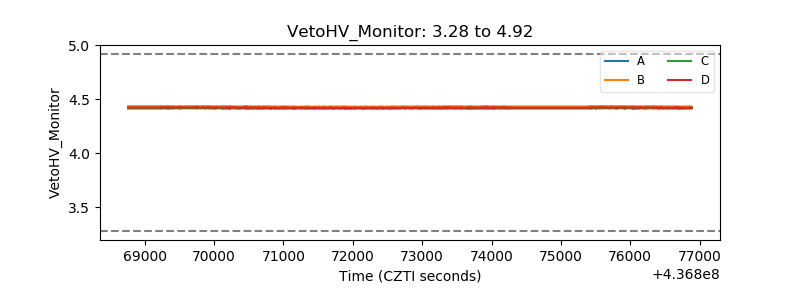 |
| Veto LLD | 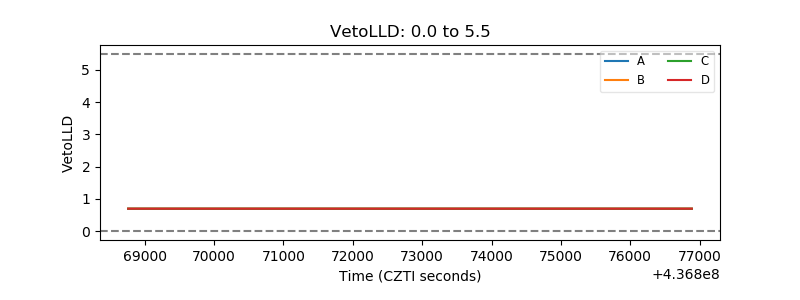 |
| Alpha Counter | 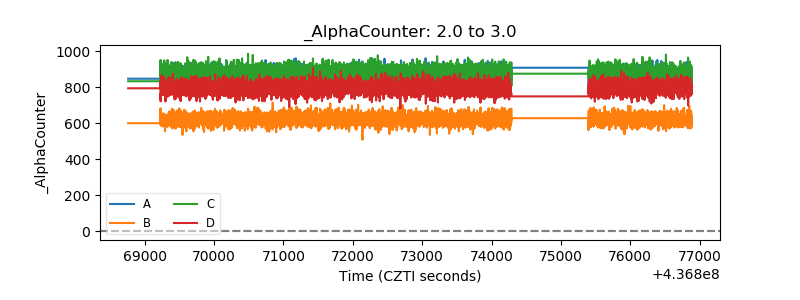 |
| _CPM_Rate | 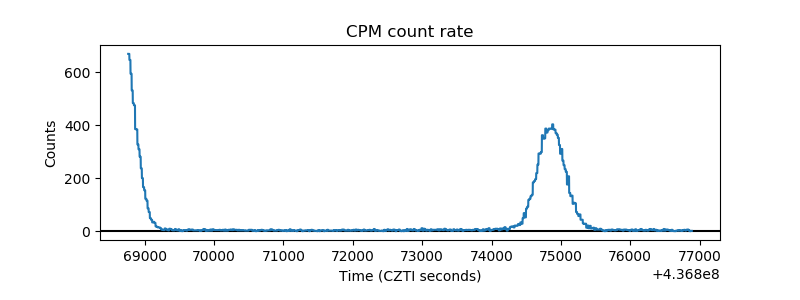 |
| CZT Counter | 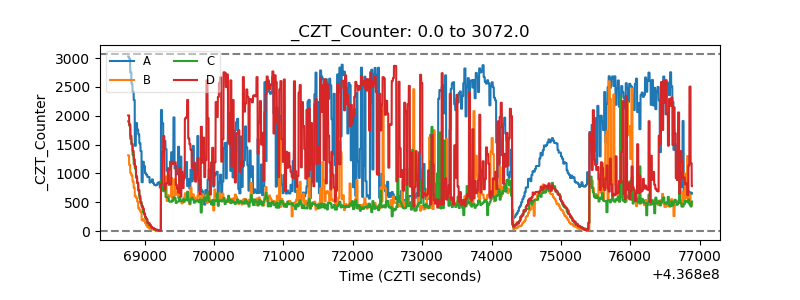 |
| +2.5 Volts monitor | 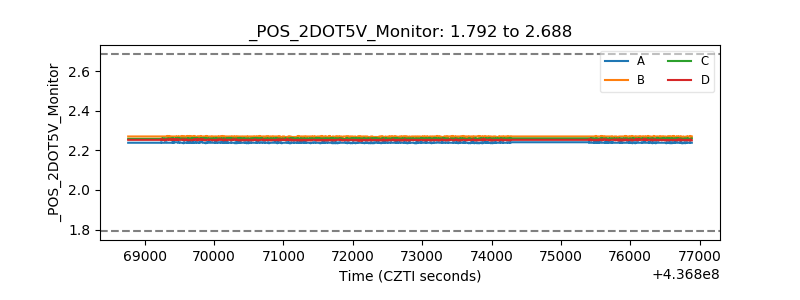 |
| +5 Volts monitor | 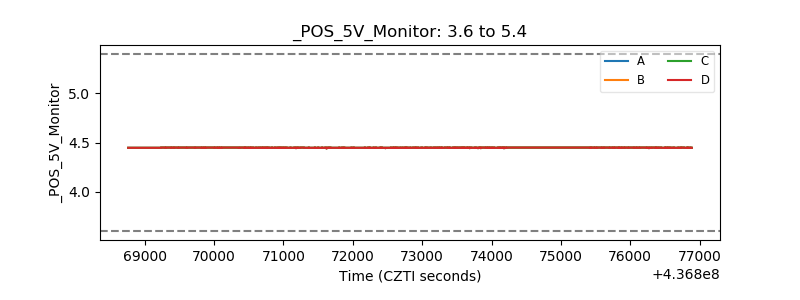 |
| _ROLL_ROT | 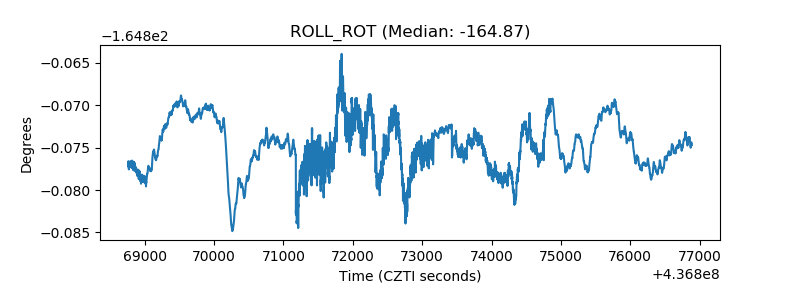 |
| _Roll_DEC | 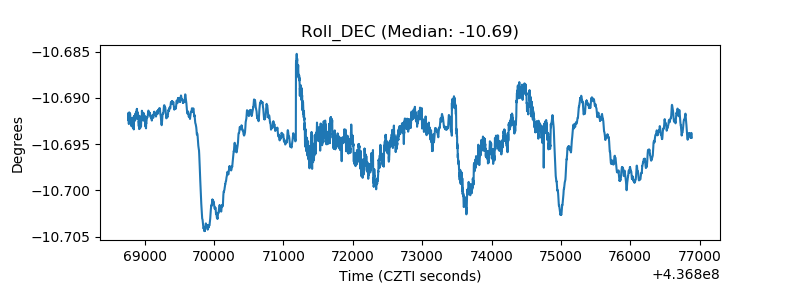 |
| _Roll_RA | 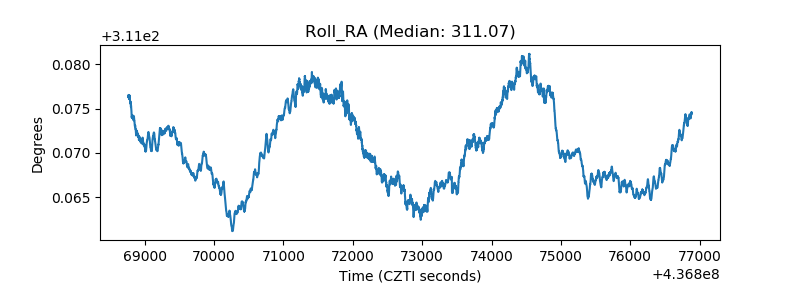 |
| Veto Counter | 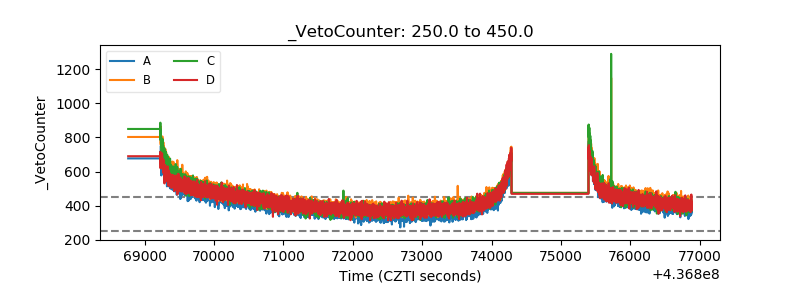 |