| Param | Original file | Final file |
|---|---|---|
| Filename | modeM0/AS1A13_018T01_9000005906_43824cztM0_level2.fits | modeM0/AS1A13_018T01_9000005906_43824cztM0_level2_quad_clean.evt |
| Size (bytes) | 692,645,760 | 106,315,200 |
| Size | 660.6 MB | 101.4 MB |
| Events in quadrant A | 9,919,774 | 533,960 |
| Events in quadrant B | 4,437,216 | 793,522 |
| Events in quadrant C | 3,803,349 | 790,965 |
| Events in quadrant D | 6,954,313 | 628,438 |
| Mode M0 | |||
|---|---|---|---|
| Quadrant | BADHDUFLAG | Total packets | Discarded packets |
| A | 0 | 34280 | 1 |
| B | 0 | 17546 | 1 |
| C | 0 | 15561 | 1 |
| D | 0 | 25306 | 1 |
| Mode SS | |||
|---|---|---|---|
| Quadrant | BADHDUFLAG | Total packets | Discarded packets |
| A | 0 | 138 | 0 |
| B | 0 | 138 | 0 |
| C | 0 | 138 | 0 |
| D | 0 | 138 | 0 |
| Mode M9 | |||
|---|---|---|---|
| Quadrant | BADHDUFLAG | Total packets | Discarded packets |
| A | 0 | 8 | 0 |
| B | 0 | 8 | 0 |
| C | 0 | 8 | 0 |
| D | 0 | 8 | 0 |
| Quadrant | Total seconds | Saturated seconds | Saturation percentage |
|---|---|---|---|
| A | 6771 | 2487 | 36.730173% |
| B | 6772 | 350 | 5.168340% |
| C | 6772 | 88 | 1.299468% |
| D | 6772 | 1063 | 15.696988% |
Noise dominated data is calculated using 1-second bins in cleaned event files. If a bin has >2000 counts, and if more than 50% of those come from <1% of pixels, then it is considered to be noise-dominated and hence unusable.
| Quadrant | # 1 sec bins | Bins with >0 counts | Bins with >2000 counts | High rate bins dominated by noise | Noise dominated (total time) | Noise dominated (detector-on time) | Marked lightcurve |
|---|---|---|---|---|---|---|---|
| A | 7586 | 6771 | 1969 | 1969 | 25.96% | 29.08% | 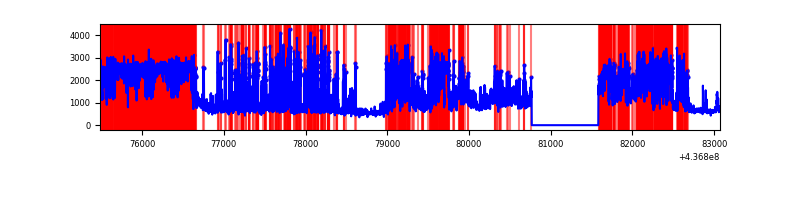 |
| B | 7587 | 6773 | 154 | 154 | 2.03% | 2.27% | 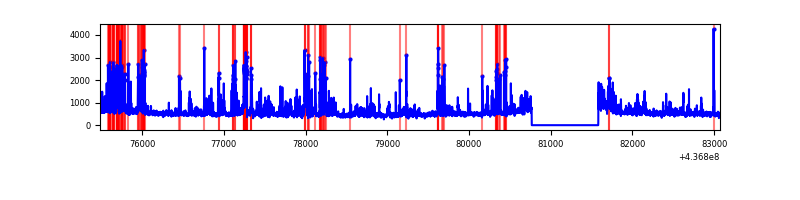 |
| C | 7587 | 6773 | 33 | 33 | 0.43% | 0.49% | 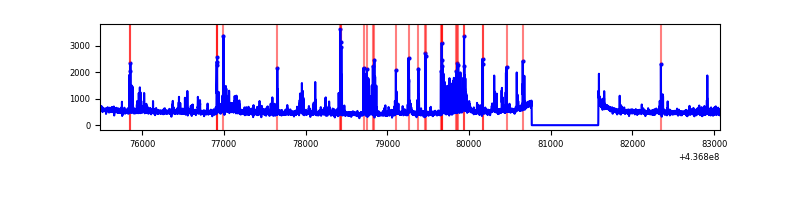 |
| D | 7587 | 6772 | 914 | 914 | 12.05% | 13.50% | 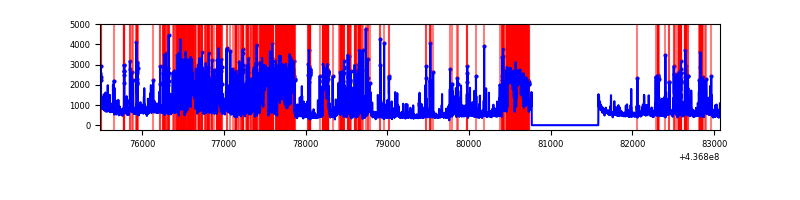 |
Top three noisy pixels from each quadrant. If the there are fewer than three noisy pixels in the level2.evt file, extra rows are filled as -1
| Pixel properties | Quadrant properties | ||||||
|---|---|---|---|---|---|---|---|
| Quadrant | DetID | PixID | Counts | Sigma | Mean | Median | Sigma |
| A | 15 | 223 | 5239205 | 36961.22 | 684 | 670 | 141.7 |
| A | 14 | 254 | 954056 | 6726.75 | 684 | 670 | 141.7 |
| A | 10 | 83 | 881603 | 6215.55 | 684 | 670 | 141.7 |
| B | 5 | 235 | 655362 | 4138.73 | 804 | 780 | 158.2 |
| B | 5 | 172 | 382353 | 2412.57 | 804 | 780 | 158.2 |
| B | 7 | 205 | 85477 | 535.51 | 804 | 780 | 158.2 |
| C | 3 | 233 | 336392 | 1784.54 | 798 | 805 | 188.1 |
| C | 15 | 158 | 175966 | 931.45 | 798 | 805 | 188.1 |
| C | 15 | 157 | 82980 | 436.98 | 798 | 805 | 188.1 |
| D | 12 | 2 | 963717 | 5044.59 | 754 | 732 | 190.9 |
| D | 5 | 235 | 918780 | 4809.19 | 754 | 732 | 190.9 |
| D | 2 | 249 | 572942 | 2997.52 | 754 | 732 | 190.9 |
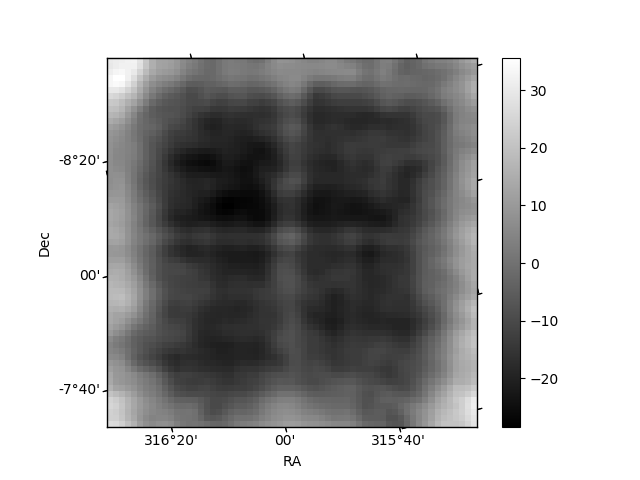
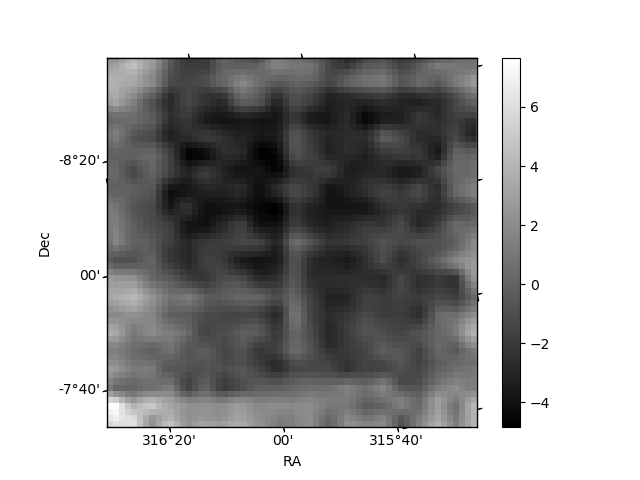
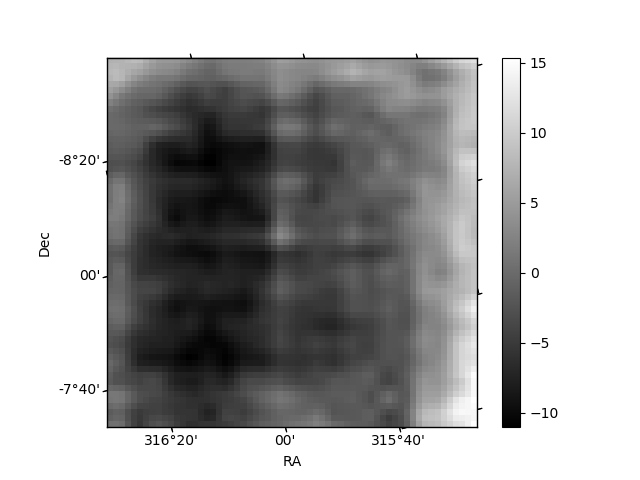
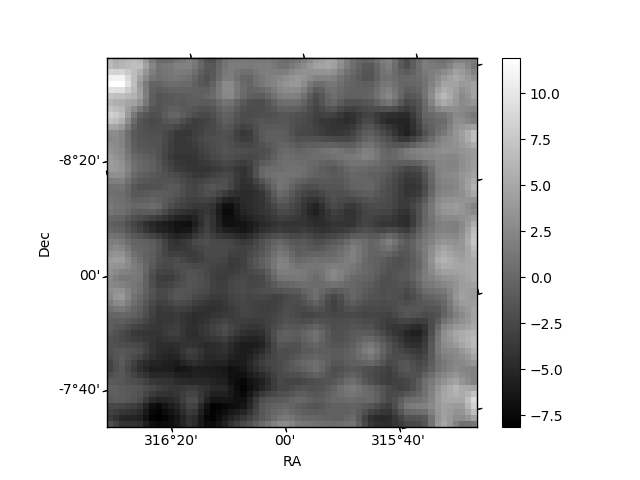
Histogram calculated using DETX and DETY for each event in the final _common_clean file
| Quadrant A | 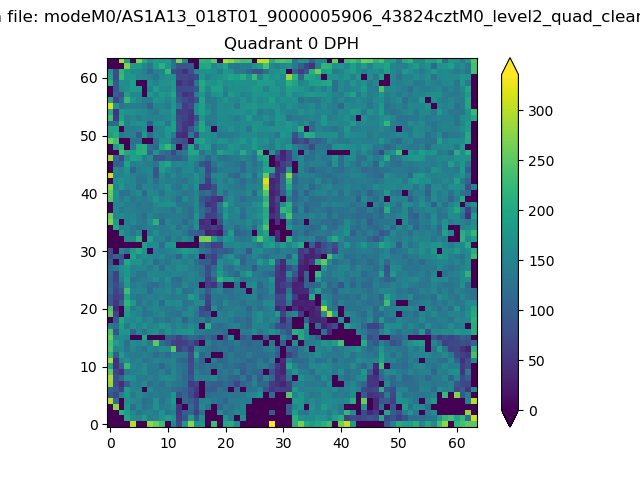 |
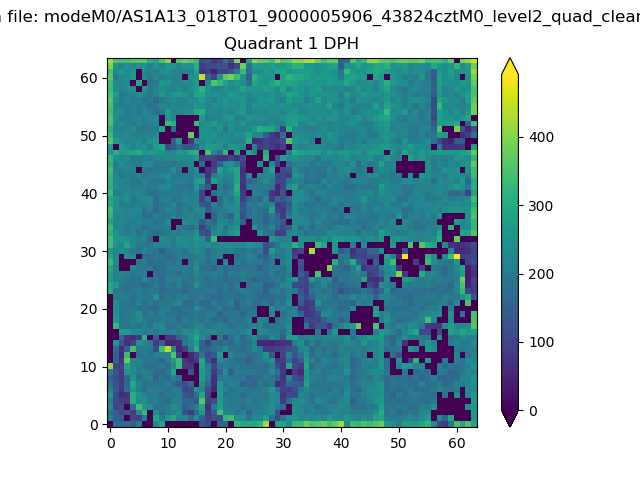 |
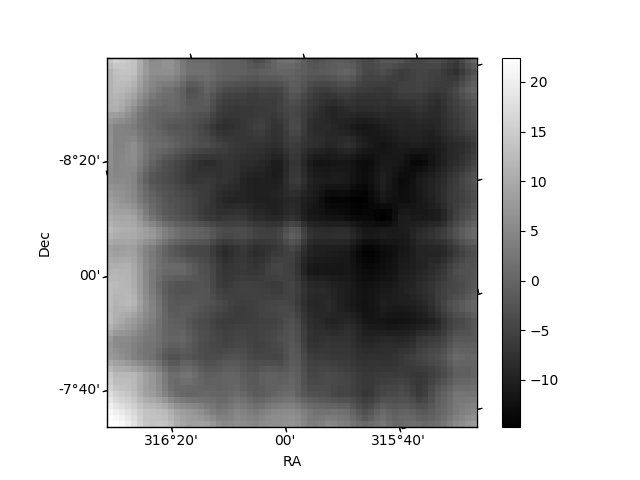
Quadrant B |
|---|---|---|---|
| Quadrant D | 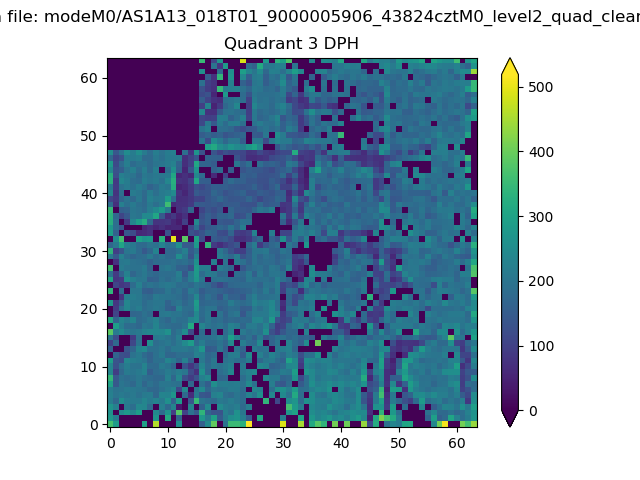 |
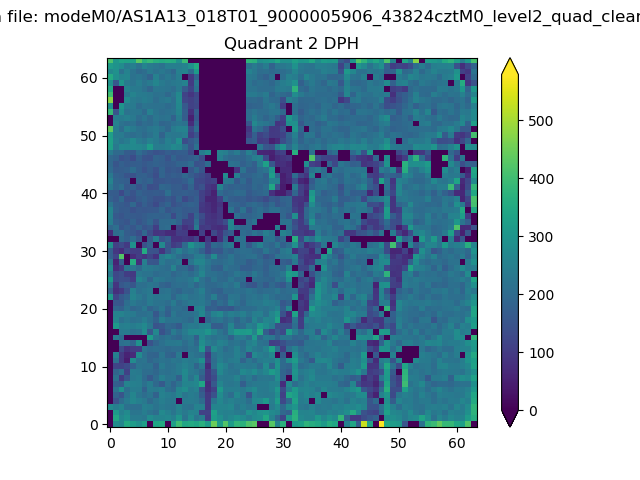 |
Quadrant C |
| Plot type | Count rate plots | Images |
|---|---|---|
| Comparison with Poisson distribution Blue bars denote a histogram of data divided into 1 sec bins. Red curve is a Poisson curve with rate = median count rate of data. |
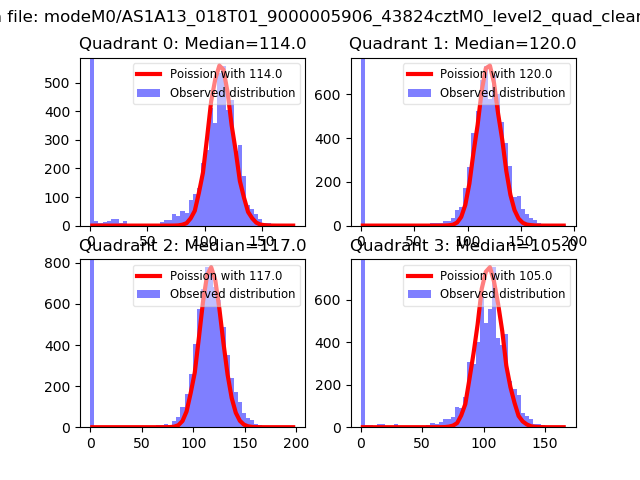 |
 |
| Quadrant-wise count rates Data is divided into 100 sec bins |
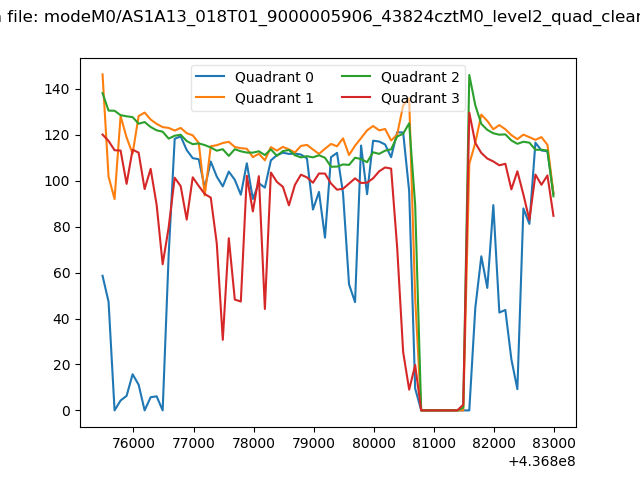 |
|
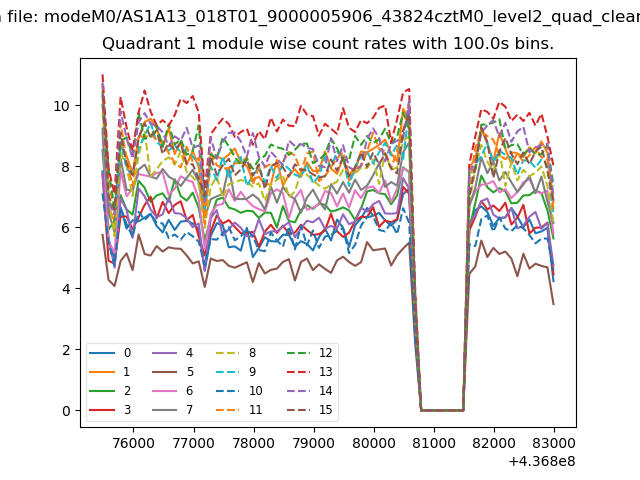
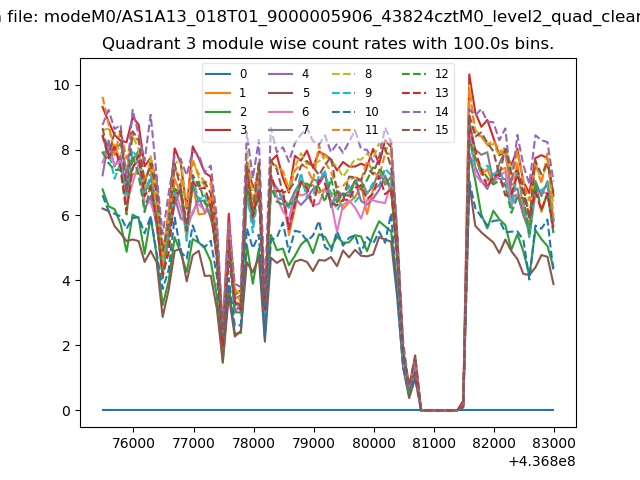
| Module-wise count rates for Quadrant A Data is divided into 100 sec bins |
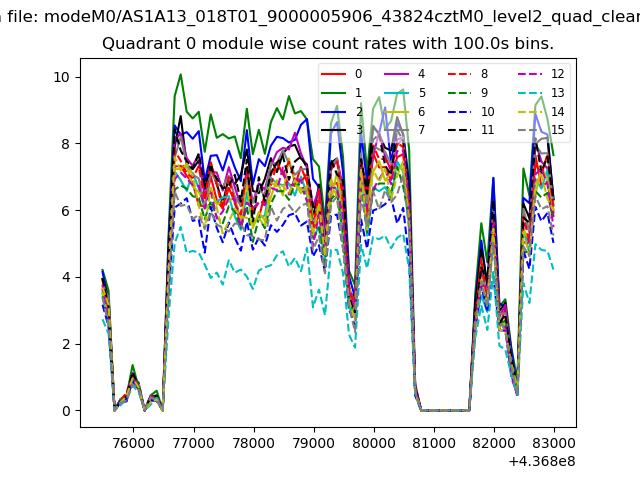 |
 |
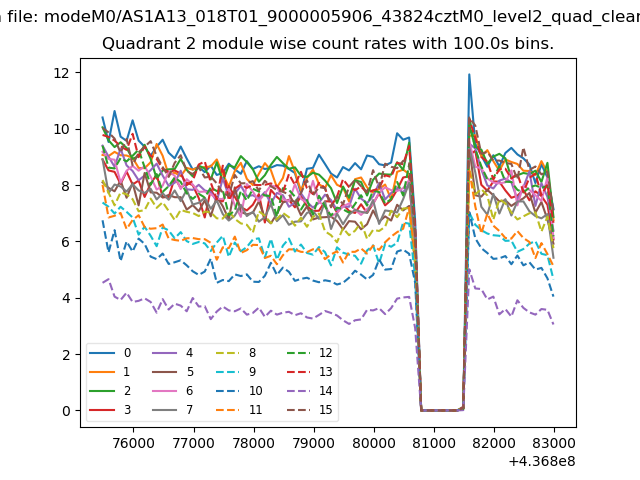
| Module-wise count rates for Quadrant B Data is divided into 100 sec bins |
 |
 |
| Module-wise count rates for Quadrant C Data is divided into 100 sec bins |
 |
 |
| Module-wise count rates for Quadrant D Data is divided into 100 sec bins |
 |
 |
| Parameter | Plot |
|---|---|
| CZT HV Monitor | 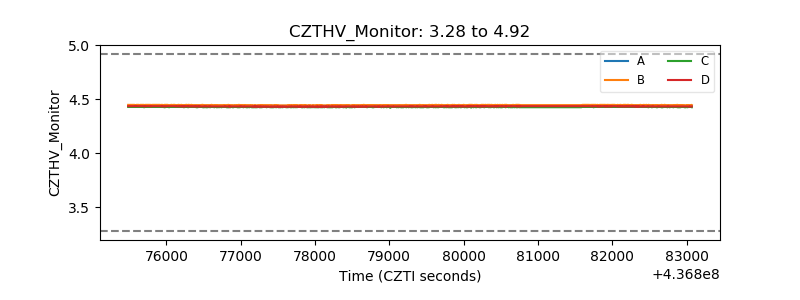 |
| D_VDD | 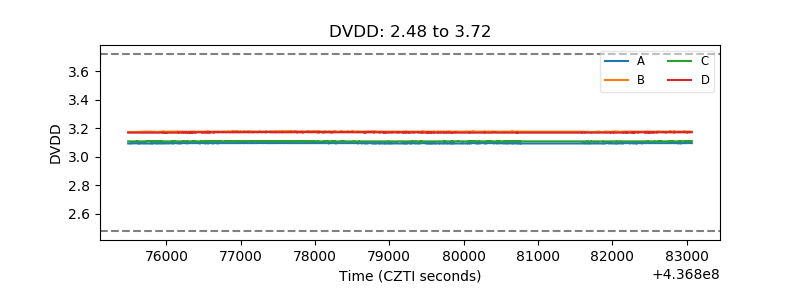 |
| Temperature 1 | 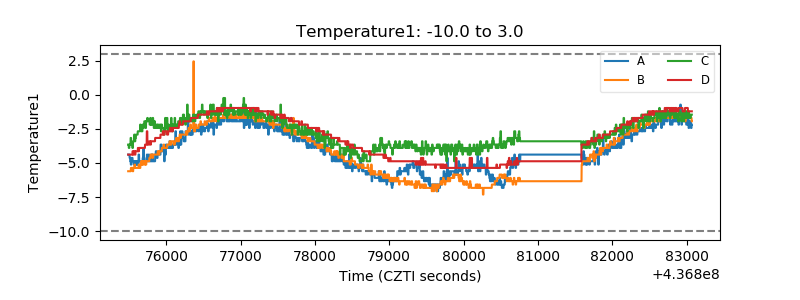 |
| Veto HV Monitor | 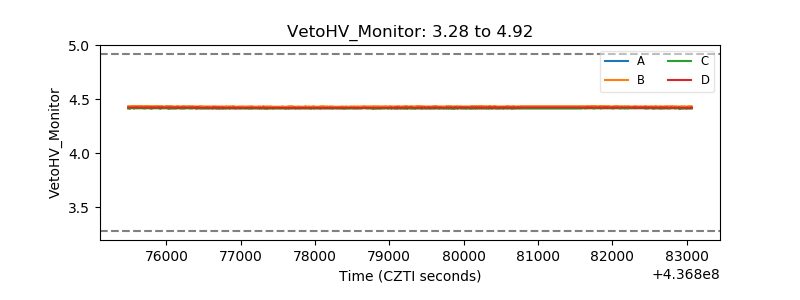 |
| Veto LLD | 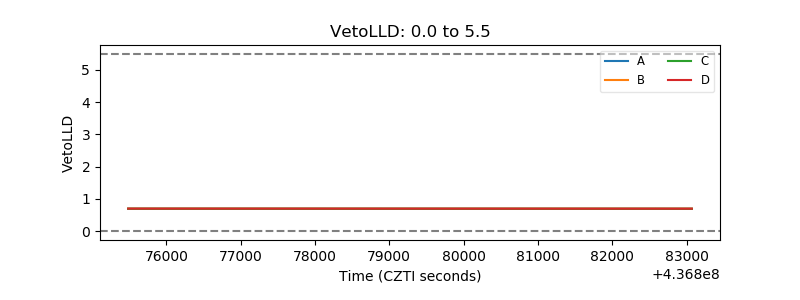 |
| Alpha Counter | 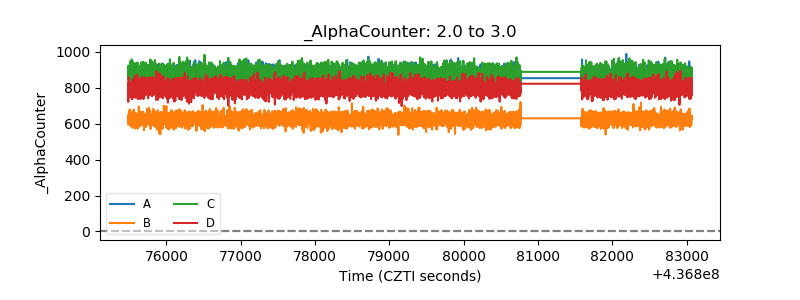 |
| _CPM_Rate | 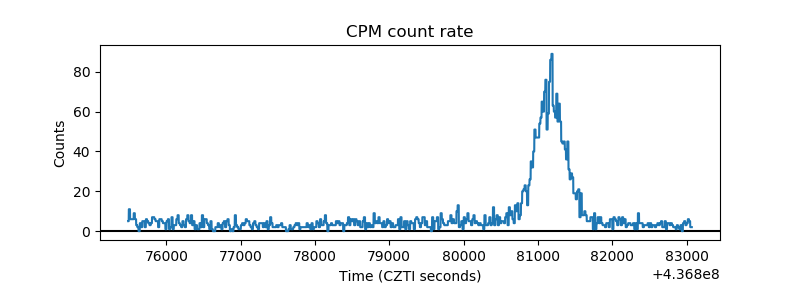 |
| CZT Counter | 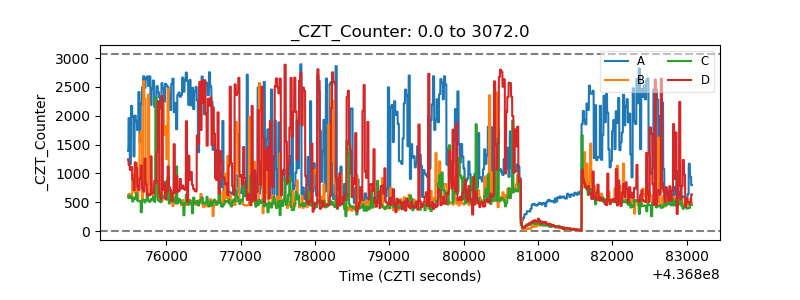 |
| +2.5 Volts monitor | 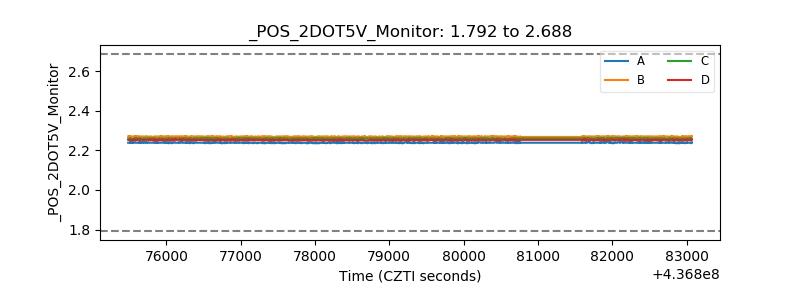 |
| +5 Volts monitor | 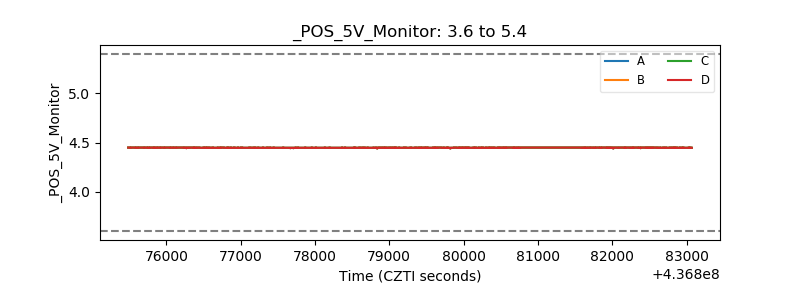 |
| _ROLL_ROT | 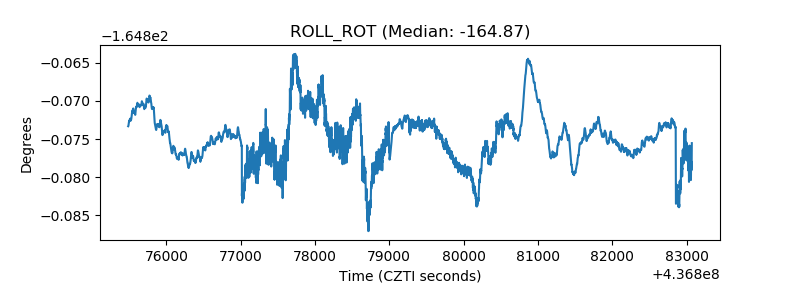 |
| _Roll_DEC | 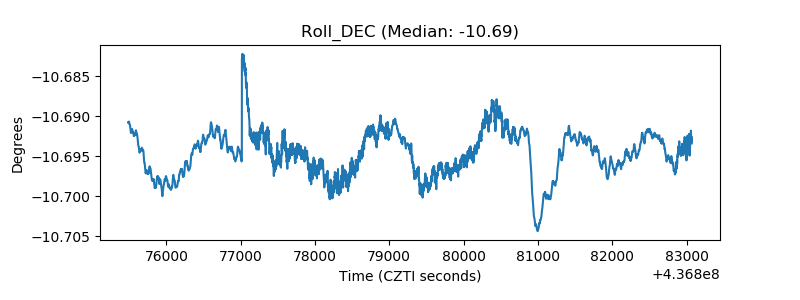 |
| _Roll_RA | 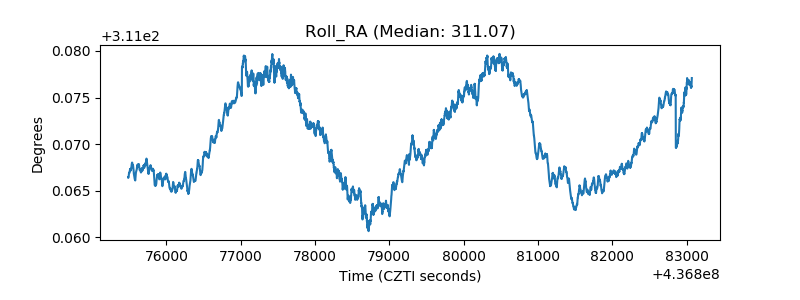 |
| Veto Counter | 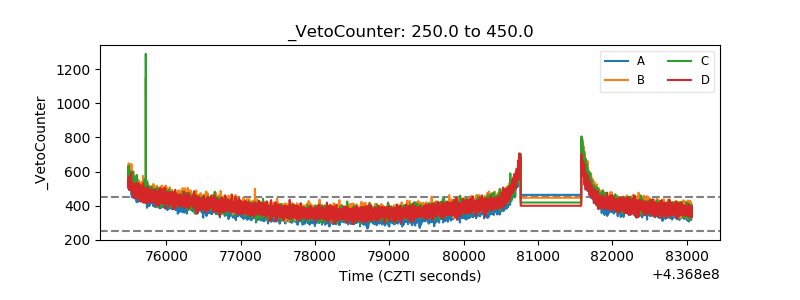 |