| Param | Original file | Final file |
|---|---|---|
| Filename | modeM0/AS1A13_018T01_9000005906_43825cztM0_level2.fits | modeM0/AS1A13_018T01_9000005906_43825cztM0_level2_quad_clean.evt |
| Size (bytes) | 661,043,520 | 111,631,680 |
| Size | 630.4 MB | 106.5 MB |
| Events in quadrant A | 7,644,976 | 688,647 |
| Events in quadrant B | 4,929,035 | 769,833 |
| Events in quadrant C | 3,898,193 | 791,294 |
| Events in quadrant D | 7,441,744 | 630,809 |
| Mode M0 | |||
|---|---|---|---|
| Quadrant | BADHDUFLAG | Total packets | Discarded packets |
| A | 0 | 27928 | 2 |
| B | 0 | 19374 | 2 |
| C | 0 | 16332 | 2 |
| D | 0 | 27031 | 2 |
| Mode SS | |||
|---|---|---|---|
| Quadrant | BADHDUFLAG | Total packets | Discarded packets |
| A | 0 | 146 | 0 |
| B | 0 | 146 | 0 |
| C | 0 | 146 | 0 |
| D | 0 | 146 | 0 |
| Mode M9 | |||
|---|---|---|---|
| Quadrant | BADHDUFLAG | Total packets | Discarded packets |
| A | 0 | 2 | 0 |
| B | 0 | 2 | 0 |
| C | 0 | 2 | 0 |
| D | 0 | 2 | 0 |
| Quadrant | Total seconds | Saturated seconds | Saturation percentage |
|---|---|---|---|
| A | 7169 | 1293 | 18.035988% |
| B | 7170 | 601 | 8.382148% |
| C | 7170 | 195 | 2.719665% |
| D | 7170 | 1191 | 16.610879% |
Noise dominated data is calculated using 1-second bins in cleaned event files. If a bin has >2000 counts, and if more than 50% of those come from <1% of pixels, then it is considered to be noise-dominated and hence unusable.
| Quadrant | # 1 sec bins | Bins with >0 counts | Bins with >2000 counts | High rate bins dominated by noise | Noise dominated (total time) | Noise dominated (detector-on time) | Marked lightcurve |
|---|---|---|---|---|---|---|---|
| A | 7394 | 7171 | 813 | 813 | 11.00% | 11.34% | 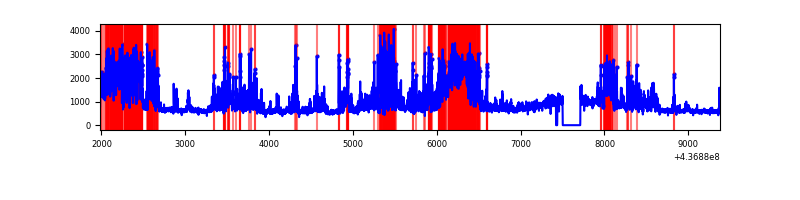 |
| B | 7395 | 7172 | 249 | 249 | 3.37% | 3.47% | 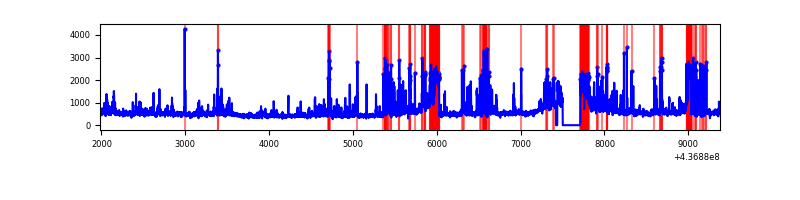 |
| C | 7395 | 7171 | 39 | 39 | 0.53% | 0.54% | 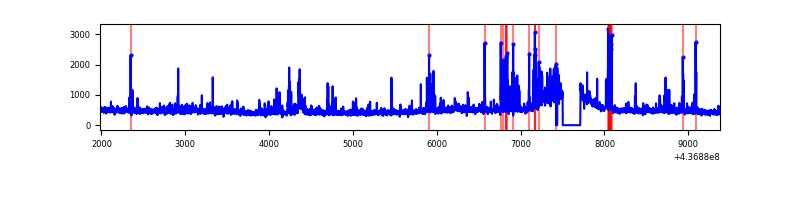 |
| D | 7395 | 7172 | 960 | 960 | 12.98% | 13.39% | 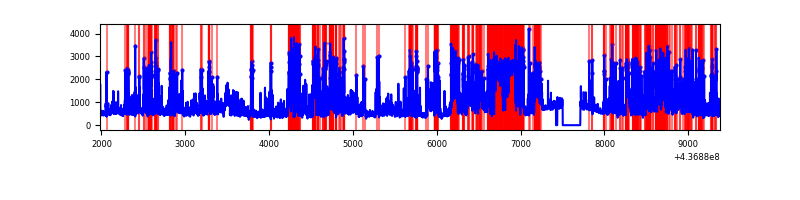 |
Top three noisy pixels from each quadrant. If the there are fewer than three noisy pixels in the level2.evt file, extra rows are filled as -1
| Pixel properties | Quadrant properties | ||||||
|---|---|---|---|---|---|---|---|
| Quadrant | DetID | PixID | Counts | Sigma | Mean | Median | Sigma |
| A | 15 | 223 | 3106371 | 18262.08 | 815 | 797 | 170.1 |
| A | 10 | 83 | 931454 | 5472.65 | 815 | 797 | 170.1 |
| A | 10 | 248 | 196151 | 1148.76 | 815 | 797 | 170.1 |
| B | 5 | 235 | 965842 | 5871.37 | 823 | 798 | 164.4 |
| B | 5 | 172 | 395449 | 2401.07 | 823 | 798 | 164.4 |
| B | 7 | 205 | 127223 | 769.18 | 823 | 798 | 164.4 |
| C | 3 | 233 | 242362 | 1225.45 | 836 | 843 | 197.1 |
| C | 15 | 158 | 127671 | 643.52 | 836 | 843 | 197.1 |
| C | 1 | 241 | 113870 | 573.49 | 836 | 843 | 197.1 |
| D | 5 | 235 | 2048932 | 9985.65 | 794 | 768 | 205.1 |
| D | 7 | 204 | 492361 | 2396.72 | 794 | 768 | 205.1 |
| D | 13 | 171 | 281453 | 1368.46 | 794 | 768 | 205.1 |
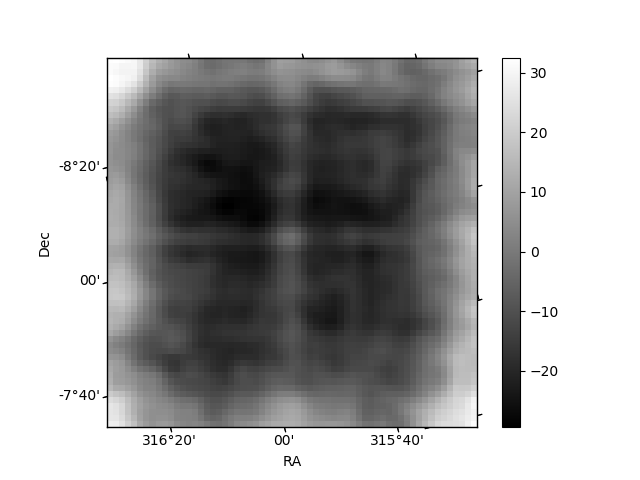
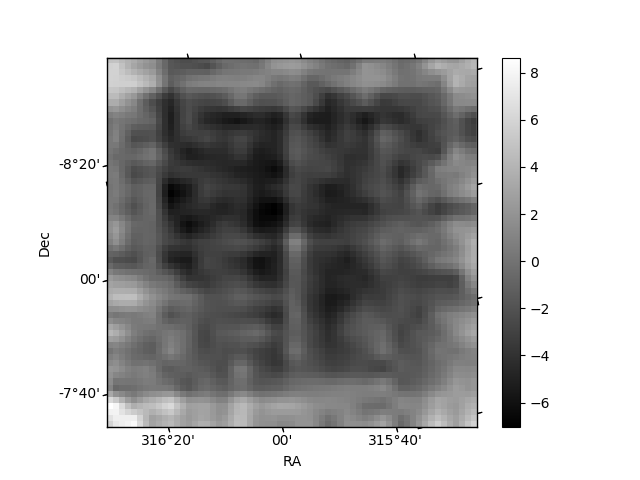
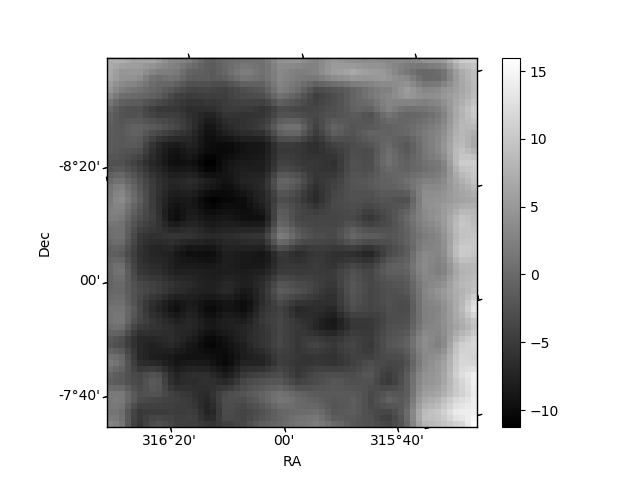
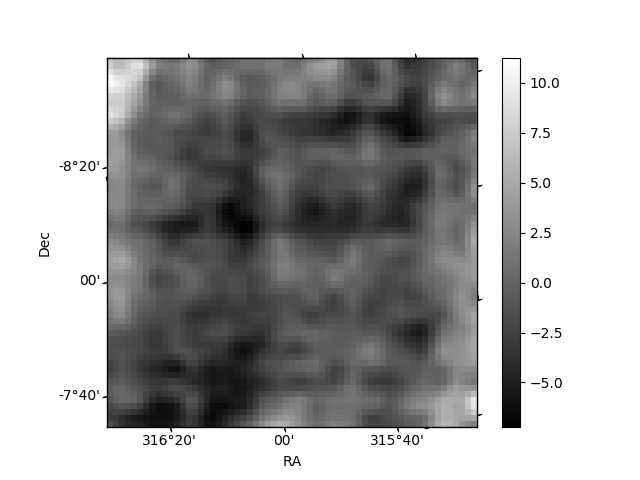
Histogram calculated using DETX and DETY for each event in the final _common_clean file
| Quadrant A | 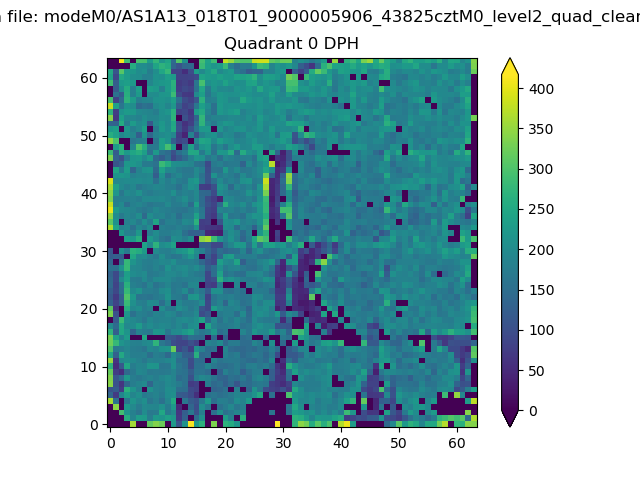 |
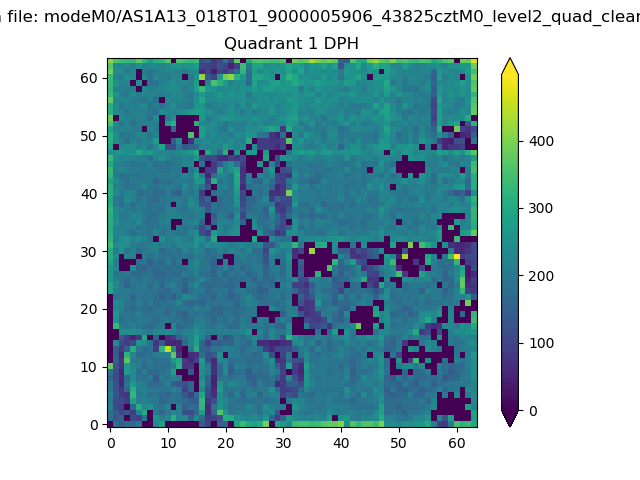 |
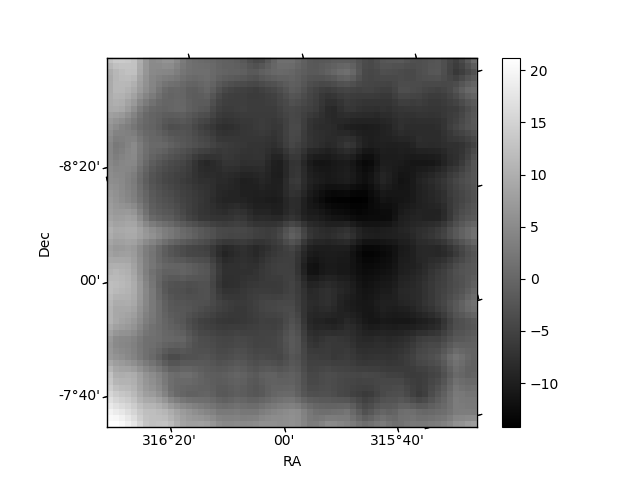
Quadrant B |
|---|---|---|---|
| Quadrant D | 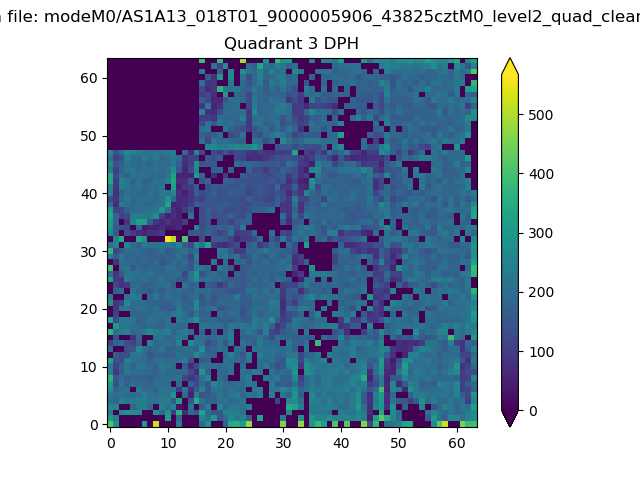 |
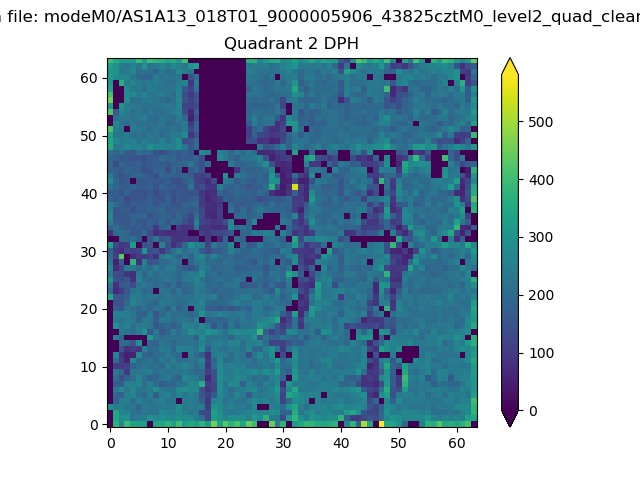 |
Quadrant C |
| Plot type | Count rate plots | Images |
|---|---|---|
| Comparison with Poisson distribution Blue bars denote a histogram of data divided into 1 sec bins. Red curve is a Poisson curve with rate = median count rate of data. |
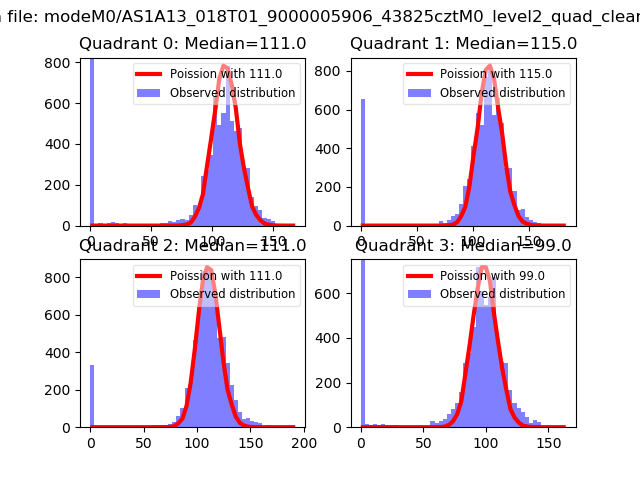 |
 |
| Quadrant-wise count rates Data is divided into 100 sec bins |
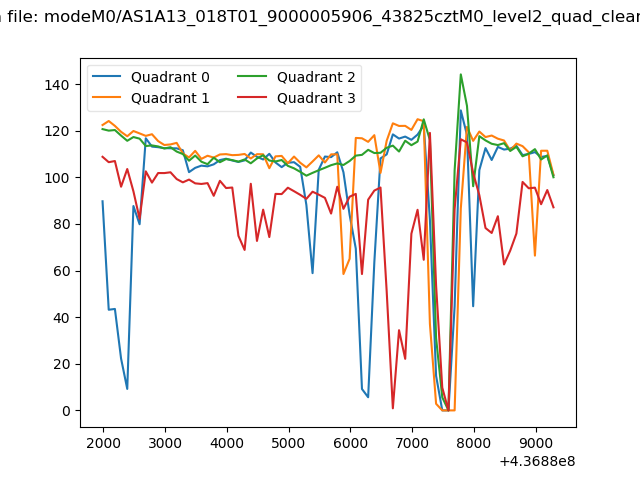 |
|
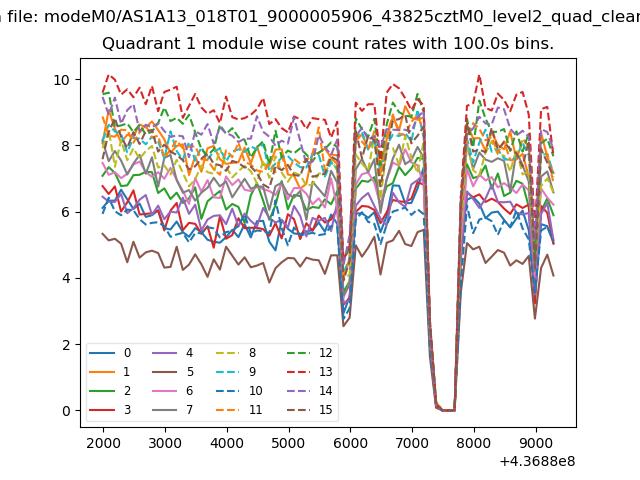
| Module-wise count rates for Quadrant A Data is divided into 100 sec bins |
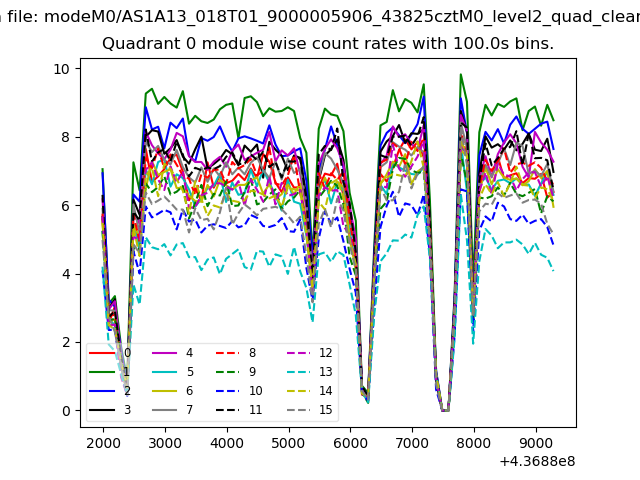 |
 |
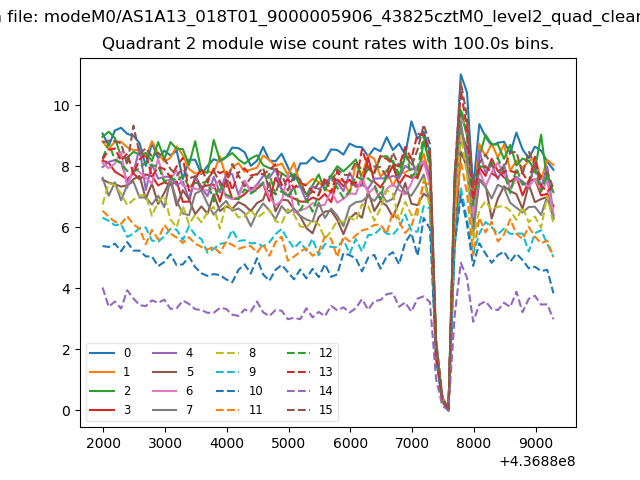
| Module-wise count rates for Quadrant B Data is divided into 100 sec bins |
 |
 |
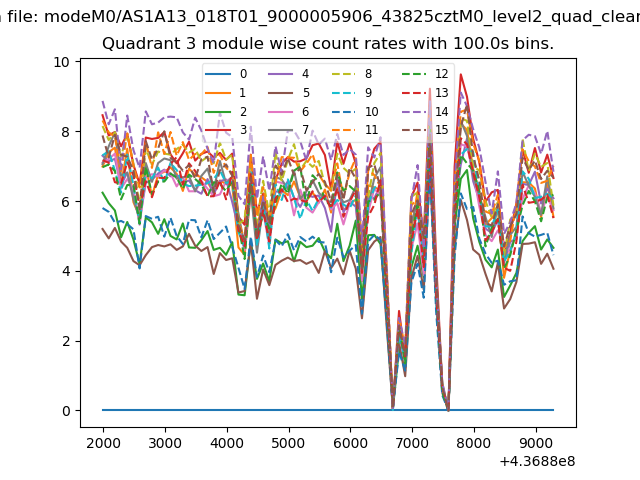
| Module-wise count rates for Quadrant C Data is divided into 100 sec bins |
 |
 |
| Module-wise count rates for Quadrant D Data is divided into 100 sec bins |
 |
 |
| Parameter | Plot |
|---|---|
| CZT HV Monitor | 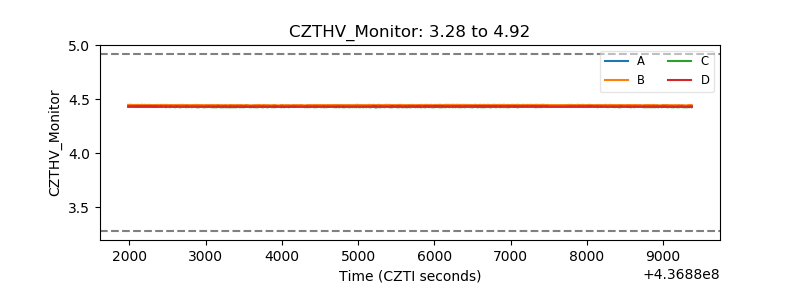 |
| D_VDD | 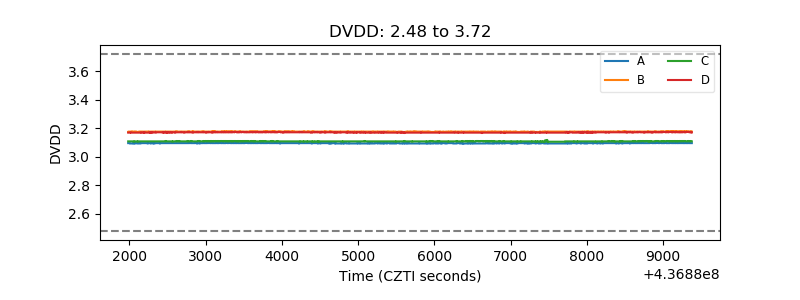 |
| Temperature 1 | 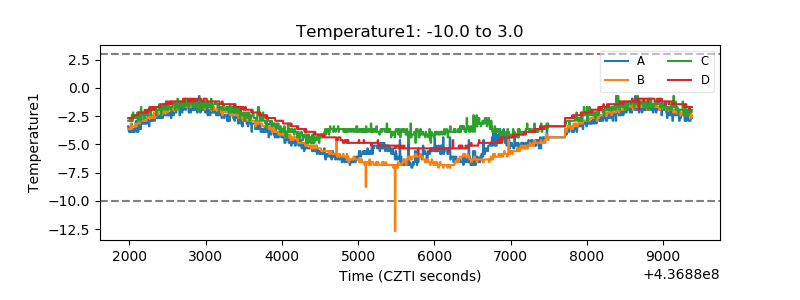 |
| Veto HV Monitor | 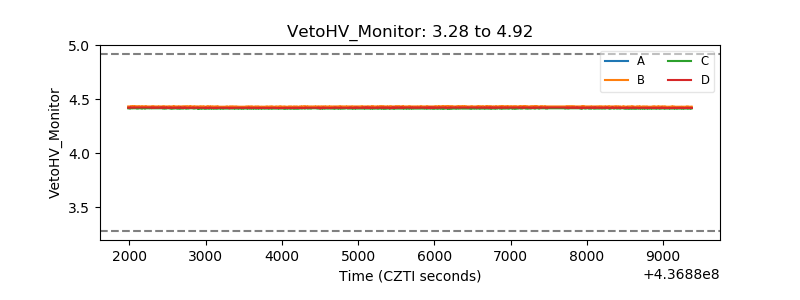 |
| Veto LLD |  |
| Alpha Counter | 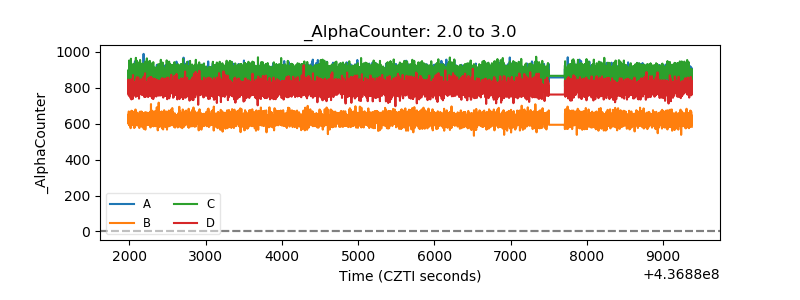 |
| _CPM_Rate | 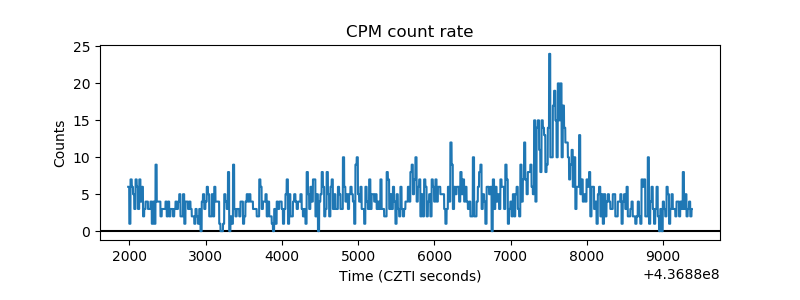 |
| CZT Counter | 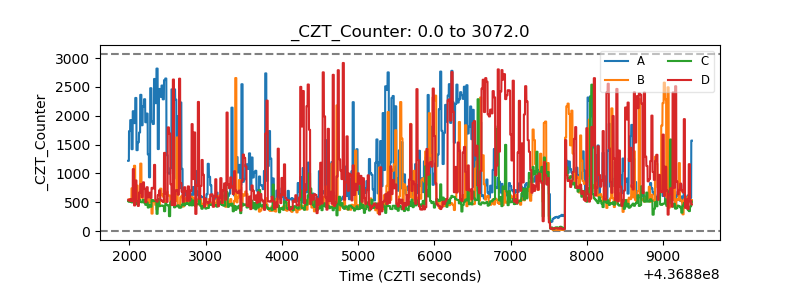 |
| +2.5 Volts monitor | 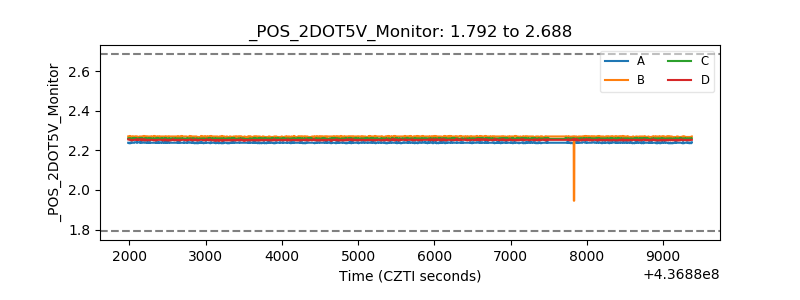 |
| +5 Volts monitor | 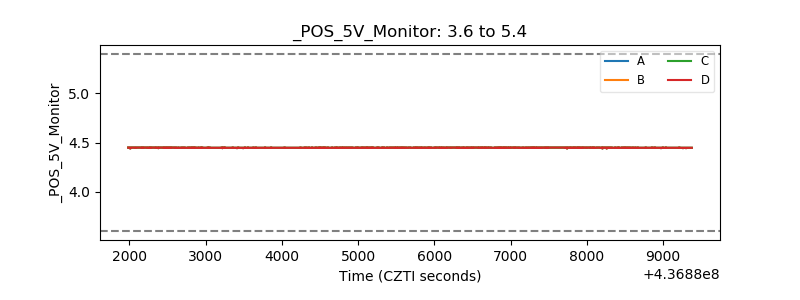 |
| _ROLL_ROT | 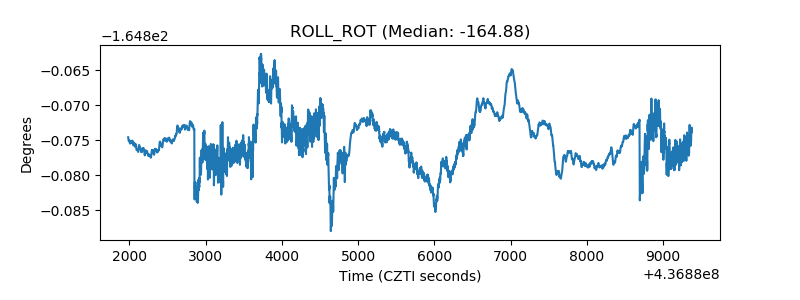 |
| _Roll_DEC | 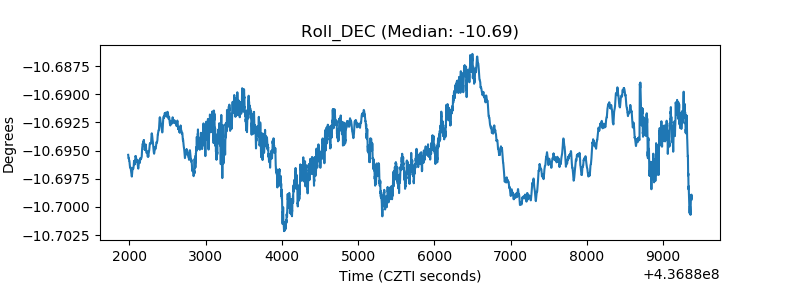 |
| _Roll_RA | 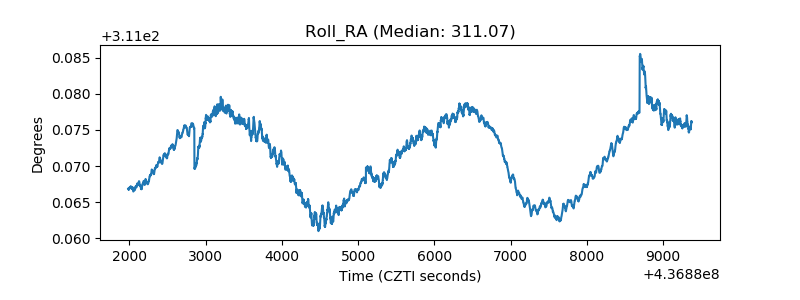 |
| Veto Counter | 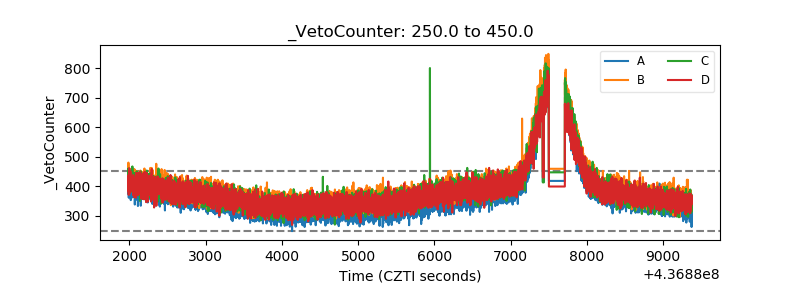 |