| Param | Original file | Final file |
|---|---|---|
| Filename | modeM0/AS1A13_018T01_9000005906_43826cztM0_level2.fits | modeM0/AS1A13_018T01_9000005906_43826cztM0_level2_quad_clean.evt |
| Size (bytes) | 599,990,400 | 123,952,320 |
| Size | 572.2 MB | 118.2 MB |
| Events in quadrant A | 5,047,090 | 844,673 |
| Events in quadrant B | 5,081,792 | 840,288 |
| Events in quadrant C | 4,370,574 | 831,429 |
| Events in quadrant D | 7,119,805 | 706,367 |
| Mode M0 | |||
|---|---|---|---|
| Quadrant | BADHDUFLAG | Total packets | Discarded packets |
| A | 0 | 20353 | 0 |
| B | 0 | 20185 | 0 |
| C | 0 | 18085 | 0 |
| D | 0 | 26444 | 1 |
| Mode SS | |||
|---|---|---|---|
| Quadrant | BADHDUFLAG | Total packets | Discarded packets |
| A | 0 | 154 | 0 |
| B | 0 | 154 | 0 |
| C | 0 | 154 | 0 |
| D | 0 | 154 | 0 |
| Quadrant | Total seconds | Saturated seconds | Saturation percentage |
|---|---|---|---|
| A | 7618 | 70 | 0.918876% |
| B | 7619 | 330 | 4.331277% |
| C | 7619 | 103 | 1.351883% |
| D | 7618 | 774 | 10.160147% |
Noise dominated data is calculated using 1-second bins in cleaned event files. If a bin has >2000 counts, and if more than 50% of those come from <1% of pixels, then it is considered to be noise-dominated and hence unusable.
| Quadrant | # 1 sec bins | Bins with >0 counts | Bins with >2000 counts | High rate bins dominated by noise | Noise dominated (total time) | Noise dominated (detector-on time) | Marked lightcurve |
|---|---|---|---|---|---|---|---|
| A | 7618 | 7618 | 29 | 29 | 0.38% | 0.38% | 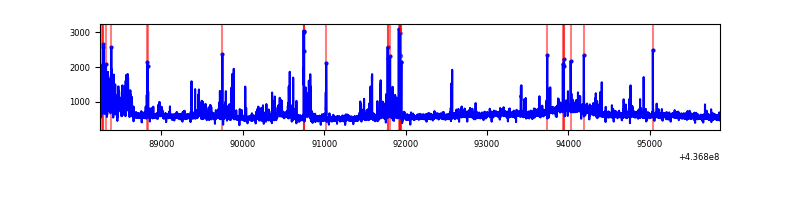 |
| B | 7619 | 7619 | 256 | 256 | 3.36% | 3.36% | 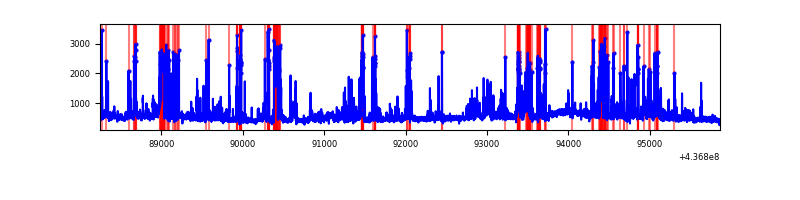 |
| C | 7619 | 7619 | 81 | 81 | 1.06% | 1.06% | 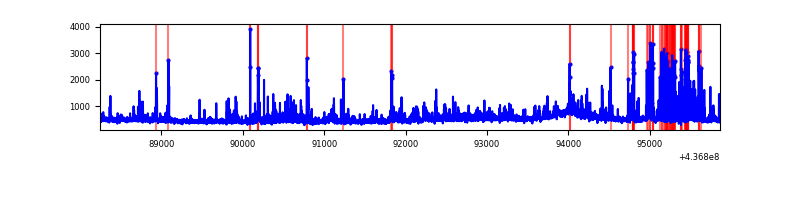 |
| D | 7618 | 7618 | 668 | 668 | 8.77% | 8.77% | 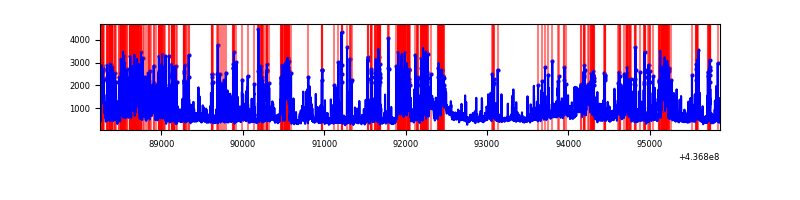 |
Top three noisy pixels from each quadrant. If the there are fewer than three noisy pixels in the level2.evt file, extra rows are filled as -1
| Pixel properties | Quadrant properties | ||||||
|---|---|---|---|---|---|---|---|
| Quadrant | DetID | PixID | Counts | Sigma | Mean | Median | Sigma |
| A | 10 | 83 | 1054608 | 5760.24 | 875 | 857 | 182.9 |
| A | 15 | 223 | 415527 | 2266.76 | 875 | 857 | 182.9 |
| A | 13 | 248 | 101451 | 549.89 | 875 | 857 | 182.9 |
| B | 5 | 235 | 884739 | 5214.61 | 860 | 835 | 169.5 |
| B | 5 | 172 | 291225 | 1713.16 | 860 | 835 | 169.5 |
| B | 7 | 205 | 141845 | 831.89 | 860 | 835 | 169.5 |
| C | 3 | 233 | 346069 | 1730.0 | 848 | 854 | 199.5 |
| C | 15 | 173 | 257910 | 1288.2 | 848 | 854 | 199.5 |
| C | 15 | 158 | 161778 | 806.45 | 848 | 854 | 199.5 |
| D | 5 | 235 | 1277802 | 6013.73 | 828 | 801 | 212.3 |
| D | 7 | 204 | 377173 | 1772.43 | 828 | 801 | 212.3 |
| D | 12 | 2 | 303573 | 1425.83 | 828 | 801 | 212.3 |
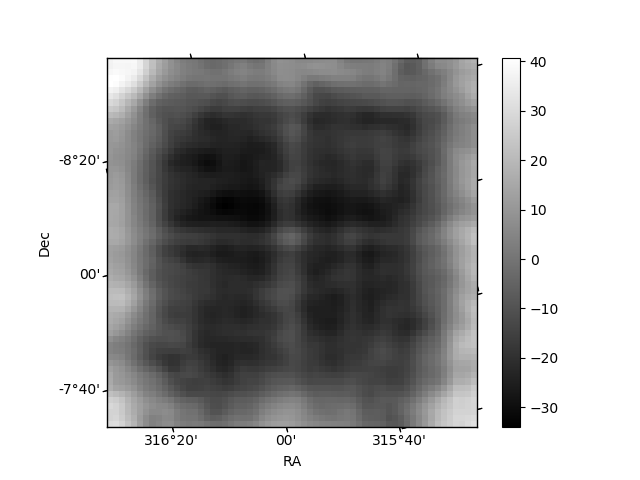
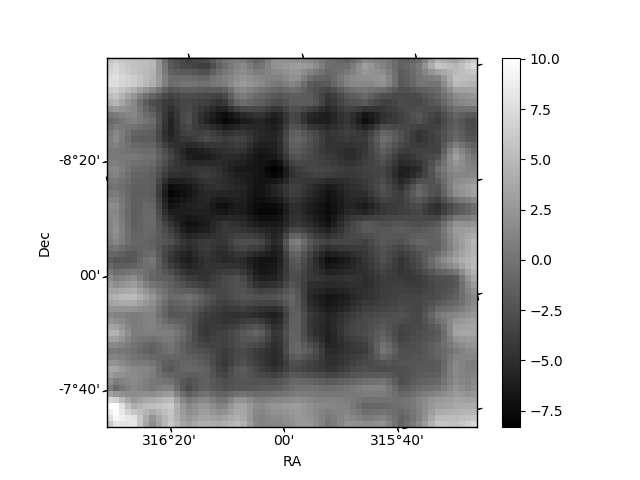
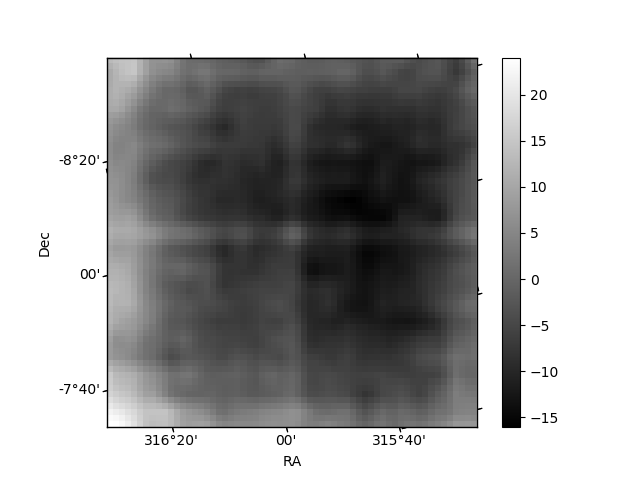
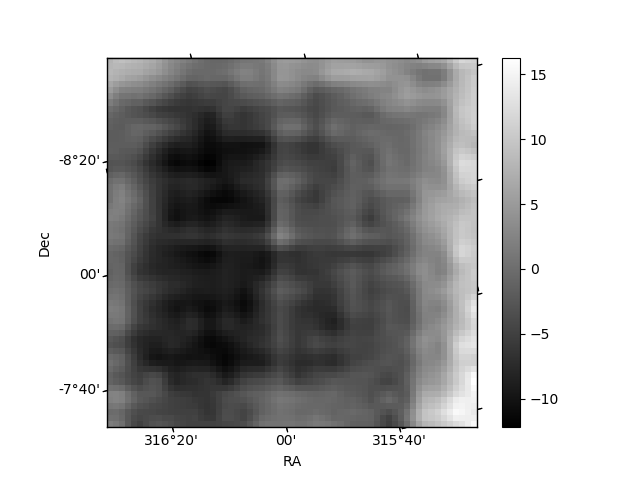
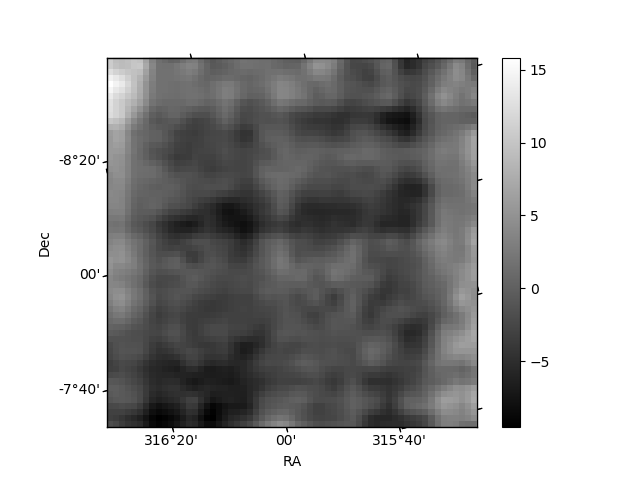
Histogram calculated using DETX and DETY for each event in the final _common_clean file
| Quadrant A | 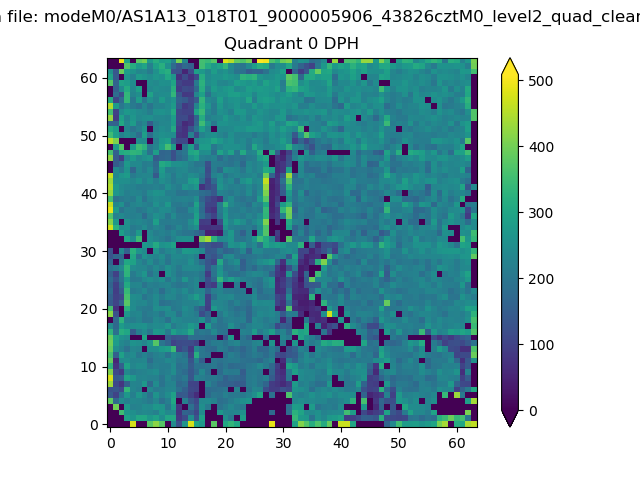 |
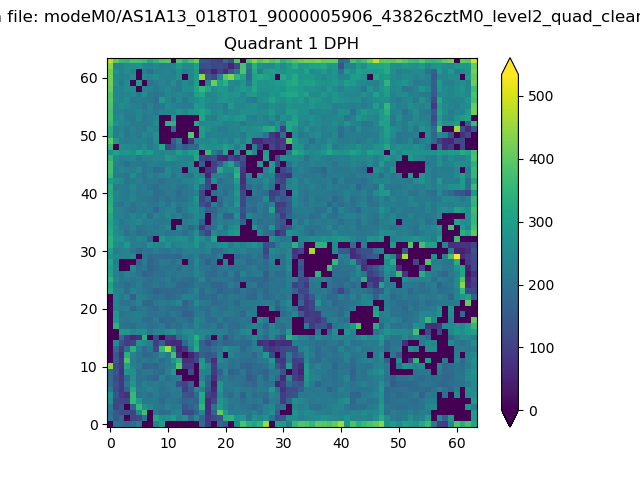 |
Quadrant B |
|---|---|---|---|
| Quadrant D | 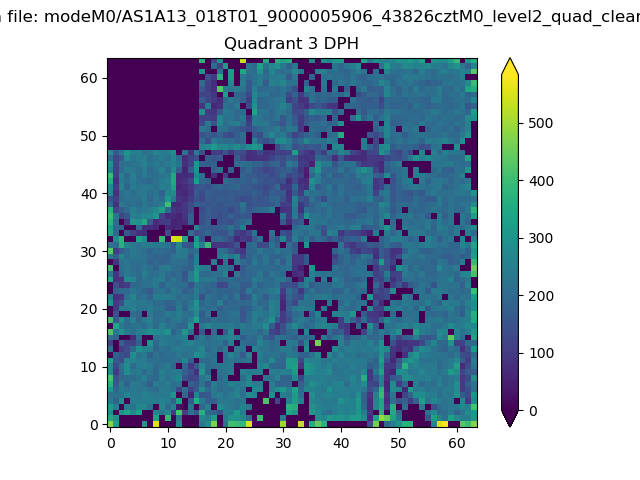 |
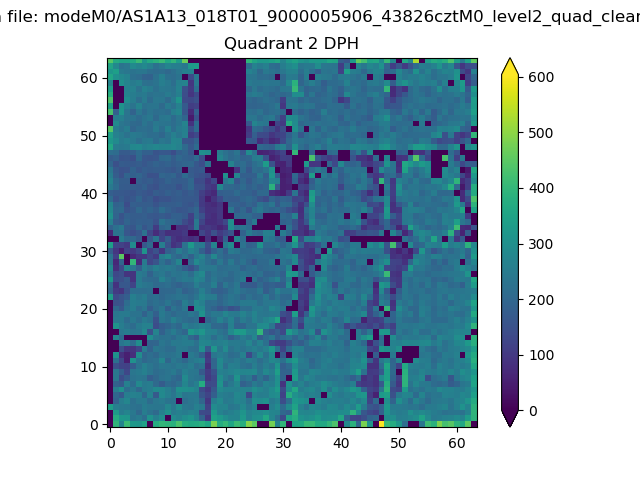 |
Quadrant C |
| Plot type | Count rate plots | Images |
|---|---|---|
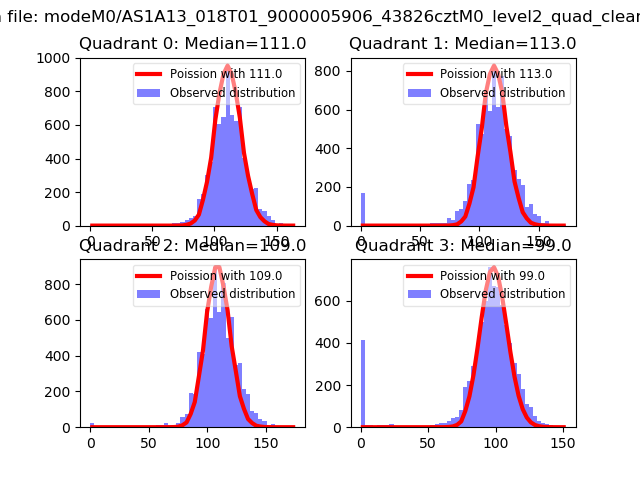
| Comparison with Poisson distribution Blue bars denote a histogram of data divided into 1 sec bins. Red curve is a Poisson curve with rate = median count rate of data. |
 |
 |
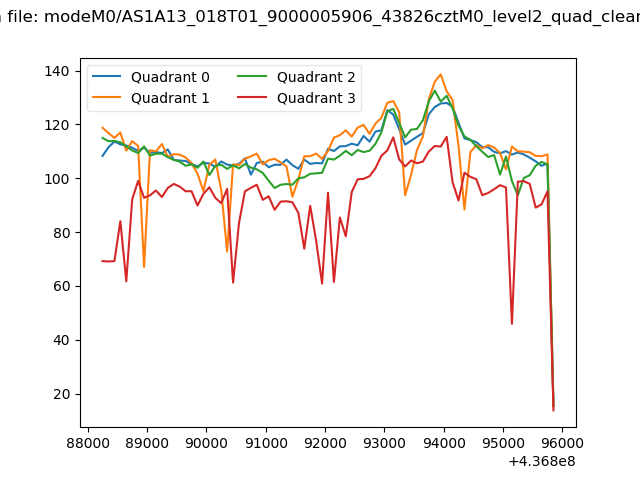
| Quadrant-wise count rates Data is divided into 100 sec bins |
 |
|
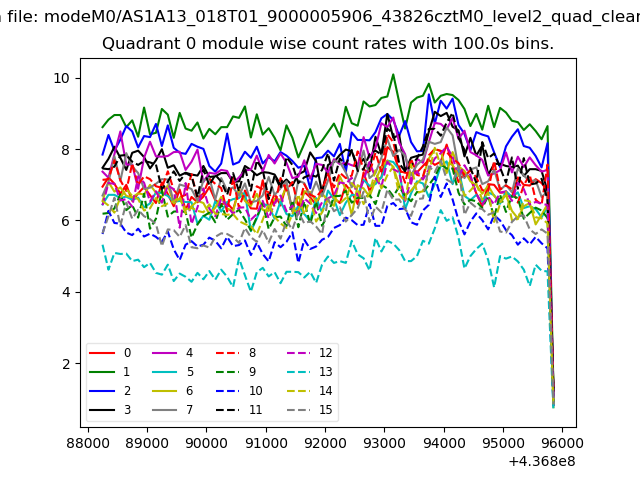
| Module-wise count rates for Quadrant A Data is divided into 100 sec bins |
 |
 |
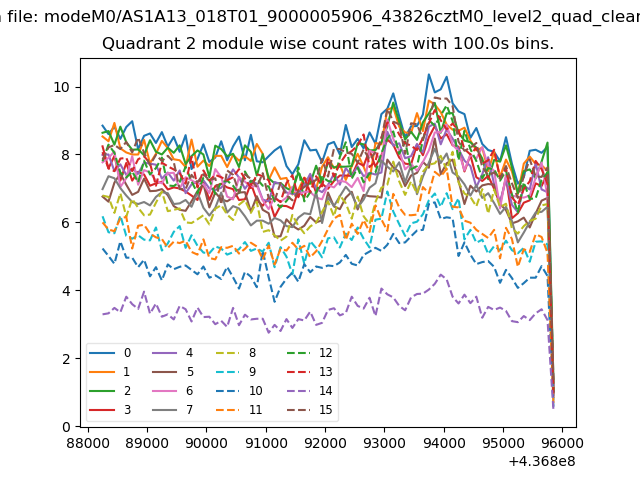
| Module-wise count rates for Quadrant B Data is divided into 100 sec bins |
 |
 |
| Module-wise count rates for Quadrant C Data is divided into 100 sec bins |
 |
 |
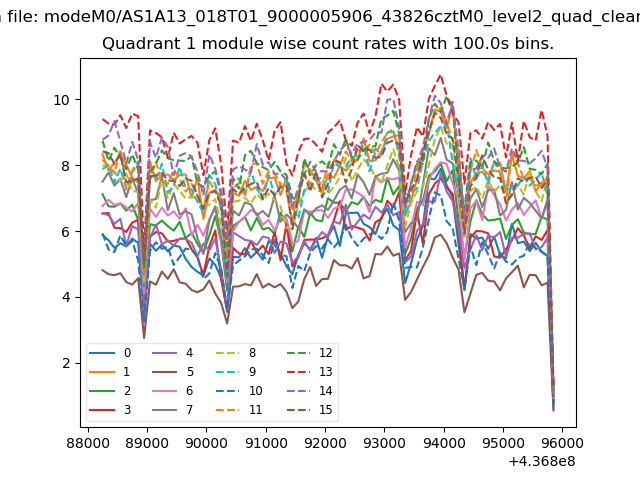
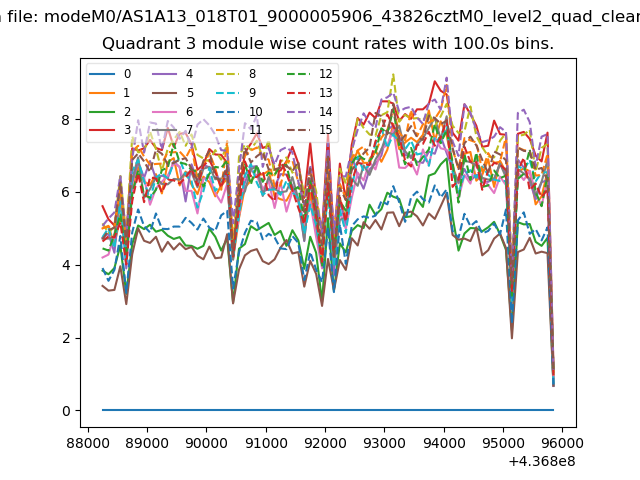
| Module-wise count rates for Quadrant D Data is divided into 100 sec bins |
 |
 |
| Parameter | Plot |
|---|---|
| CZT HV Monitor | 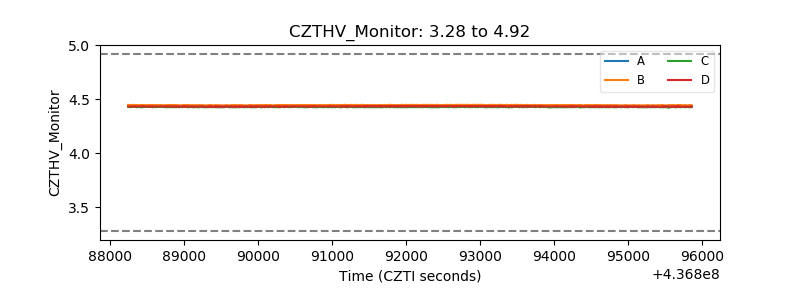 |
| D_VDD | 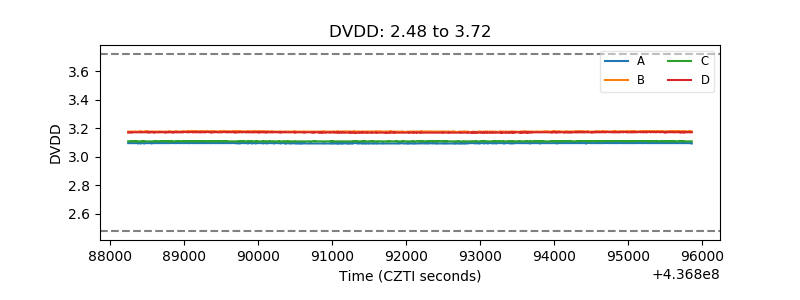 |
| Temperature 1 | 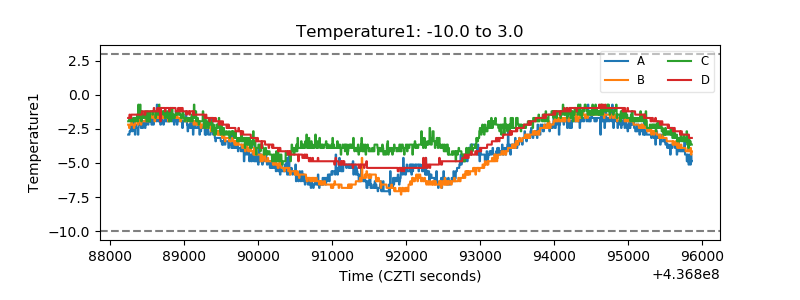 |
| Veto HV Monitor | 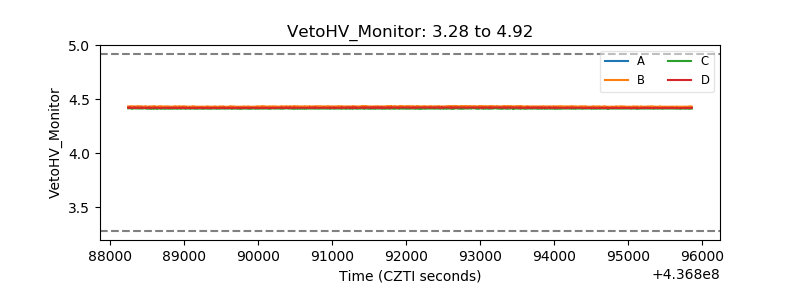 |
| Veto LLD | 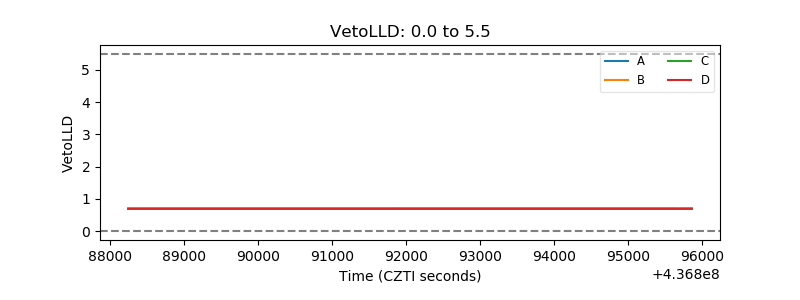 |
| Alpha Counter | 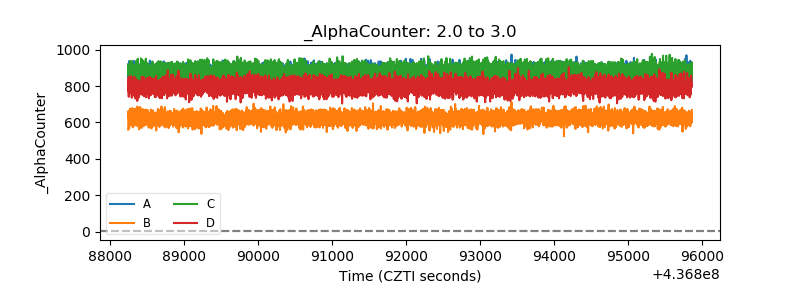 |
| _CPM_Rate | 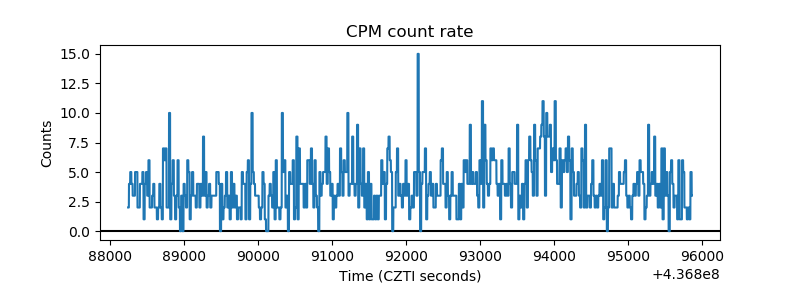 |
| CZT Counter | 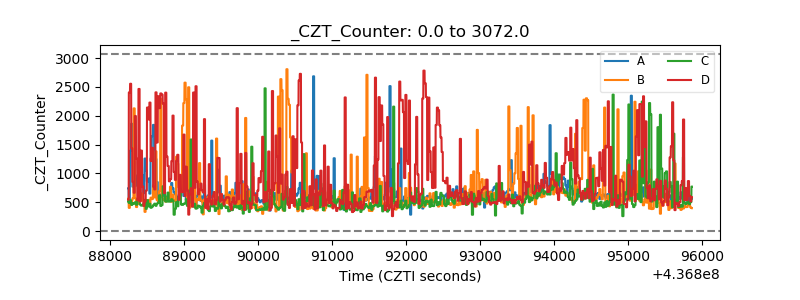 |
| +2.5 Volts monitor |  |
| +5 Volts monitor | 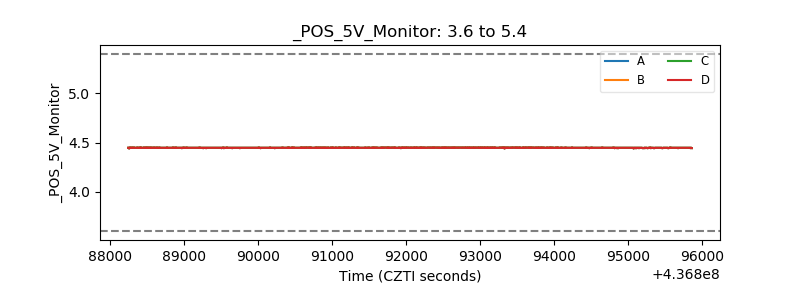 |
| _ROLL_ROT | 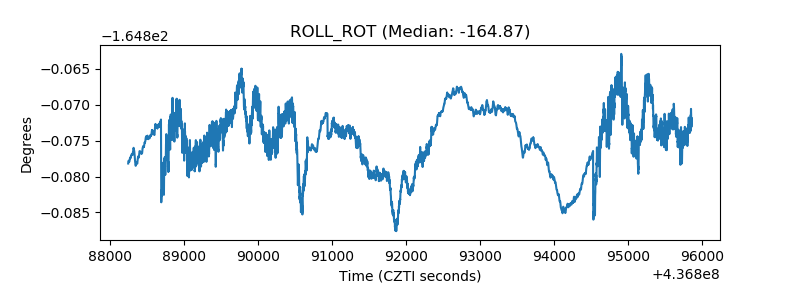 |
| _Roll_DEC | 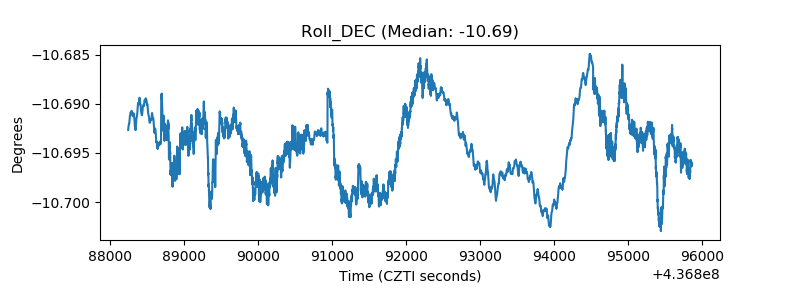 |
| _Roll_RA | 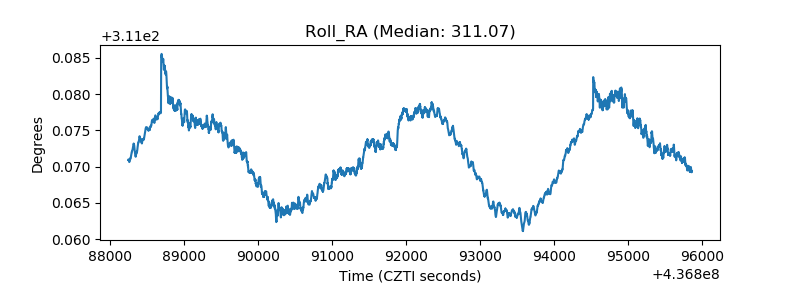 |
| Veto Counter | 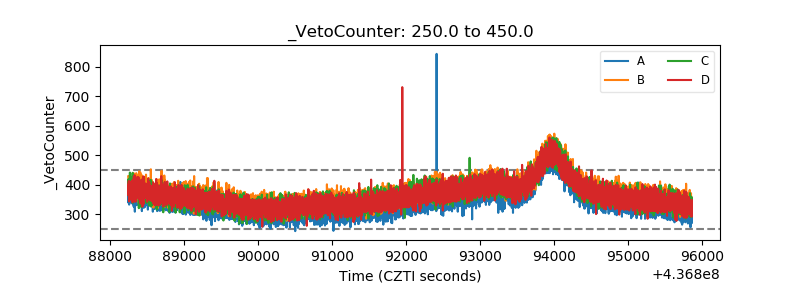 |