| Param | Original file | Final file |
|---|---|---|
| Filename | modeM0/AS1A13_018T01_9000005906_43827cztM0_level2.fits | modeM0/AS1A13_018T01_9000005906_43827cztM0_level2_quad_clean.evt |
| Size (bytes) | 734,132,160 | 136,039,680 |
| Size | 700.1 MB | 129.7 MB |
| Events in quadrant A | 6,593,202 | 915,250 |
| Events in quadrant B | 5,358,585 | 945,706 |
| Events in quadrant C | 6,259,176 | 921,168 |
| Events in quadrant D | 8,337,993 | 773,913 |
| Mode M0 | |||
|---|---|---|---|
| Quadrant | BADHDUFLAG | Total packets | Discarded packets |
| A | 0 | 25377 | 0 |
| B | 0 | 21529 | 0 |
| C | 0 | 24305 | 0 |
| D | 0 | 30464 | 0 |
| Mode SS | |||
|---|---|---|---|
| Quadrant | BADHDUFLAG | Total packets | Discarded packets |
| A | 0 | 162 | 0 |
| B | 0 | 162 | 0 |
| C | 0 | 162 | 0 |
| D | 0 | 162 | 0 |
| Quadrant | Total seconds | Saturated seconds | Saturation percentage |
|---|---|---|---|
| A | 8098 | 520 | 6.421339% |
| B | 8098 | 399 | 4.927143% |
| C | 8098 | 273 | 3.371203% |
| D | 8099 | 1158 | 14.298061% |
Noise dominated data is calculated using 1-second bins in cleaned event files. If a bin has >2000 counts, and if more than 50% of those come from <1% of pixels, then it is considered to be noise-dominated and hence unusable.
| Quadrant | # 1 sec bins | Bins with >0 counts | Bins with >2000 counts | High rate bins dominated by noise | Noise dominated (total time) | Noise dominated (detector-on time) | Marked lightcurve |
|---|---|---|---|---|---|---|---|
| A | 8098 | 8098 | 439 | 439 | 5.42% | 5.42% | 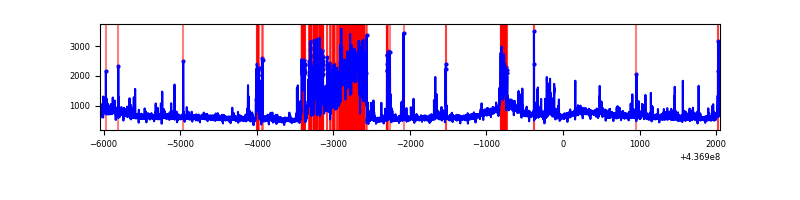 |
| B | 8098 | 8098 | 285 | 285 | 3.52% | 3.52% | 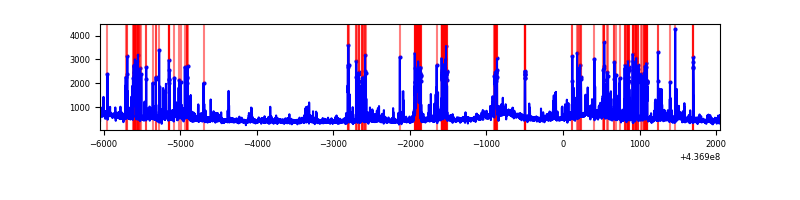 |
| C | 8098 | 8098 | 242 | 242 | 2.99% | 2.99% | 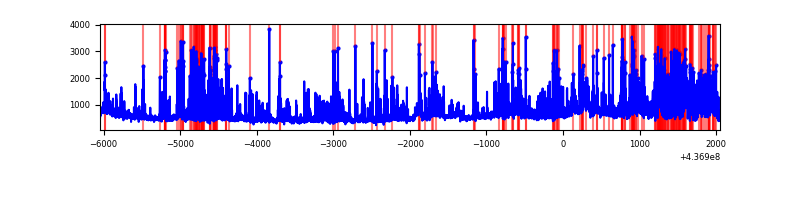 |
| D | 8099 | 8099 | 1020 | 1020 | 12.59% | 12.59% | 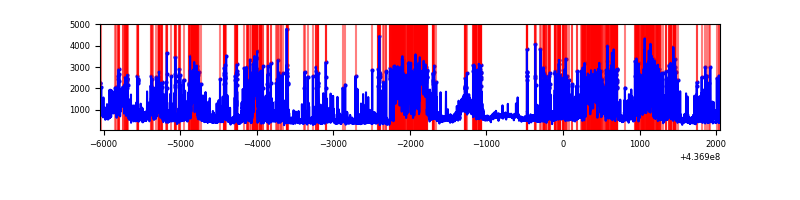 |
Top three noisy pixels from each quadrant. If the there are fewer than three noisy pixels in the level2.evt file, extra rows are filled as -1
| Pixel properties | Quadrant properties | ||||||
|---|---|---|---|---|---|---|---|
| Quadrant | DetID | PixID | Counts | Sigma | Mean | Median | Sigma |
| A | 15 | 223 | 1576004 | 7923.86 | 950 | 934 | 198.8 |
| A | 10 | 83 | 1143813 | 5749.6 | 950 | 934 | 198.8 |
| A | 13 | 248 | 76537 | 380.34 | 950 | 934 | 198.8 |
| B | 5 | 172 | 716295 | 3884.33 | 938 | 913 | 184.2 |
| B | 5 | 235 | 436916 | 2367.38 | 938 | 913 | 184.2 |
| B | 15 | 36 | 156657 | 845.65 | 938 | 913 | 184.2 |
| C | 15 | 158 | 1063918 | 4876.55 | 920 | 924 | 218.0 |
| C | 3 | 233 | 1062435 | 4869.75 | 920 | 924 | 218.0 |
| C | 15 | 173 | 256471 | 1172.34 | 920 | 924 | 218.0 |
| D | 5 | 235 | 1741815 | 7724.66 | 885 | 857 | 225.4 |
| D | 1 | 52 | 681547 | 3020.23 | 885 | 857 | 225.4 |
| D | 7 | 80 | 576611 | 2554.63 | 885 | 857 | 225.4 |
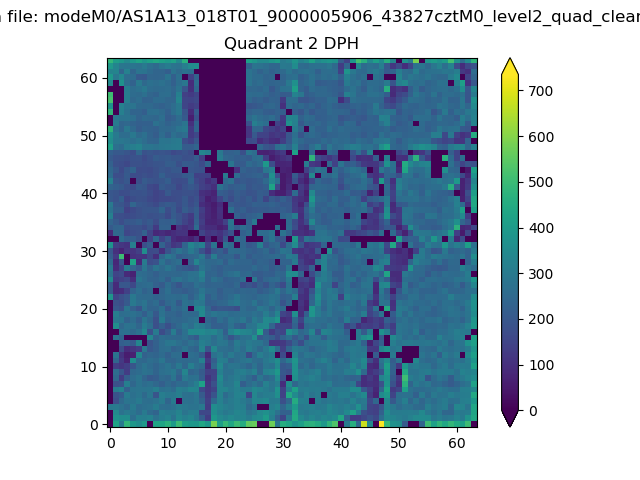
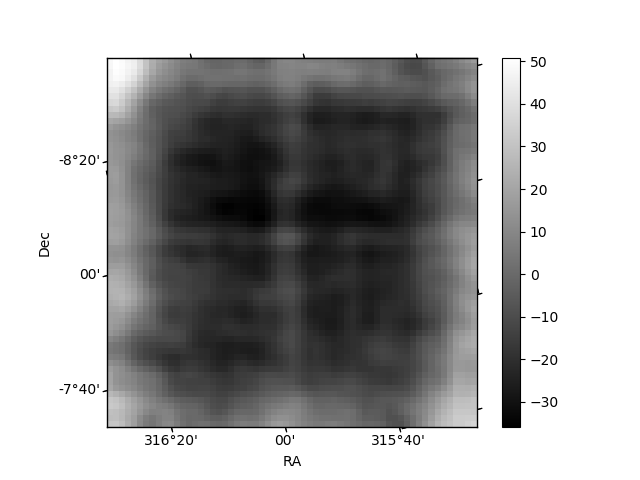
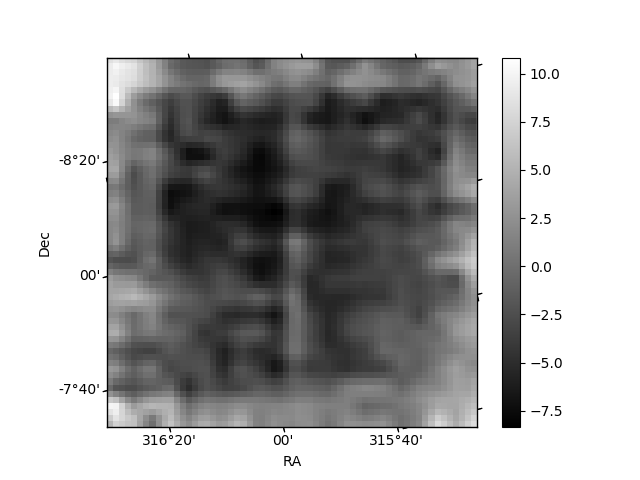
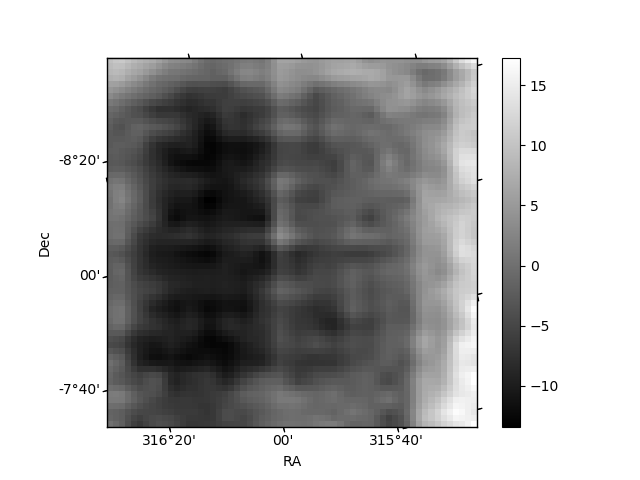
Histogram calculated using DETX and DETY for each event in the final _common_clean file
| Quadrant A | 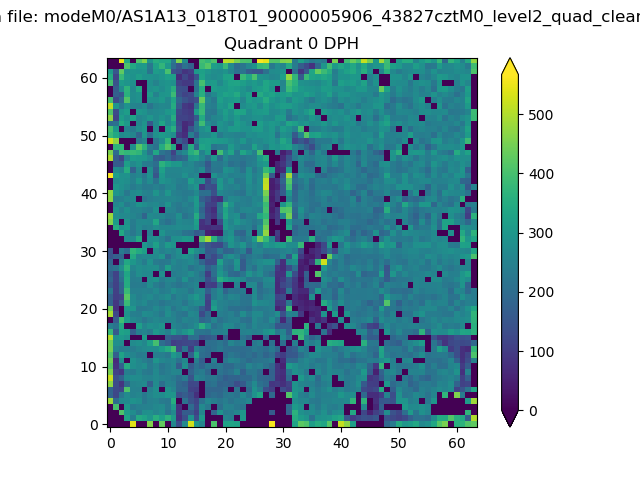 |
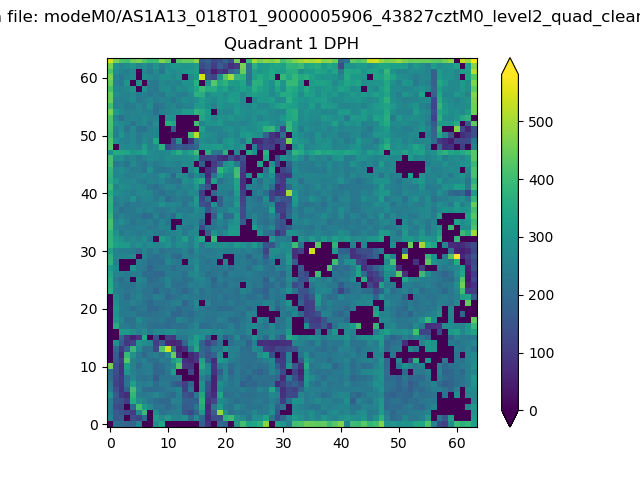 |
Quadrant B |
|---|---|---|---|
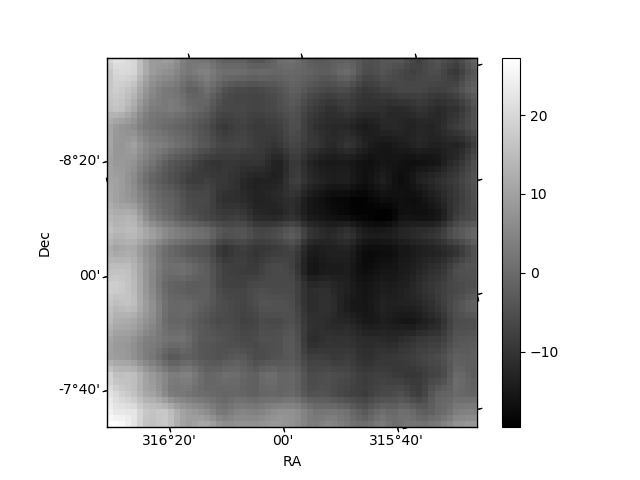
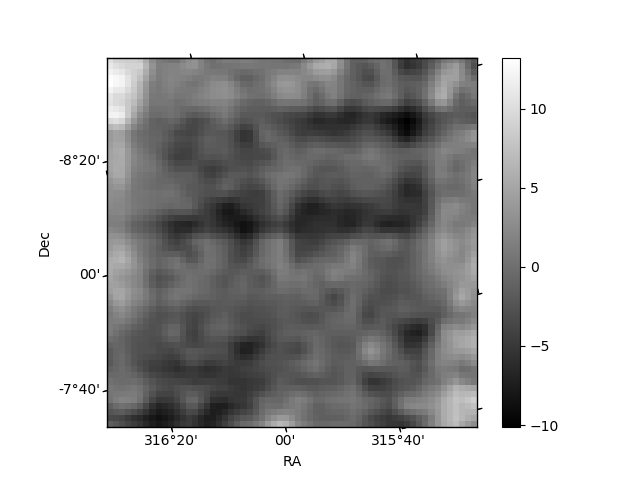
| Quadrant D | 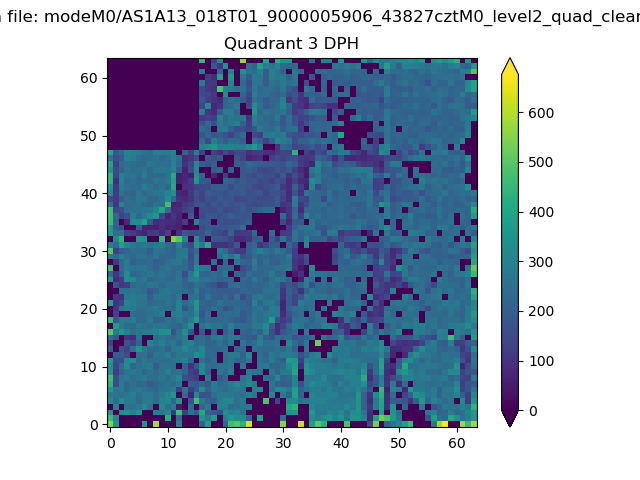 |
 |
Quadrant C |
| Plot type | Count rate plots | Images |
|---|---|---|
| Comparison with Poisson distribution Blue bars denote a histogram of data divided into 1 sec bins. Red curve is a Poisson curve with rate = median count rate of data. |
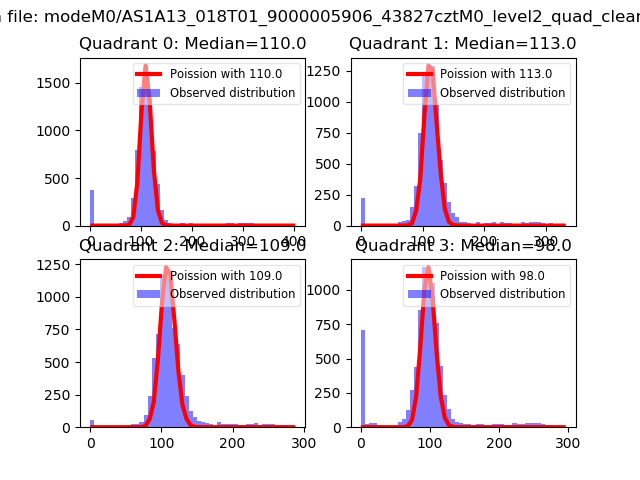 |
 |
| Quadrant-wise count rates Data is divided into 100 sec bins |
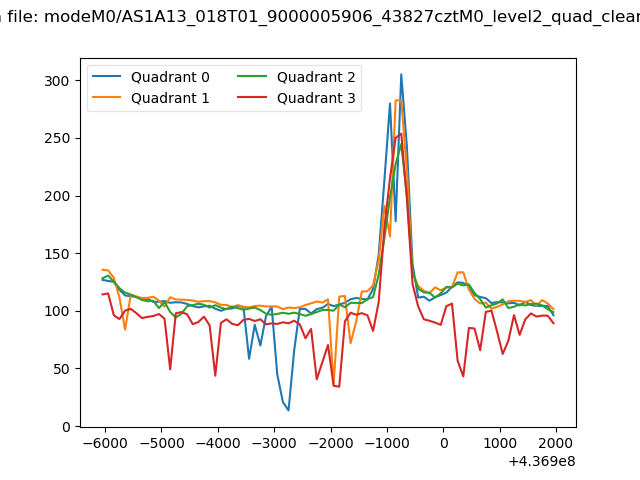 |
|
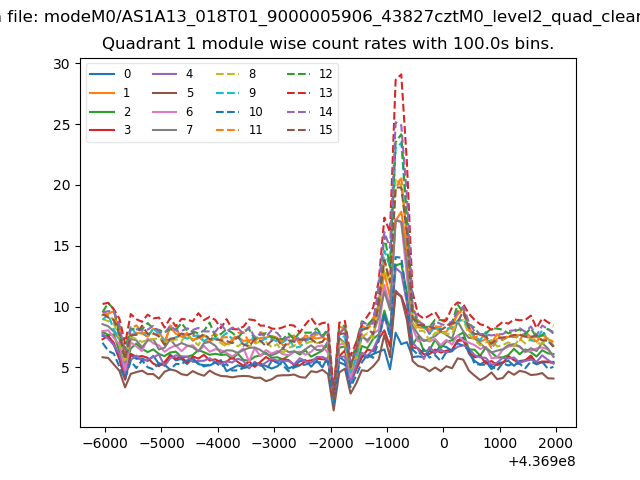
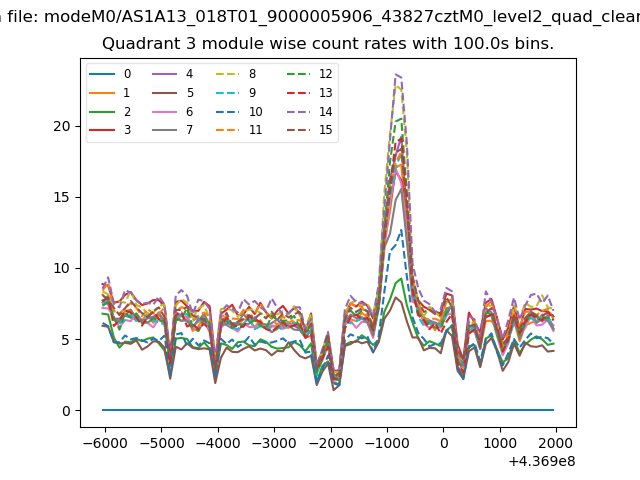
| Module-wise count rates for Quadrant A Data is divided into 100 sec bins |
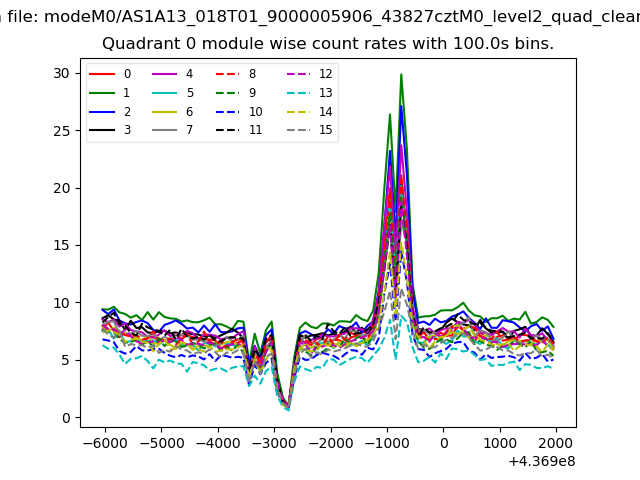 |
 |
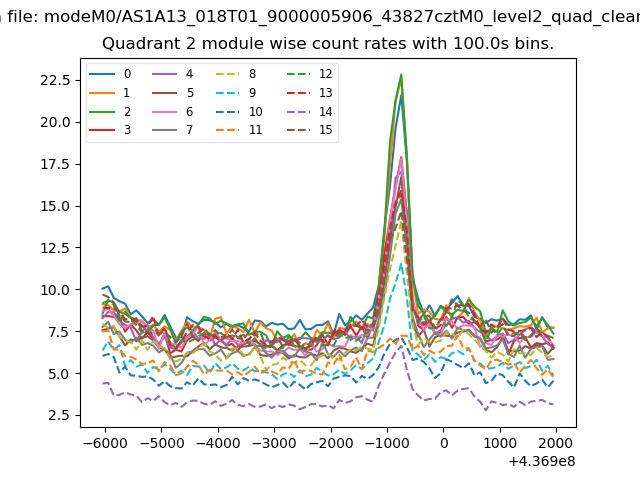
| Module-wise count rates for Quadrant B Data is divided into 100 sec bins |
 |
 |
| Module-wise count rates for Quadrant C Data is divided into 100 sec bins |
 |
 |
| Module-wise count rates for Quadrant D Data is divided into 100 sec bins |
 |
 |
| Parameter | Plot |
|---|---|
| CZT HV Monitor | 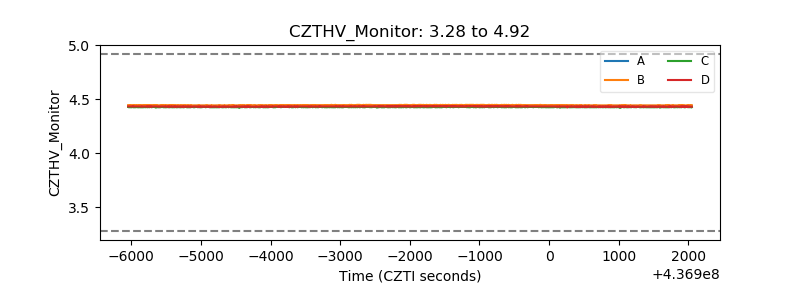 |
| D_VDD | 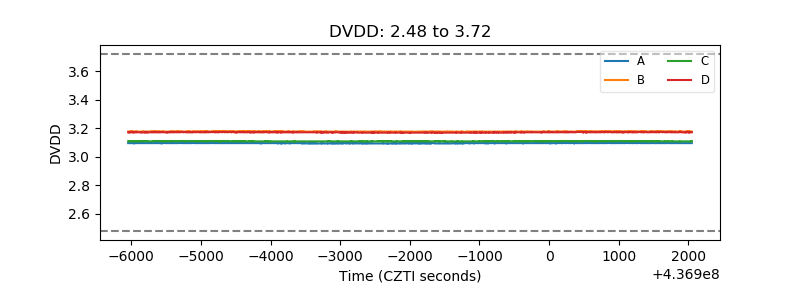 |
| Temperature 1 | 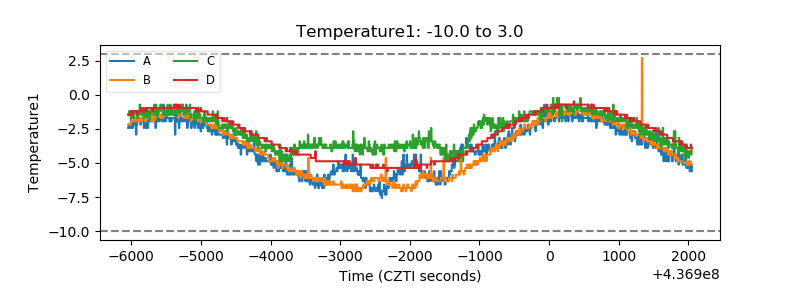 |
| Veto HV Monitor | 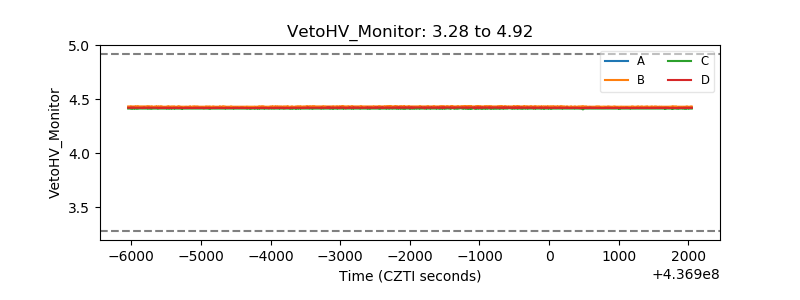 |
| Veto LLD | 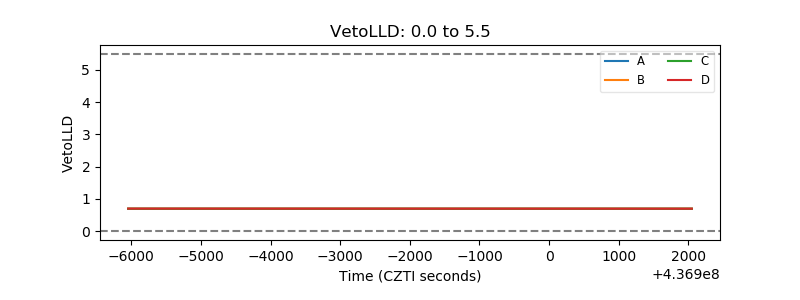 |
| Alpha Counter | 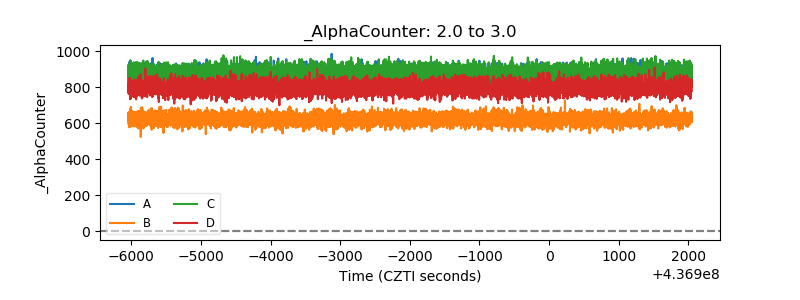 |
| _CPM_Rate | 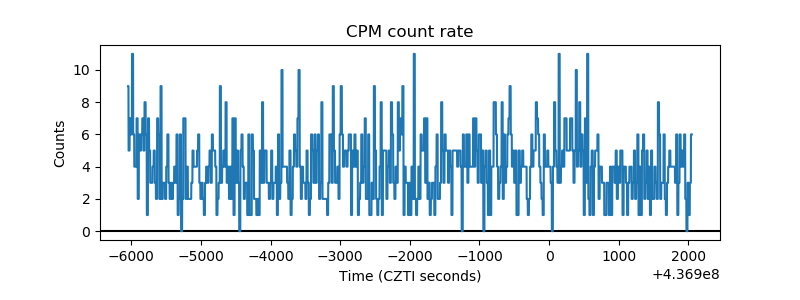 |
| CZT Counter | 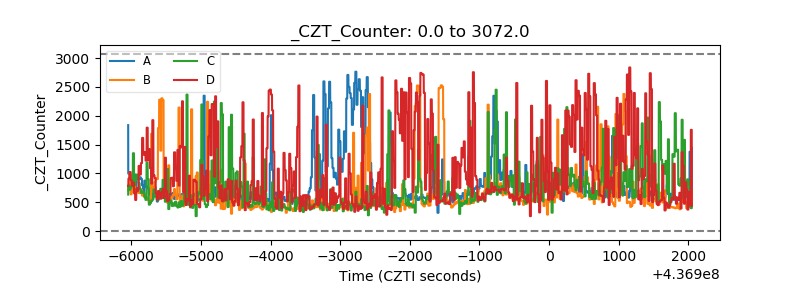 |
| +2.5 Volts monitor | 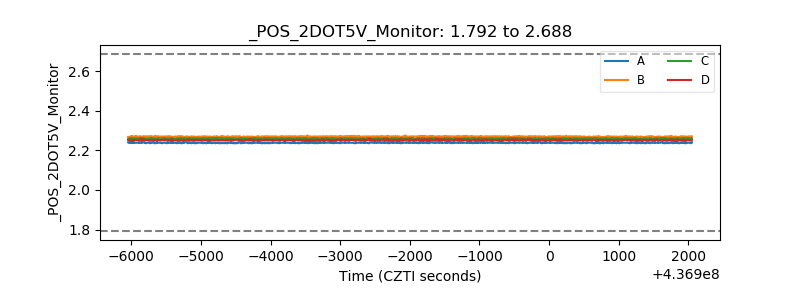 |
| +5 Volts monitor | 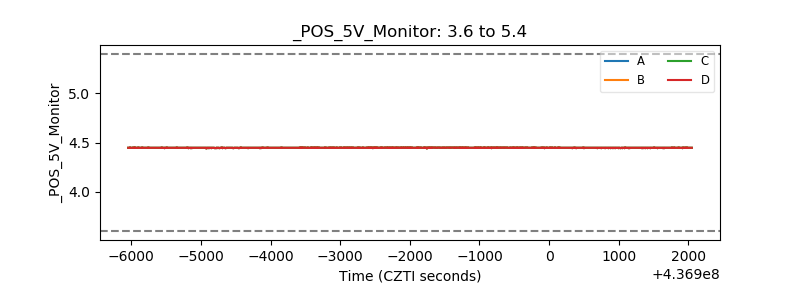 |
| _ROLL_ROT | 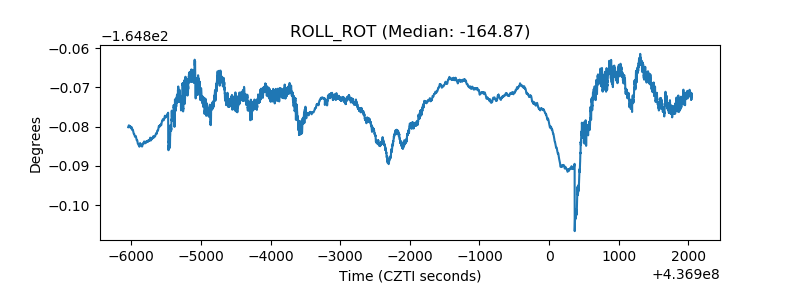 |
| _Roll_DEC | 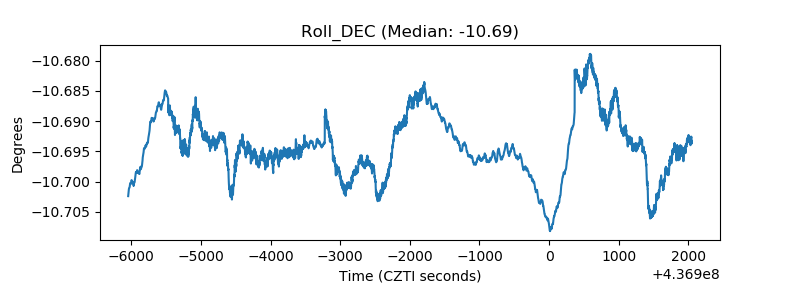 |
| _Roll_RA | 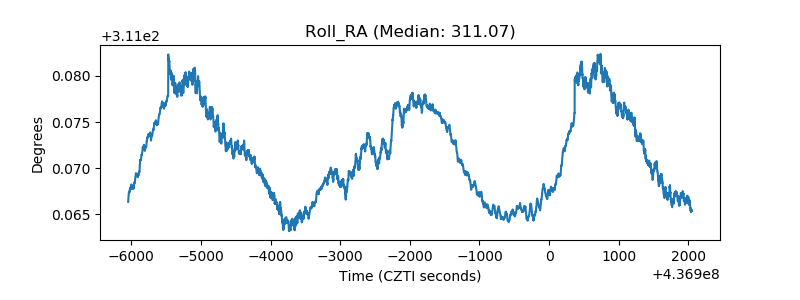 |
| Veto Counter | 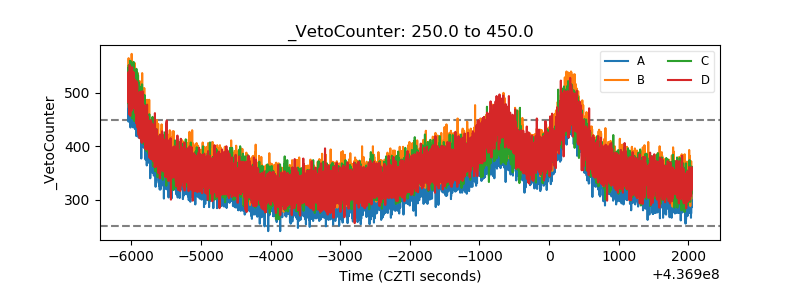 |