| Param | Original file | Final file |
|---|---|---|
| Filename | modeM0/AS1A13_018T01_9000005906_43831cztM0_level2.fits | modeM0/AS1A13_018T01_9000005906_43831cztM0_level2_quad_clean.evt |
| Size (bytes) | 766,932,480 | 103,518,720 |
| Size | 731.4 MB | 98.7 MB |
| Events in quadrant A | 7,572,377 | 652,482 |
| Events in quadrant B | 5,910,262 | 727,656 |
| Events in quadrant C | 7,265,682 | 666,854 |
| Events in quadrant D | 7,098,693 | 597,481 |
| Mode M0 | |||
|---|---|---|---|
| Quadrant | BADHDUFLAG | Total packets | Discarded packets |
| A | 0 | 27520 | 2 |
| B | 0 | 22276 | 2 |
| C | 0 | 26513 | 2 |
| D | 0 | 25966 | 5 |
| Mode SS | |||
|---|---|---|---|
| Quadrant | BADHDUFLAG | Total packets | Discarded packets |
| A | 0 | 144 | 0 |
| B | 0 | 144 | 0 |
| C | 0 | 144 | 0 |
| D | 0 | 144 | 0 |
| Mode M9 | |||
|---|---|---|---|
| Quadrant | BADHDUFLAG | Total packets | Discarded packets |
| A | 0 | 12 | 0 |
| B | 0 | 13 | 0 |
| C | 0 | 13 | 0 |
| D | 0 | 13 | 0 |
| Quadrant | Total seconds | Saturated seconds | Saturation percentage |
|---|---|---|---|
| A | 7020 | 1060 | 15.099715% |
| B | 7020 | 627 | 8.931624% |
| C | 7020 | 867 | 12.350427% |
| D | 7019 | 1006 | 14.332526% |
Noise dominated data is calculated using 1-second bins in cleaned event files. If a bin has >2000 counts, and if more than 50% of those come from <1% of pixels, then it is considered to be noise-dominated and hence unusable.
| Quadrant | # 1 sec bins | Bins with >0 counts | Bins with >2000 counts | High rate bins dominated by noise | Noise dominated (total time) | Noise dominated (detector-on time) | Marked lightcurve |
|---|---|---|---|---|---|---|---|
| A | 7860 | 7021 | 934 | 934 | 11.88% | 13.30% | 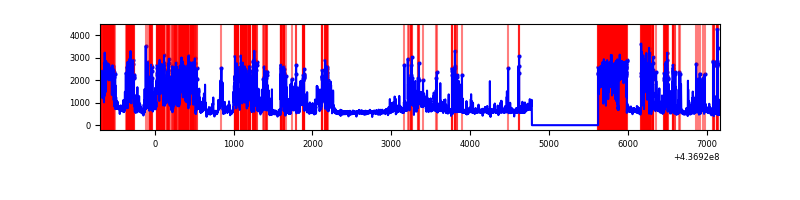 |
| B | 7860 | 7020 | 454 | 454 | 5.78% | 6.47% | 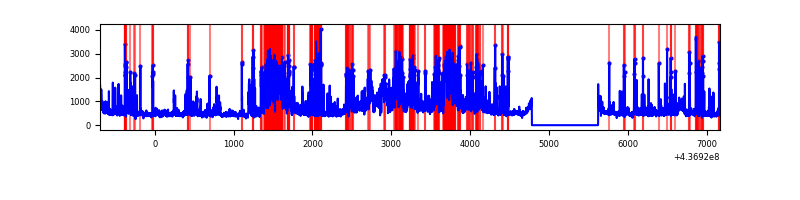 |
| C | 7860 | 7021 | 666 | 666 | 8.47% | 9.49% | 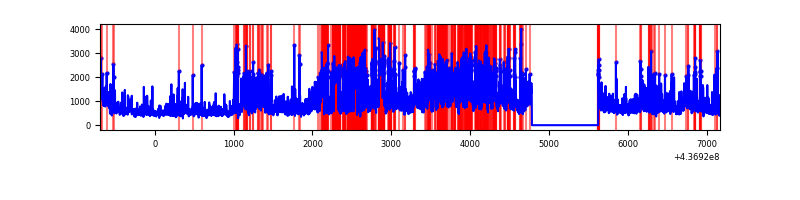 |
| D | 7858 | 7018 | 882 | 882 | 11.22% | 12.57% | 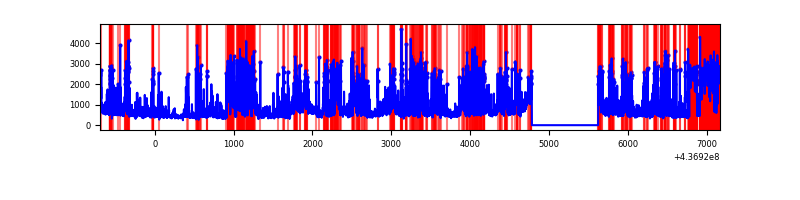 |
Top three noisy pixels from each quadrant. If the there are fewer than three noisy pixels in the level2.evt file, extra rows are filled as -1
| Pixel properties | Quadrant properties | ||||||
|---|---|---|---|---|---|---|---|
| Quadrant | DetID | PixID | Counts | Sigma | Mean | Median | Sigma |
| A | 15 | 223 | 3306655 | 21419.78 | 742 | 726 | 154.3 |
| A | 10 | 83 | 1011966 | 6552.03 | 742 | 726 | 154.3 |
| A | 0 | 175 | 268241 | 1733.28 | 742 | 726 | 154.3 |
| B | 0 | 200 | 1384981 | 9246.26 | 765 | 743 | 149.7 |
| B | 5 | 235 | 911007 | 6080.26 | 765 | 743 | 149.7 |
| B | 4 | 170 | 174307 | 1159.35 | 765 | 743 | 149.7 |
| C | 3 | 233 | 4225414 | 24266.99 | 740 | 746 | 174.1 |
| C | 15 | 158 | 73070 | 415.44 | 740 | 746 | 174.1 |
| C | 15 | 157 | 36536 | 205.58 | 740 | 746 | 174.1 |
| D | 5 | 235 | 2028123 | 10955.42 | 719 | 695 | 185.1 |
| D | 1 | 52 | 1120628 | 6051.67 | 719 | 695 | 185.1 |
| D | 5 | 222 | 270371 | 1457.22 | 719 | 695 | 185.1 |
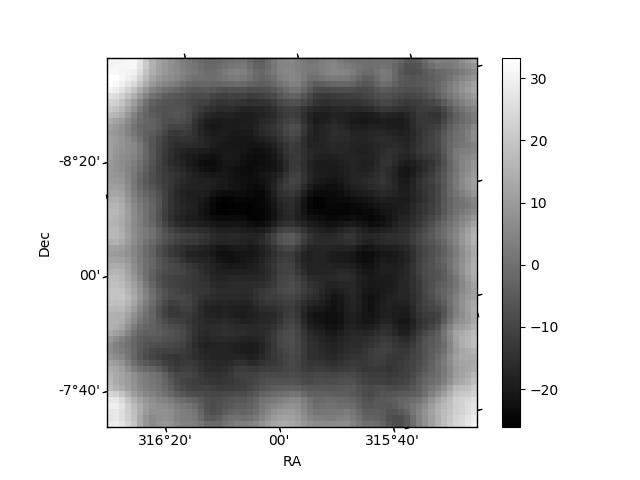
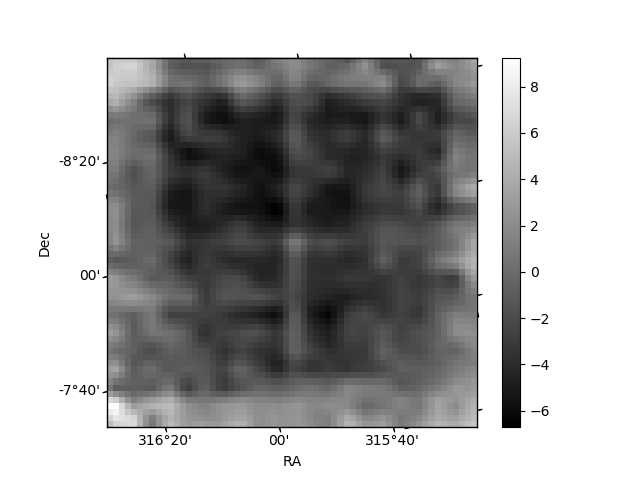
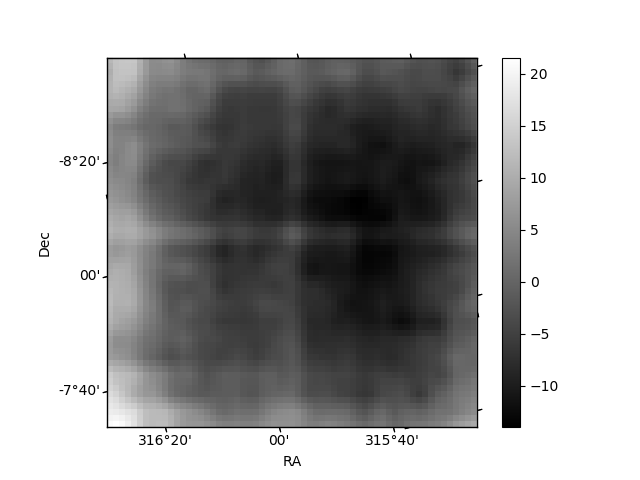
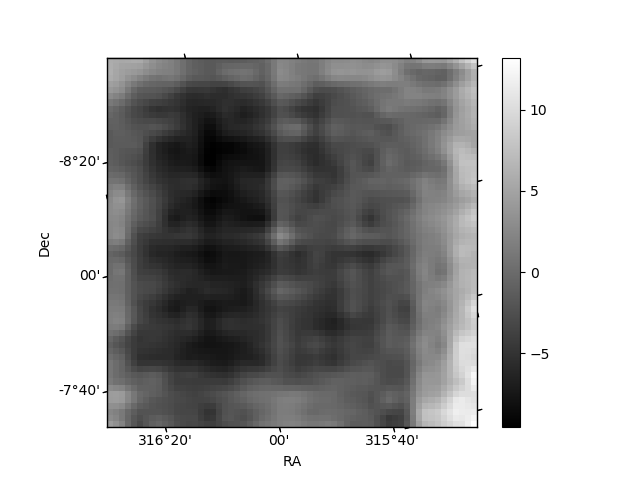
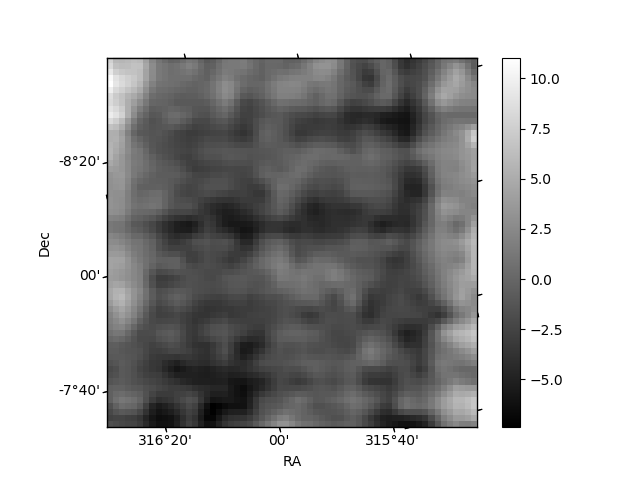
Histogram calculated using DETX and DETY for each event in the final _common_clean file
| Quadrant A | 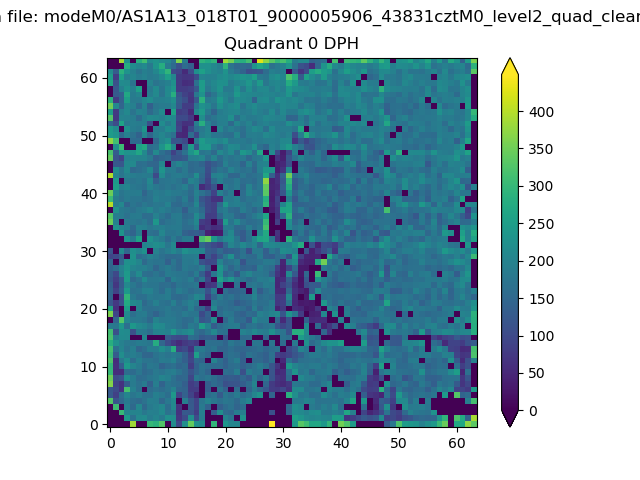 |
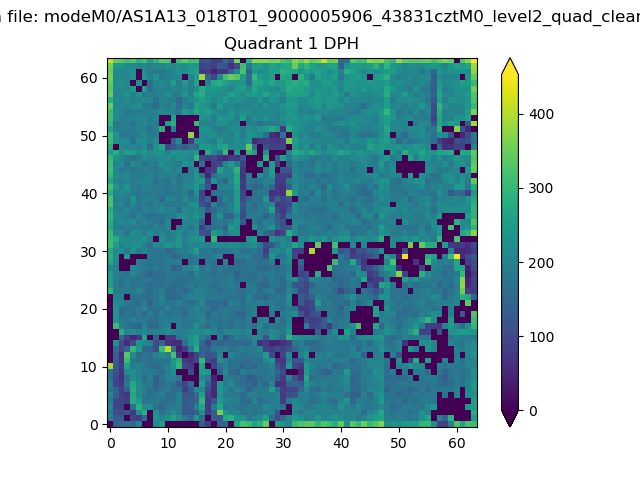 |
Quadrant B |
|---|---|---|---|
| Quadrant D |  |
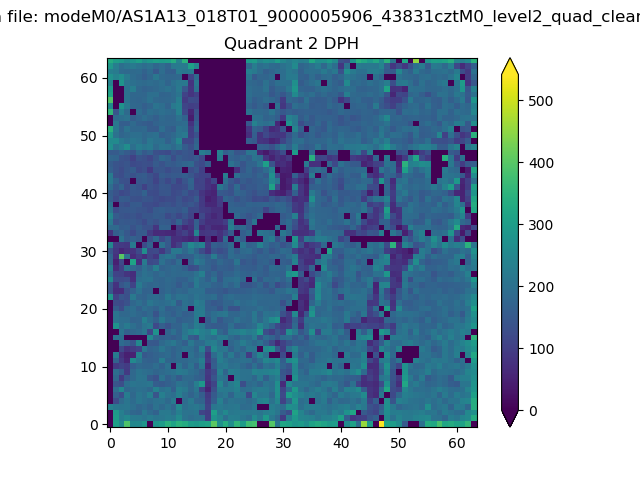 |
Quadrant C |
| Plot type | Count rate plots | Images |
|---|---|---|
| Comparison with Poisson distribution Blue bars denote a histogram of data divided into 1 sec bins. Red curve is a Poisson curve with rate = median count rate of data. |
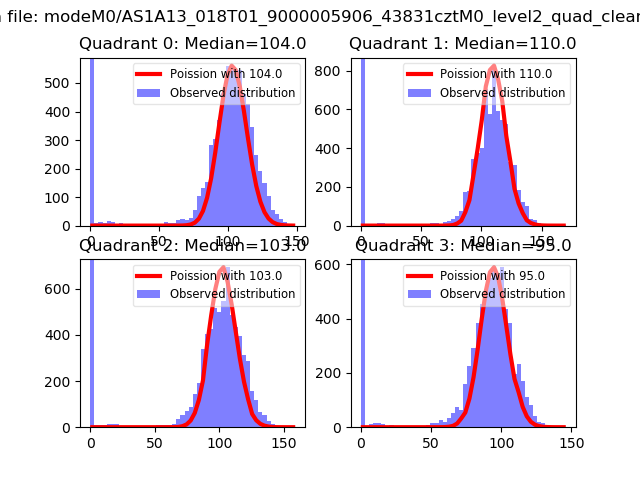 |
 |
| Quadrant-wise count rates Data is divided into 100 sec bins |
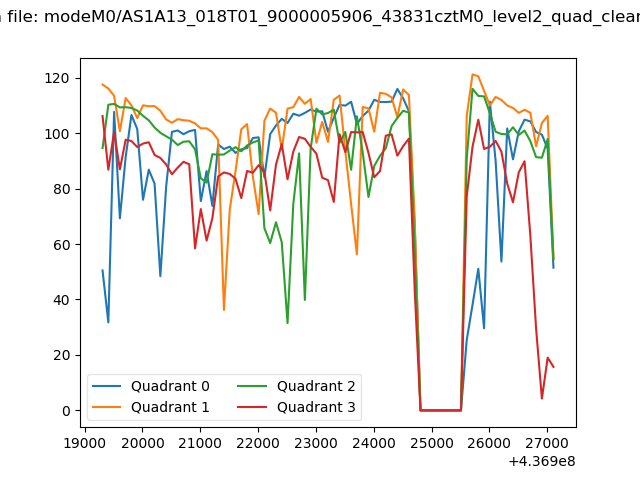 |
|
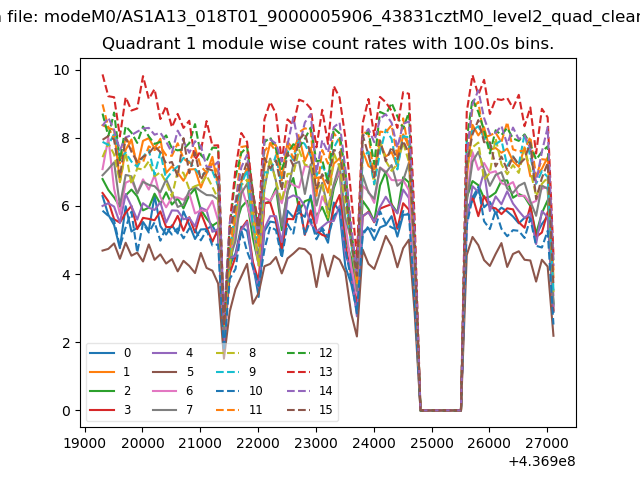
| Module-wise count rates for Quadrant A Data is divided into 100 sec bins |
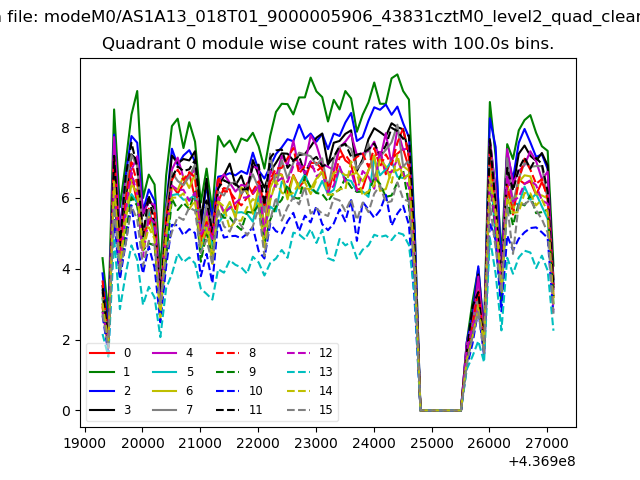 |
 |
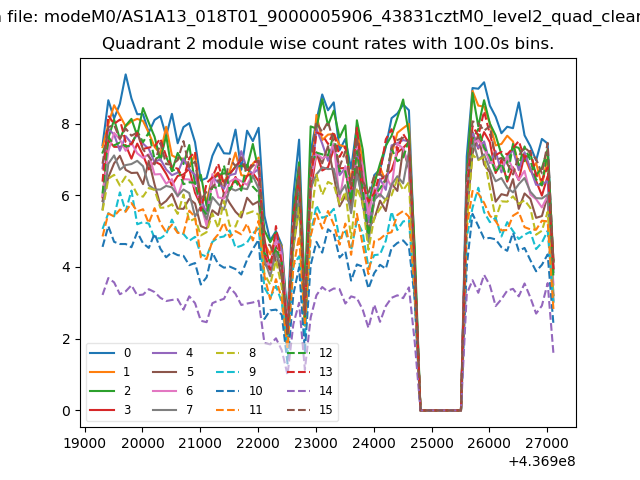
| Module-wise count rates for Quadrant B Data is divided into 100 sec bins |
 |
 |
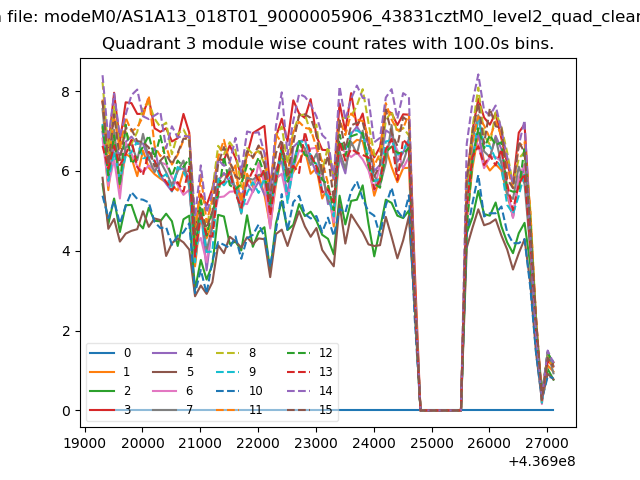
| Module-wise count rates for Quadrant C Data is divided into 100 sec bins |
 |
 |
| Module-wise count rates for Quadrant D Data is divided into 100 sec bins |
 |
 |
| Parameter | Plot |
|---|---|
| CZT HV Monitor | 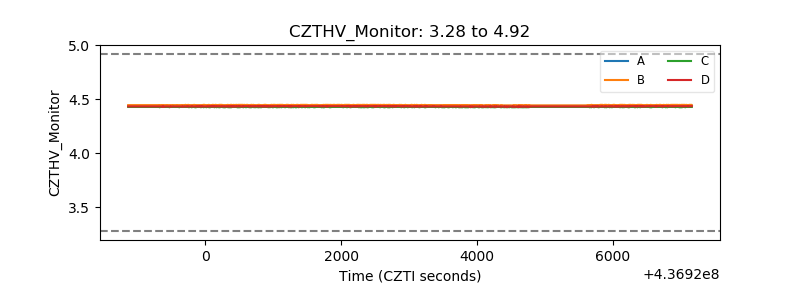 |
| D_VDD | 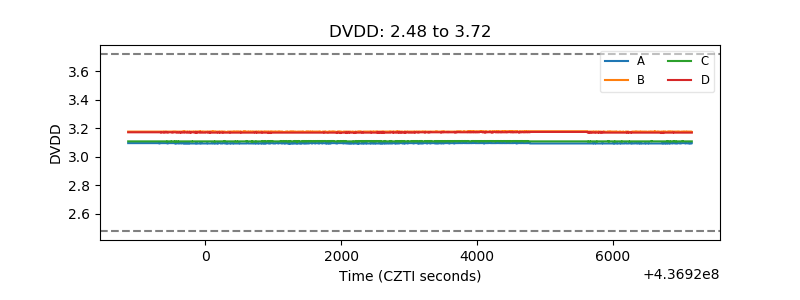 |
| Temperature 1 | 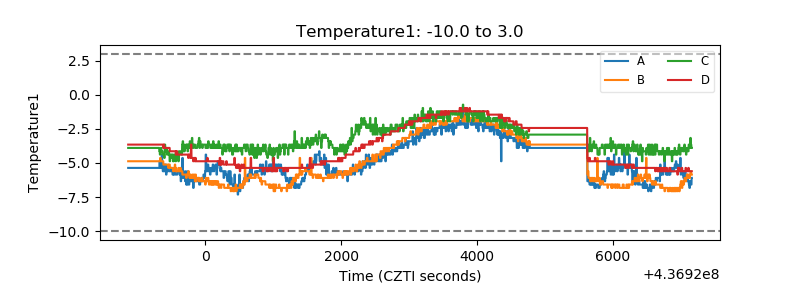 |
| Veto HV Monitor | 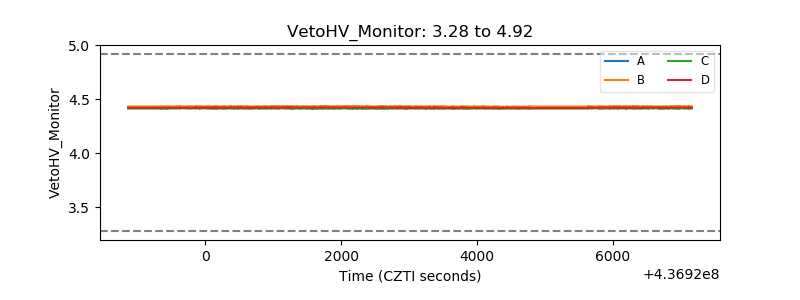 |
| Veto LLD | 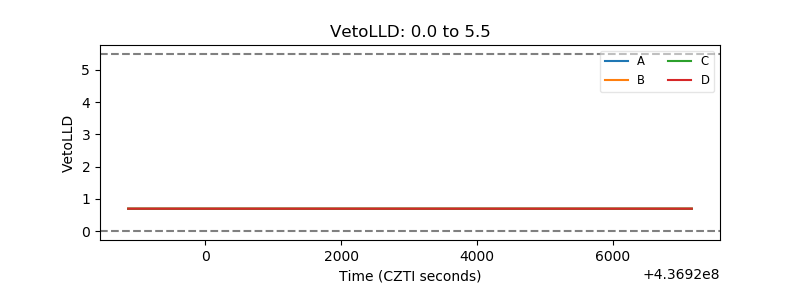 |
| Alpha Counter | 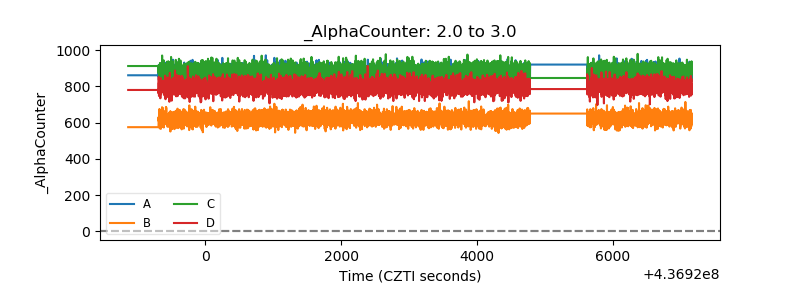 |
| _CPM_Rate | 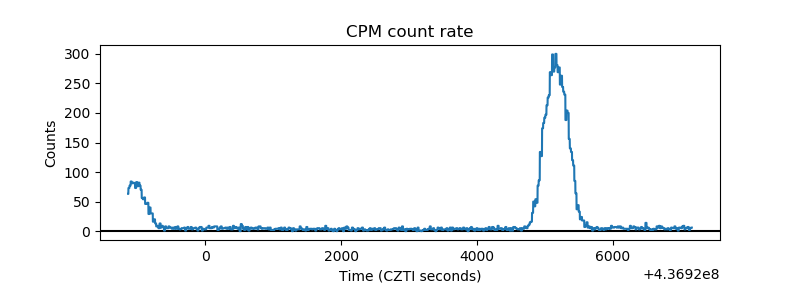 |
| CZT Counter | 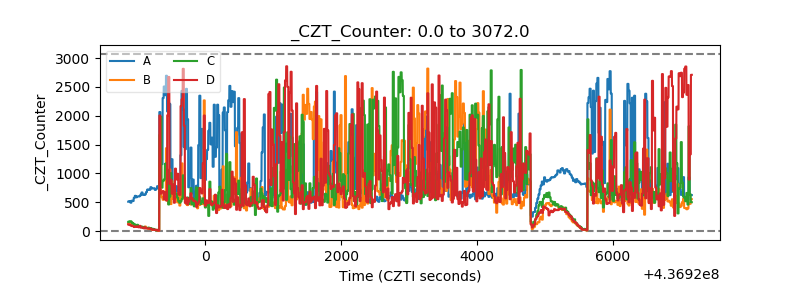 |
| +2.5 Volts monitor | 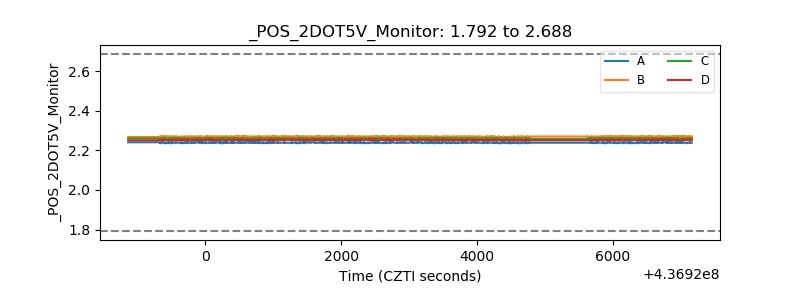 |
| +5 Volts monitor | 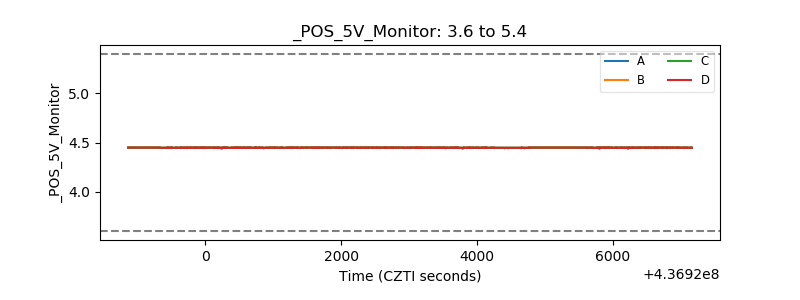 |
| _ROLL_ROT | 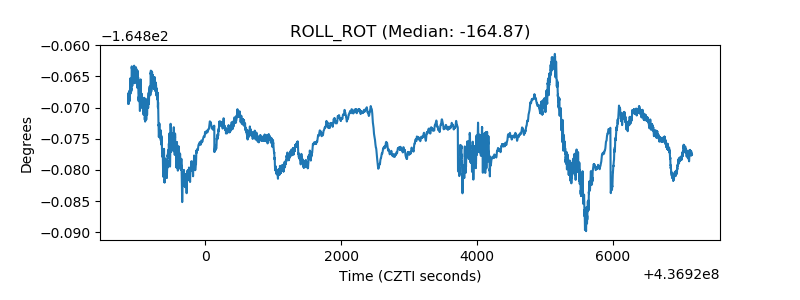 |
| _Roll_DEC | 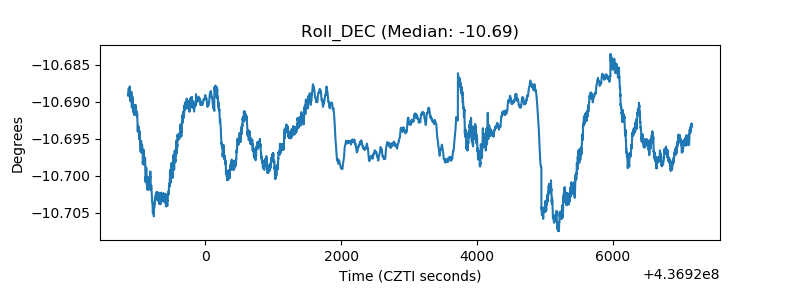 |
| _Roll_RA | 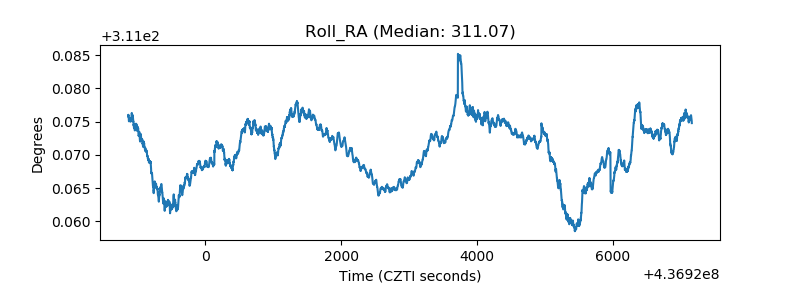 |
| Veto Counter | 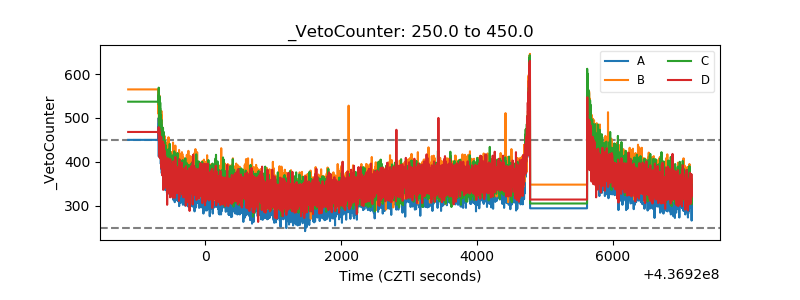 |