| Param | Original file | Final file |
|---|---|---|
| Filename | modeM0/AS1A13_018T01_9000005906_43832cztM0_level2.fits | modeM0/AS1A13_018T01_9000005906_43832cztM0_level2_quad_clean.evt |
| Size (bytes) | 699,007,680 | 98,945,280 |
| Size | 666.6 MB | 94.4 MB |
| Events in quadrant A | 7,162,429 | 627,421 |
| Events in quadrant B | 4,863,322 | 708,994 |
| Events in quadrant C | 5,211,362 | 700,698 |
| Events in quadrant D | 8,126,896 | 497,932 |
| Mode M0 | |||
|---|---|---|---|
| Quadrant | BADHDUFLAG | Total packets | Discarded packets |
| A | 0 | 25984 | 2 |
| B | 0 | 18751 | 2 |
| C | 0 | 20098 | 2 |
| D | 0 | 28691 | 2 |
| Mode SS | |||
|---|---|---|---|
| Quadrant | BADHDUFLAG | Total packets | Discarded packets |
| A | 0 | 134 | 0 |
| B | 0 | 134 | 0 |
| C | 0 | 134 | 0 |
| D | 0 | 134 | 0 |
| Mode M9 | |||
|---|---|---|---|
| Quadrant | BADHDUFLAG | Total packets | Discarded packets |
| A | 0 | 10 | 0 |
| B | 0 | 11 | 0 |
| C | 0 | 11 | 0 |
| D | 0 | 11 | 0 |
| Quadrant | Total seconds | Saturated seconds | Saturation percentage |
|---|---|---|---|
| A | 6607 | 1002 | 15.165733% |
| B | 6607 | 456 | 6.901771% |
| C | 6606 | 169 | 2.558280% |
| D | 6606 | 1725 | 26.112625% |
Noise dominated data is calculated using 1-second bins in cleaned event files. If a bin has >2000 counts, and if more than 50% of those come from <1% of pixels, then it is considered to be noise-dominated and hence unusable.
| Quadrant | # 1 sec bins | Bins with >0 counts | Bins with >2000 counts | High rate bins dominated by noise | Noise dominated (total time) | Noise dominated (detector-on time) | Marked lightcurve |
|---|---|---|---|---|---|---|---|
| A | 7612 | 6608 | 857 | 857 | 11.26% | 12.97% | 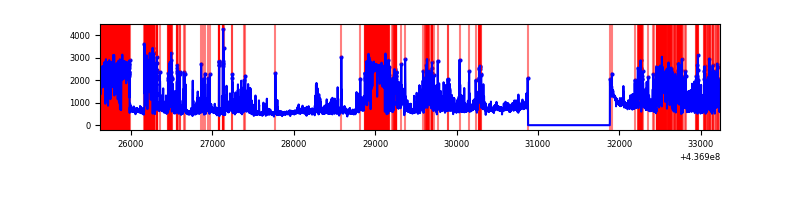 |
| B | 7612 | 6608 | 350 | 350 | 4.60% | 5.30% | 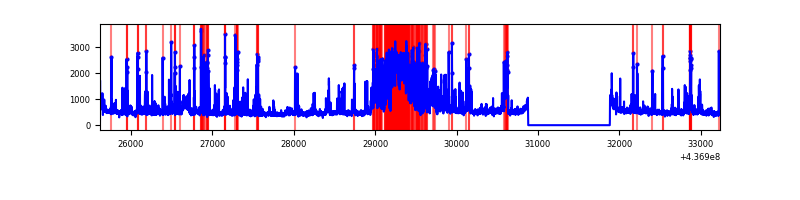 |
| C | 7610 | 6605 | 112 | 112 | 1.47% | 1.70% | 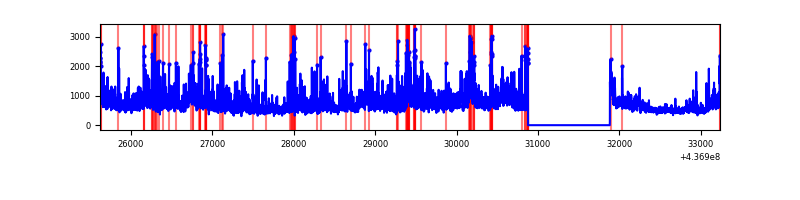 |
| D | 7611 | 6607 | 1609 | 1609 | 21.14% | 24.35% | 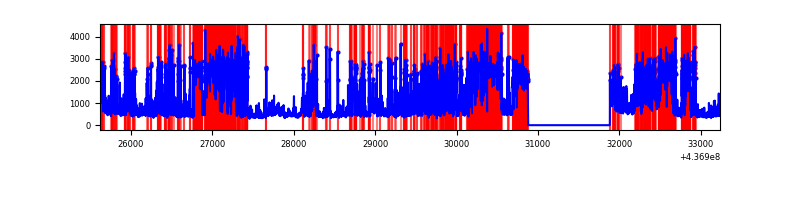 |
Top three noisy pixels from each quadrant. If the there are fewer than three noisy pixels in the level2.evt file, extra rows are filled as -1
| Pixel properties | Quadrant properties | ||||||
|---|---|---|---|---|---|---|---|
| Quadrant | DetID | PixID | Counts | Sigma | Mean | Median | Sigma |
| A | 15 | 223 | 3321535 | 22646.52 | 703 | 690 | 146.6 |
| A | 10 | 83 | 994633 | 6778.2 | 703 | 690 | 146.6 |
| A | 2 | 79 | 58152 | 391.86 | 703 | 690 | 146.6 |
| B | 0 | 200 | 1106754 | 7737.41 | 732 | 711 | 142.9 |
| B | 5 | 235 | 407265 | 2844.08 | 732 | 711 | 142.9 |
| B | 4 | 170 | 150727 | 1049.45 | 732 | 711 | 142.9 |
| C | 3 | 233 | 2199044 | 12842.54 | 729 | 732 | 171.2 |
| C | 14 | 254 | 90684 | 525.5 | 729 | 732 | 171.2 |
| C | 15 | 157 | 31949 | 182.37 | 729 | 732 | 171.2 |
| D | 5 | 235 | 3043685 | 18780.12 | 631 | 611 | 162.0 |
| D | 1 | 52 | 975695 | 6017.66 | 631 | 611 | 162.0 |
| D | 12 | 33 | 657306 | 4052.75 | 631 | 611 | 162.0 |
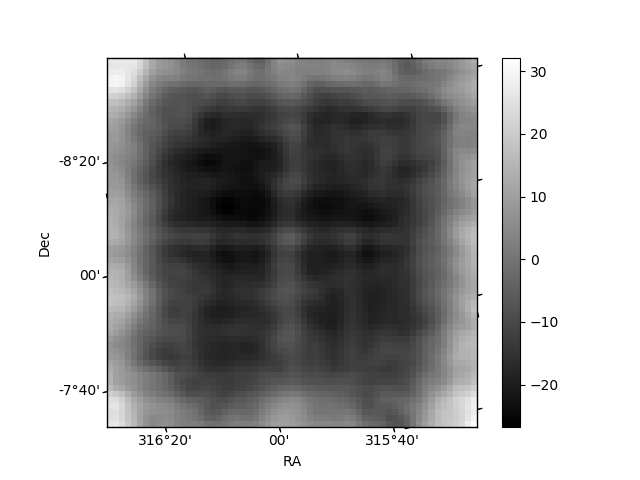
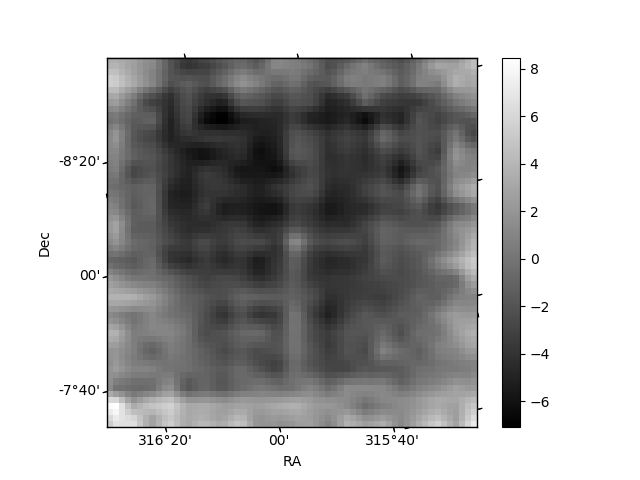
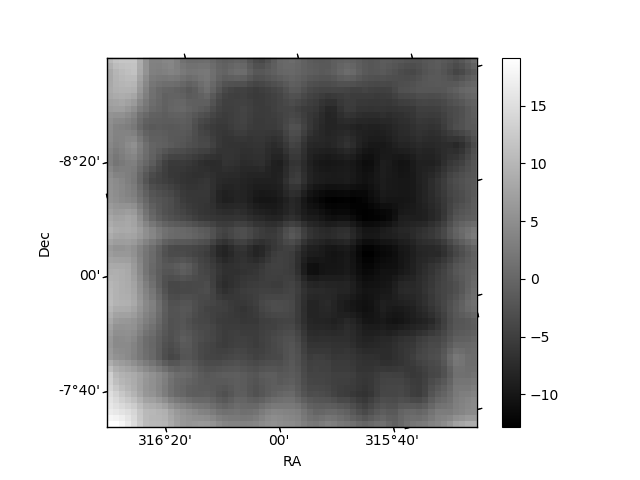
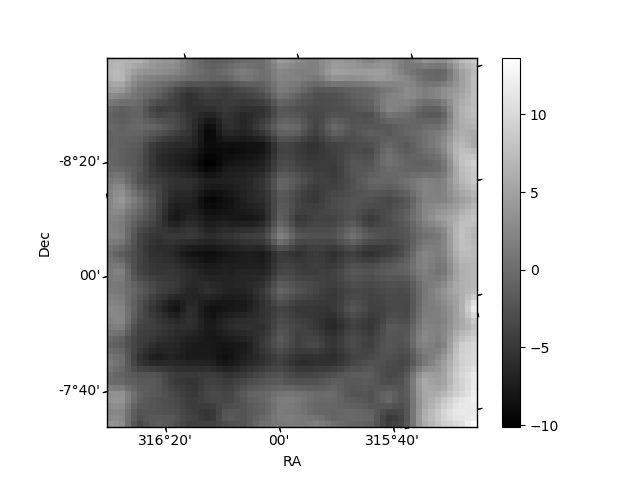
Histogram calculated using DETX and DETY for each event in the final _common_clean file
| Quadrant A | 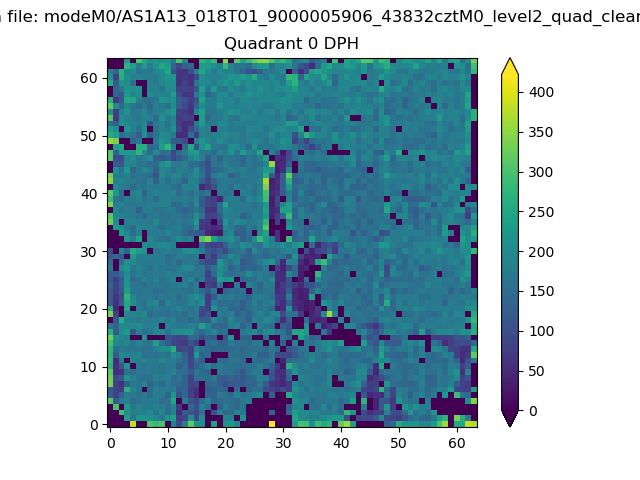 |
 |
Quadrant B |
|---|---|---|---|
| Quadrant D | 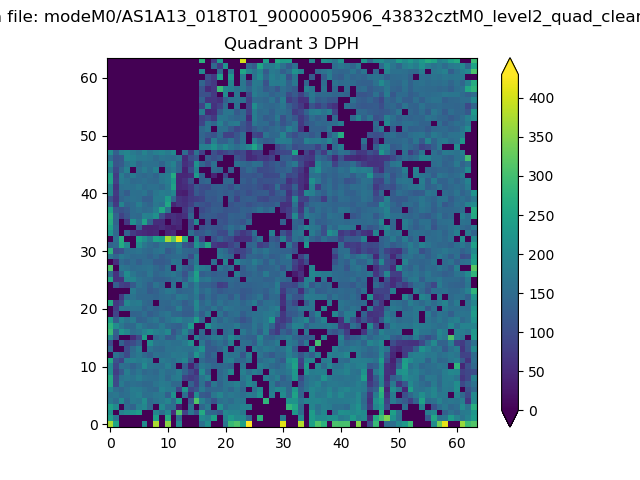 |
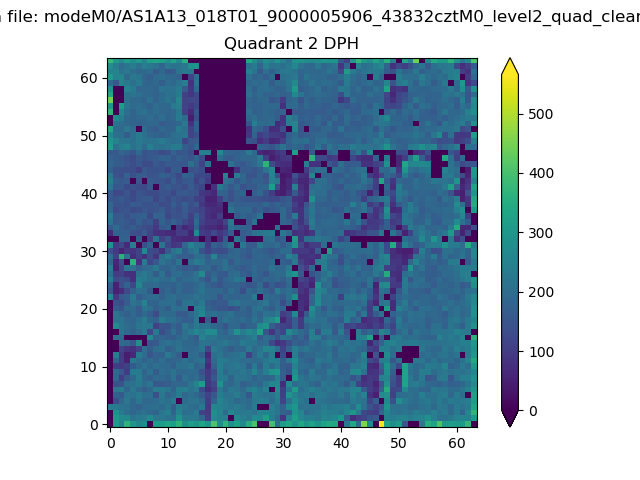 |
Quadrant C |
| Plot type | Count rate plots | Images |
|---|---|---|
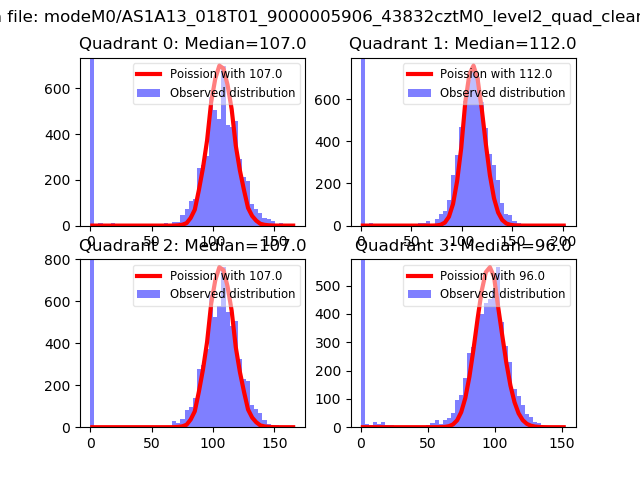
| Comparison with Poisson distribution Blue bars denote a histogram of data divided into 1 sec bins. Red curve is a Poisson curve with rate = median count rate of data. |
 |
 |
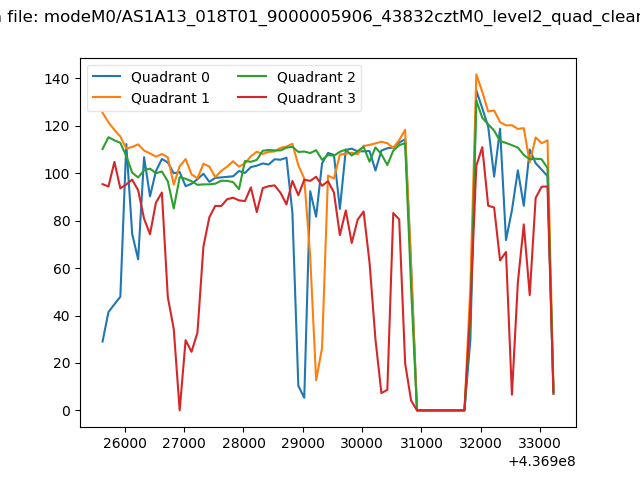
| Quadrant-wise count rates Data is divided into 100 sec bins |
 |
|
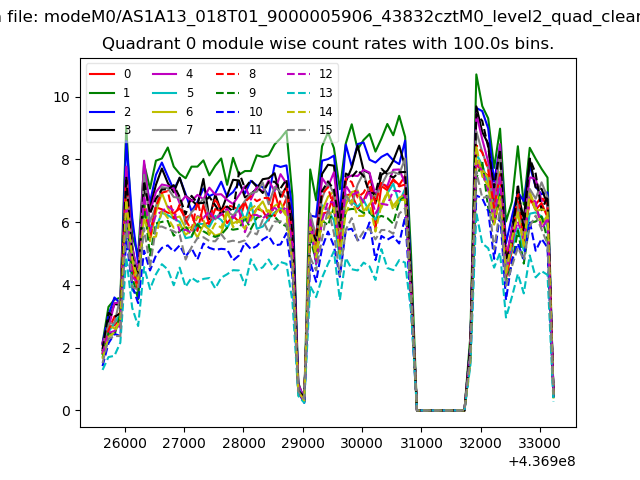
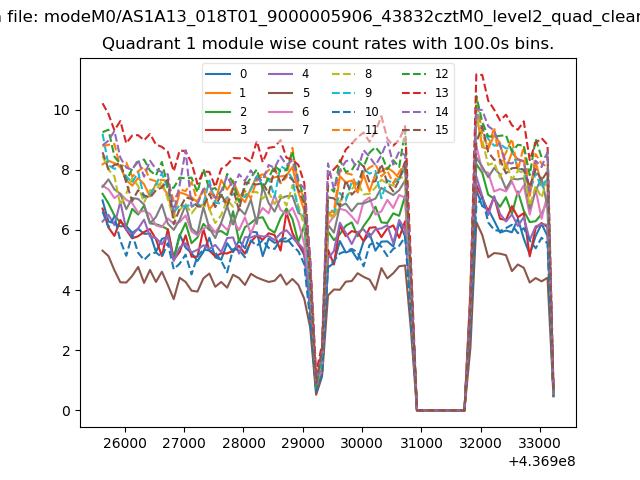
| Module-wise count rates for Quadrant A Data is divided into 100 sec bins |
 |
 |
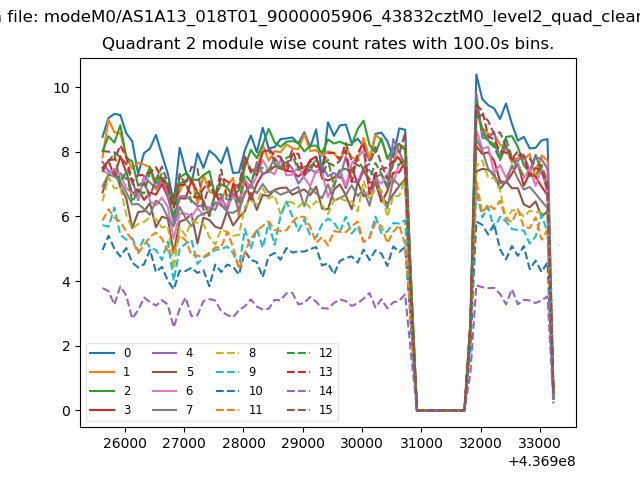
| Module-wise count rates for Quadrant B Data is divided into 100 sec bins |
 |
 |
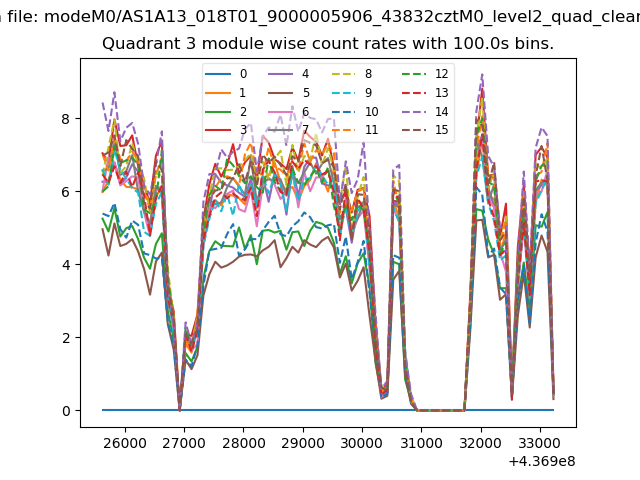
| Module-wise count rates for Quadrant C Data is divided into 100 sec bins |
 |
 |
| Module-wise count rates for Quadrant D Data is divided into 100 sec bins |
 |
 |
| Parameter | Plot |
|---|---|
| CZT HV Monitor | 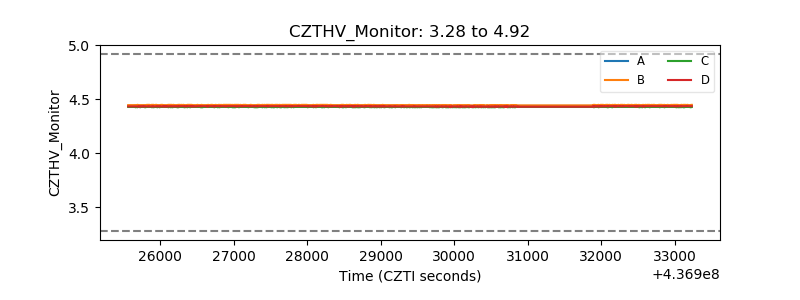 |
| D_VDD | 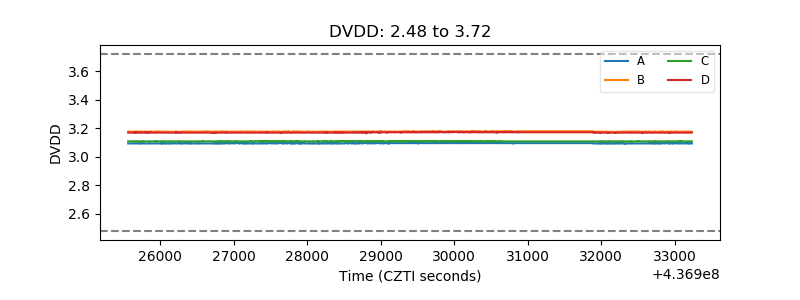 |
| Temperature 1 | 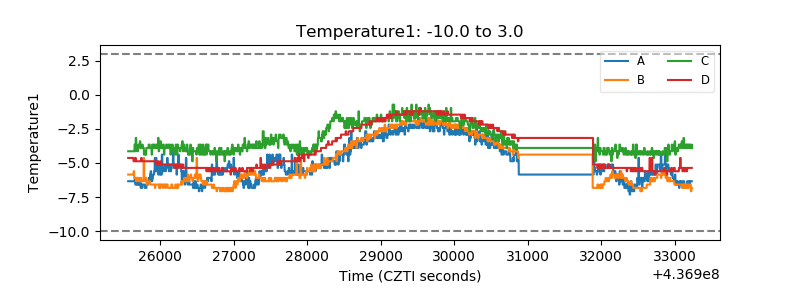 |
| Veto HV Monitor | 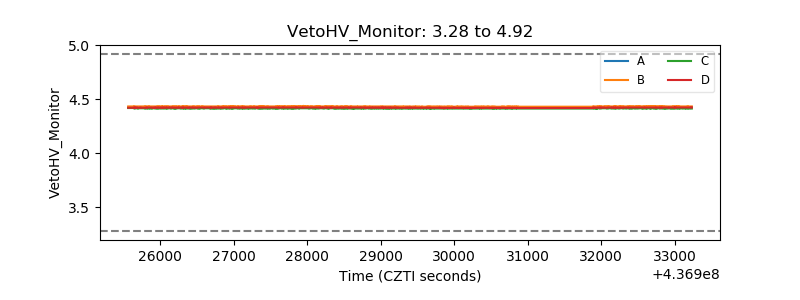 |
| Veto LLD | 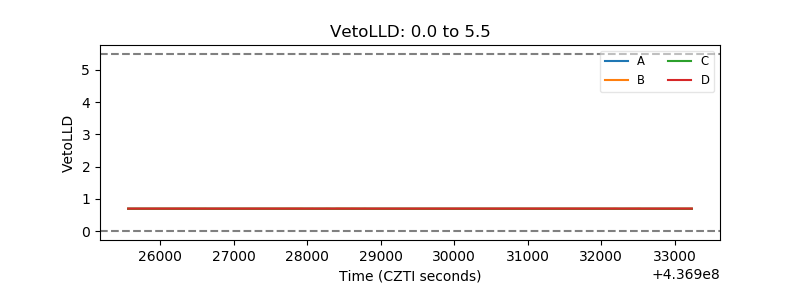 |
| Alpha Counter | 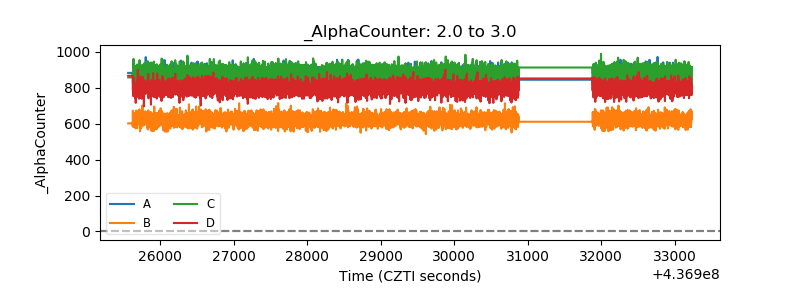 |
| _CPM_Rate | 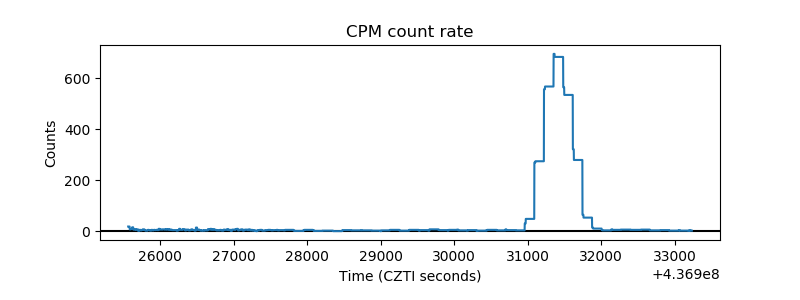 |
| CZT Counter | 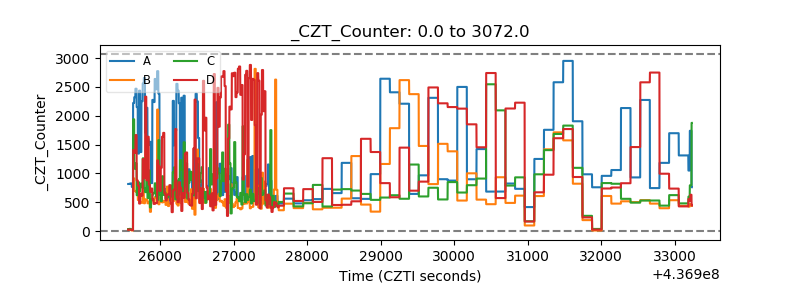 |
| +2.5 Volts monitor | 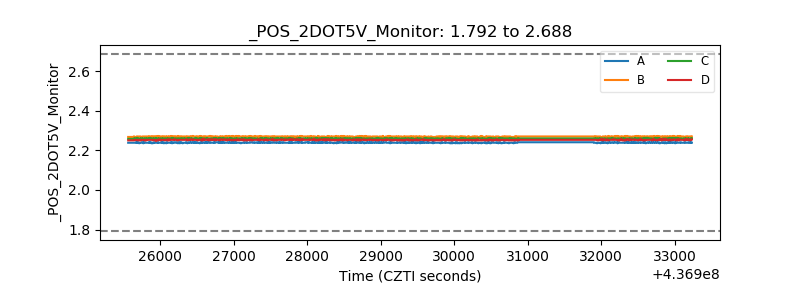 |
| +5 Volts monitor | 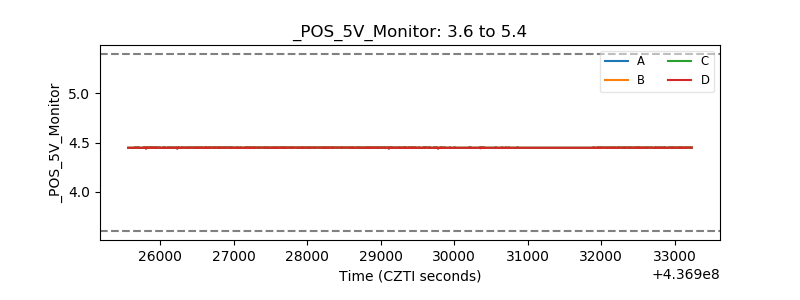 |
| _ROLL_ROT | 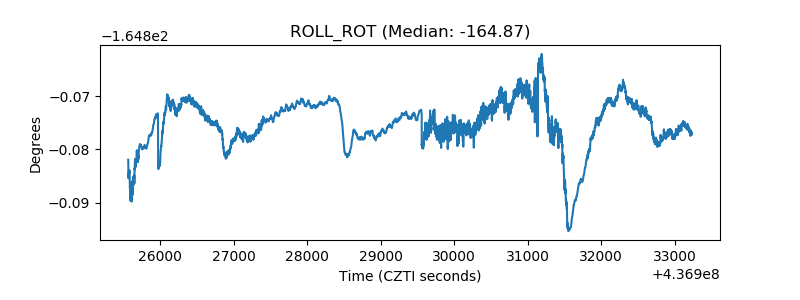 |
| _Roll_DEC | 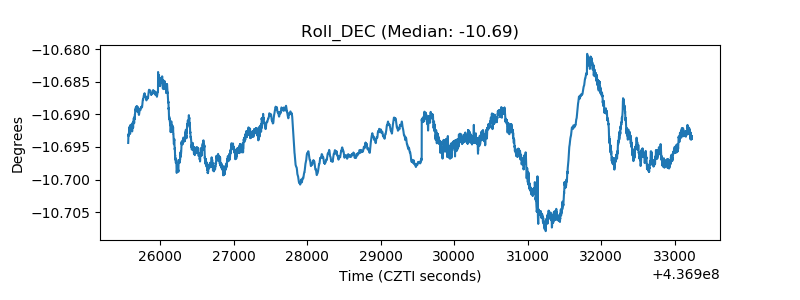 |
| _Roll_RA | 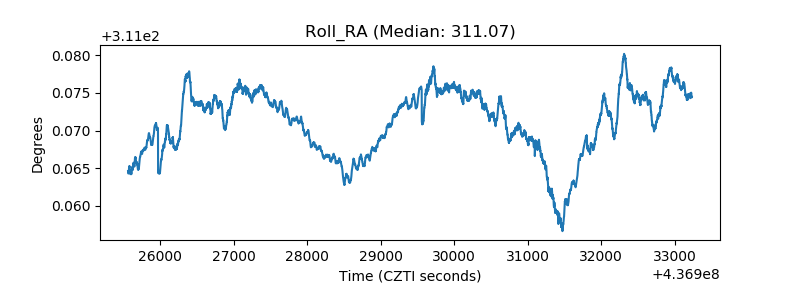 |
| Veto Counter | 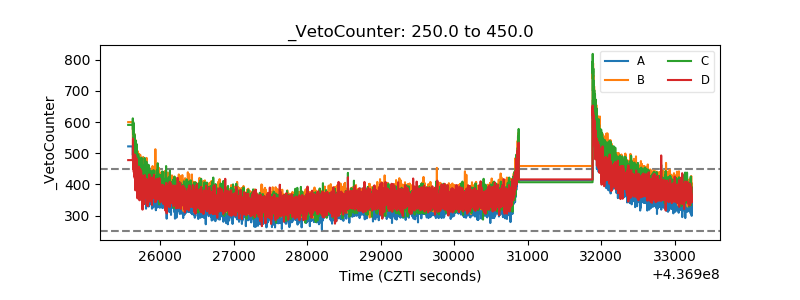 |