| Param | Original file | Final file |
|---|---|---|
| Filename | modeM0/AS1A13_018T01_9000005906_43834cztM0_level2.fits | modeM0/AS1A13_018T01_9000005906_43834cztM0_level2_quad_clean.evt |
| Size (bytes) | 639,095,040 | 100,114,560 |
| Size | 609.5 MB | 95.5 MB |
| Events in quadrant A | 5,782,059 | 679,595 |
| Events in quadrant B | 5,855,135 | 660,767 |
| Events in quadrant C | 4,524,419 | 700,707 |
| Events in quadrant D | 7,009,077 | 551,225 |
| Mode M0 | |||
|---|---|---|---|
| Quadrant | BADHDUFLAG | Total packets | Discarded packets |
| A | 0 | 21767 | 4 |
| B | 0 | 21573 | 1 |
| C | 0 | 17650 | 1 |
| D | 0 | 25202 | 1 |
| Mode SS | |||
|---|---|---|---|
| Quadrant | BADHDUFLAG | Total packets | Discarded packets |
| A | 0 | 128 | 0 |
| B | 0 | 128 | 0 |
| C | 0 | 128 | 0 |
| D | 0 | 128 | 0 |
| Mode M9 | |||
|---|---|---|---|
| Quadrant | BADHDUFLAG | Total packets | Discarded packets |
| A | 0 | 11 | 0 |
| B | 0 | 11 | 0 |
| C | 0 | 11 | 0 |
| D | 0 | 11 | 0 |
| Quadrant | Total seconds | Saturated seconds | Saturation percentage |
|---|---|---|---|
| A | 6286 | 501 | 7.970092% |
| B | 6287 | 888 | 14.124384% |
| C | 6287 | 153 | 2.433593% |
| D | 6287 | 1114 | 17.719103% |
Noise dominated data is calculated using 1-second bins in cleaned event files. If a bin has >2000 counts, and if more than 50% of those come from <1% of pixels, then it is considered to be noise-dominated and hence unusable.
| Quadrant | # 1 sec bins | Bins with >0 counts | Bins with >2000 counts | High rate bins dominated by noise | Noise dominated (total time) | Noise dominated (detector-on time) | Marked lightcurve |
|---|---|---|---|---|---|---|---|
| A | 7361 | 6286 | 333 | 333 | 4.52% | 5.30% | 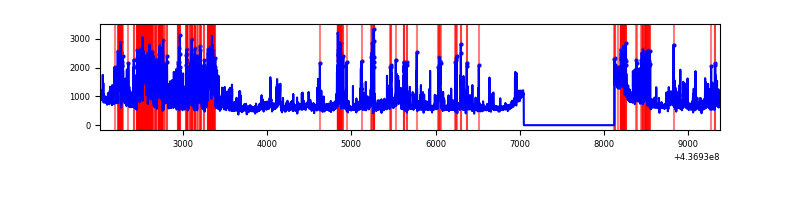 |
| B | 7362 | 6287 | 707 | 707 | 9.60% | 11.25% | 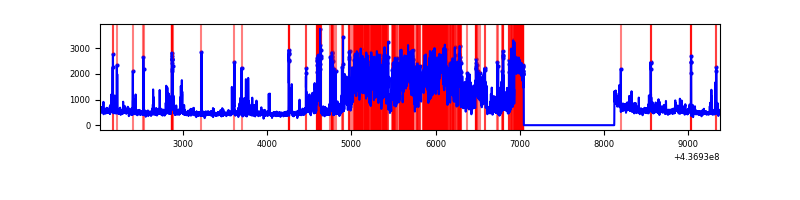 |
| C | 7362 | 6287 | 58 | 58 | 0.79% | 0.92% | 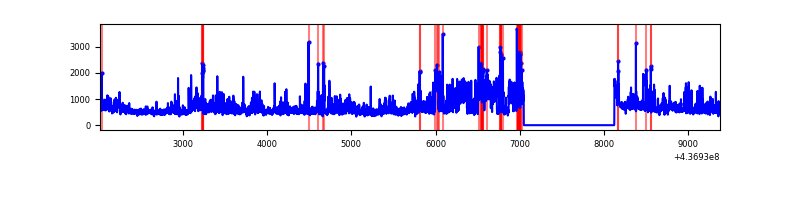 |
| D | 7362 | 6287 | 1028 | 1028 | 13.96% | 16.35% | 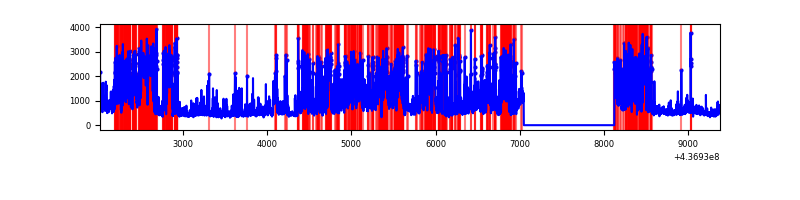 |
Top three noisy pixels from each quadrant. If the there are fewer than three noisy pixels in the level2.evt file, extra rows are filled as -1
| Pixel properties | Quadrant properties | ||||||
|---|---|---|---|---|---|---|---|
| Quadrant | DetID | PixID | Counts | Sigma | Mean | Median | Sigma |
| A | 15 | 223 | 1644218 | 10975.67 | 723 | 709 | 149.7 |
| A | 10 | 83 | 949954 | 6339.24 | 723 | 709 | 149.7 |
| A | 2 | 79 | 254801 | 1696.87 | 723 | 709 | 149.7 |
| B | 0 | 200 | 2142390 | 15536.46 | 703 | 684 | 137.9 |
| B | 5 | 235 | 325751 | 2358.12 | 703 | 684 | 137.9 |
| B | 4 | 170 | 207202 | 1498.13 | 703 | 684 | 137.9 |
| C | 3 | 233 | 1575605 | 9209.25 | 720 | 725 | 171.0 |
| C | 15 | 158 | 64861 | 375.04 | 720 | 725 | 171.0 |
| C | 14 | 254 | 44595 | 256.53 | 720 | 725 | 171.0 |
| D | 12 | 33 | 1556600 | 9223.65 | 665 | 643 | 168.7 |
| D | 5 | 235 | 1454433 | 8618.0 | 665 | 643 | 168.7 |
| D | 1 | 52 | 927244 | 5492.85 | 665 | 643 | 168.7 |
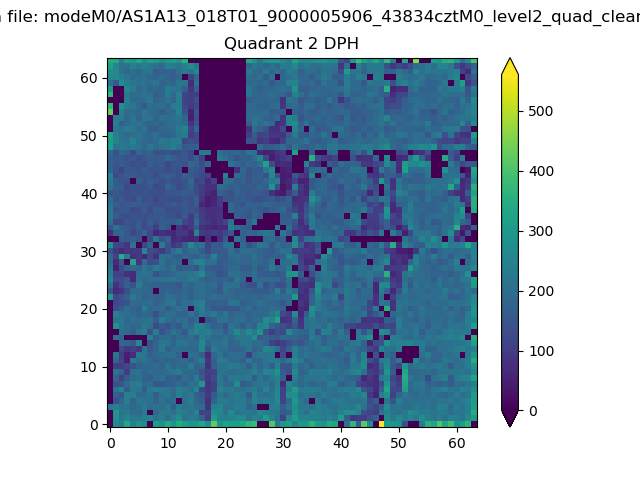
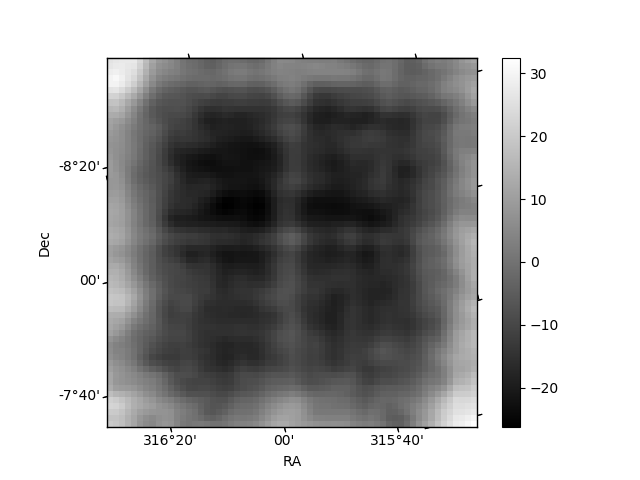
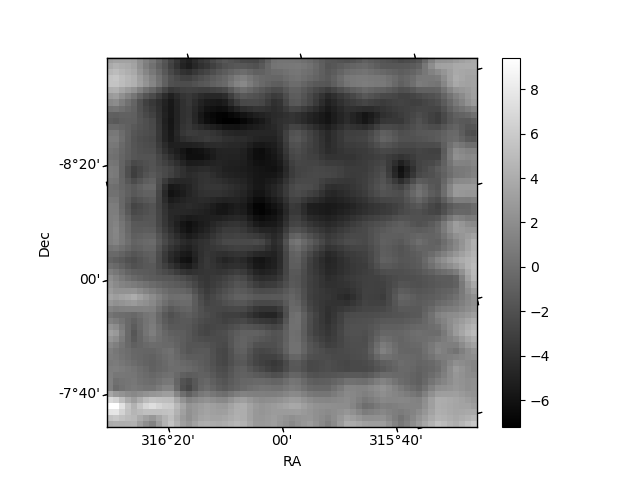
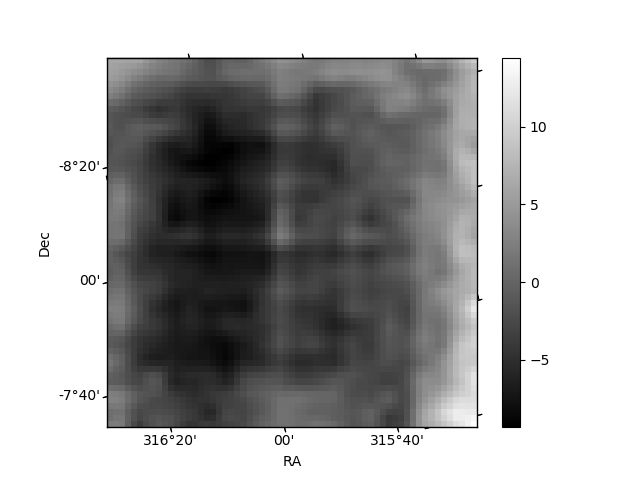
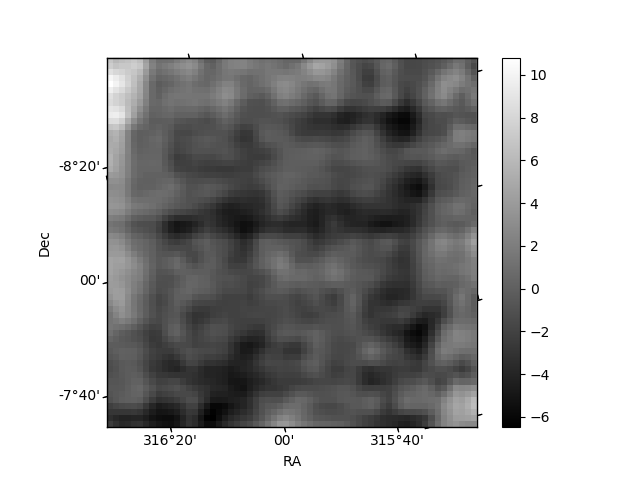
Histogram calculated using DETX and DETY for each event in the final _common_clean file
| Quadrant A | 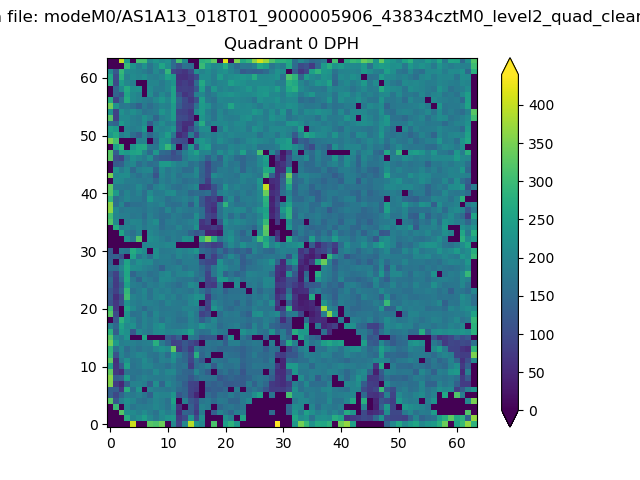 |
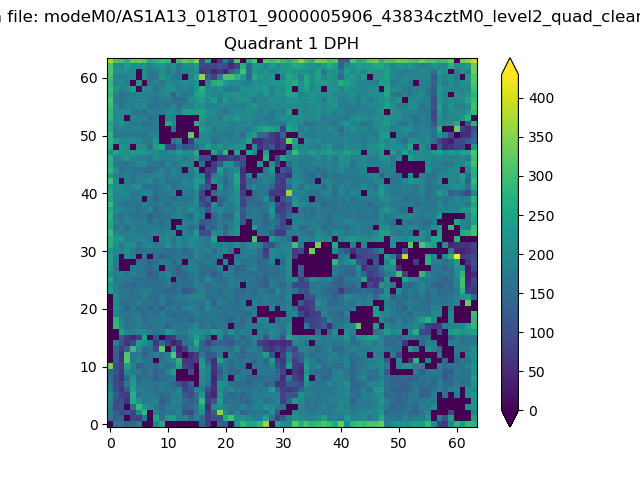 |
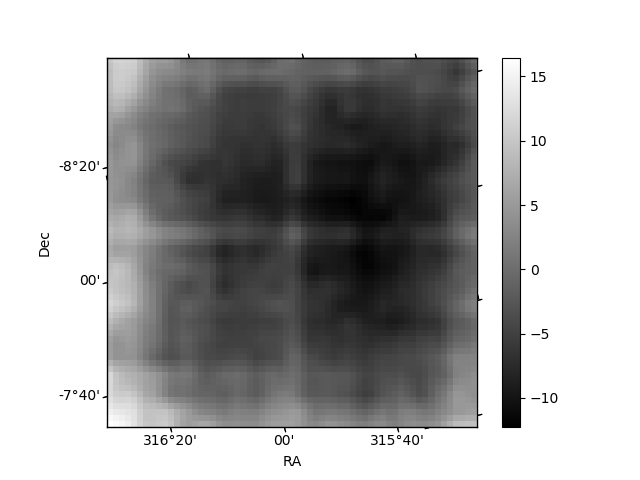
Quadrant B |
|---|---|---|---|
| Quadrant D | 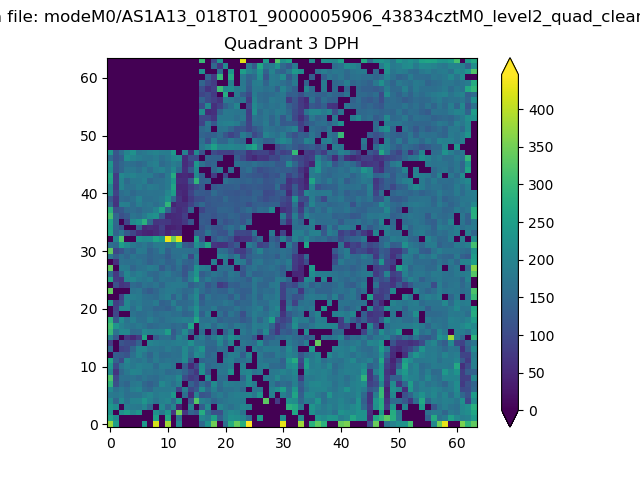 |
 |
Quadrant C |
| Plot type | Count rate plots | Images |
|---|---|---|
| Comparison with Poisson distribution Blue bars denote a histogram of data divided into 1 sec bins. Red curve is a Poisson curve with rate = median count rate of data. |
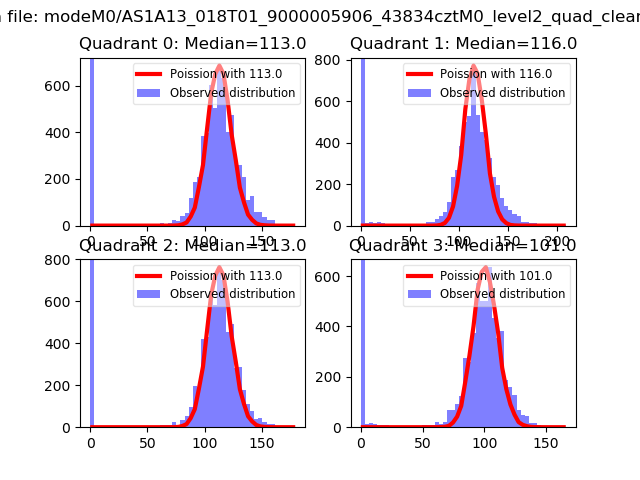 |
 |
| Quadrant-wise count rates Data is divided into 100 sec bins |
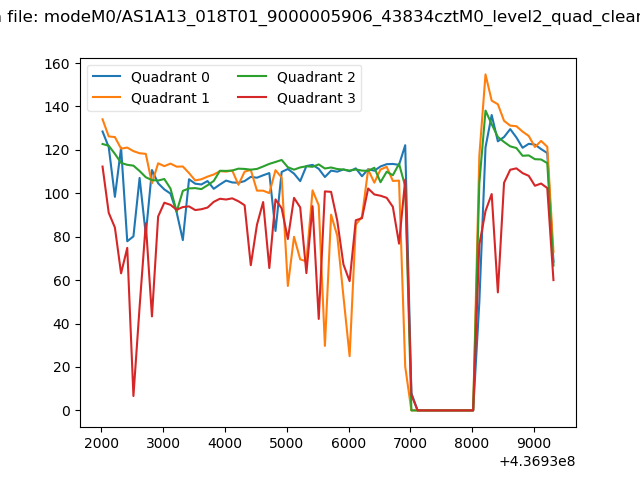 |
|
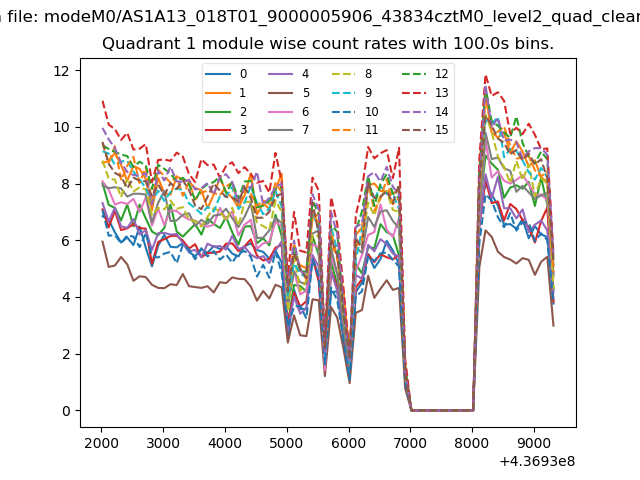
| Module-wise count rates for Quadrant A Data is divided into 100 sec bins |
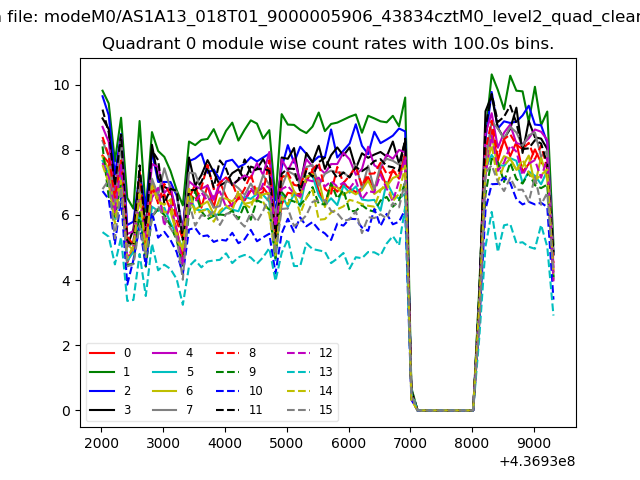 |
 |
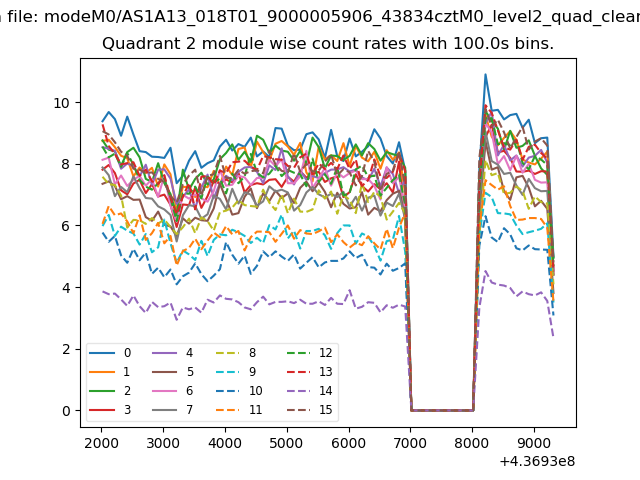
| Module-wise count rates for Quadrant B Data is divided into 100 sec bins |
 |
 |
| Module-wise count rates for Quadrant C Data is divided into 100 sec bins |
 |
 |
| Module-wise count rates for Quadrant D Data is divided into 100 sec bins |
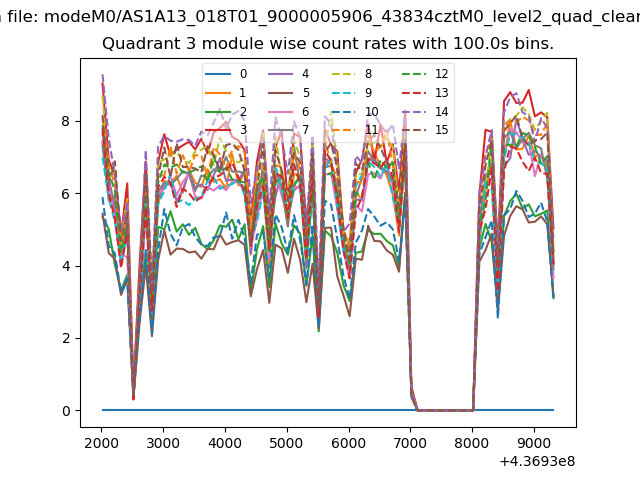 |
 |
| Parameter | Plot |
|---|---|
| CZT HV Monitor | 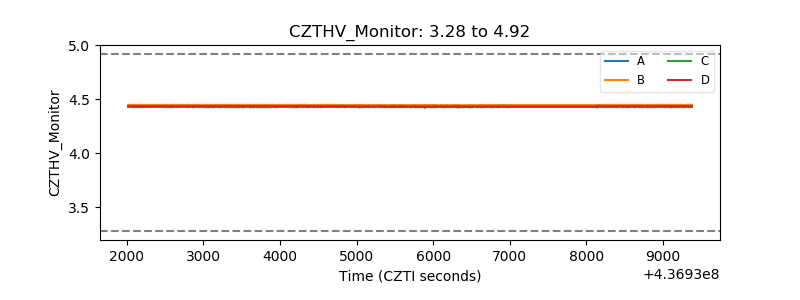 |
| D_VDD | 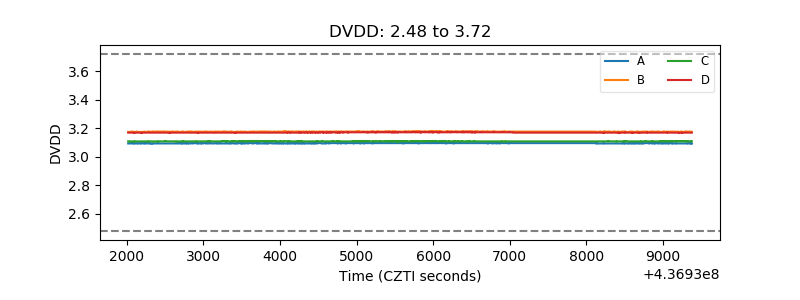 |
| Temperature 1 | 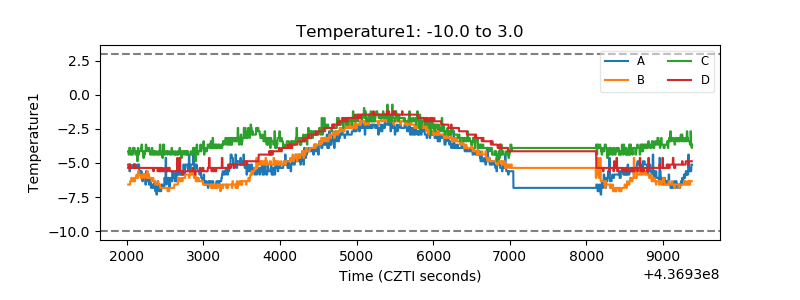 |
| Veto HV Monitor | 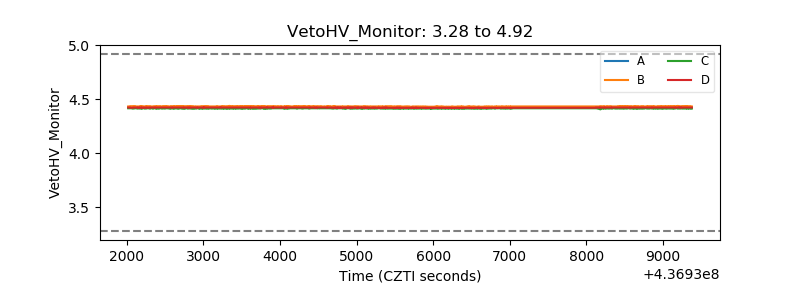 |
| Veto LLD | 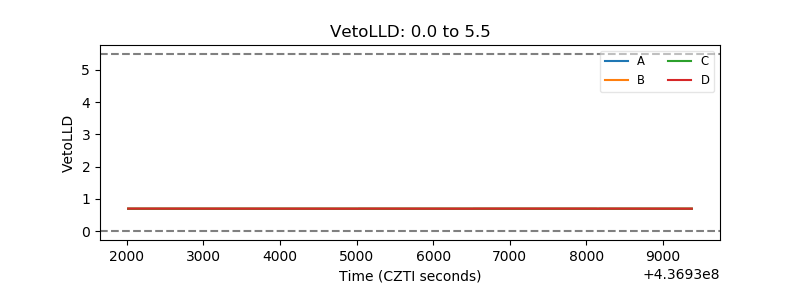 |
| Alpha Counter | 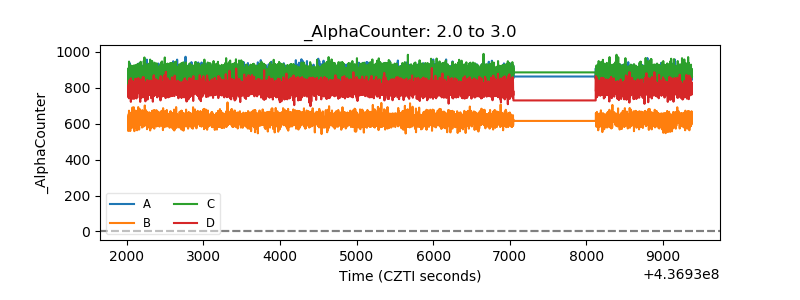 |
| _CPM_Rate | 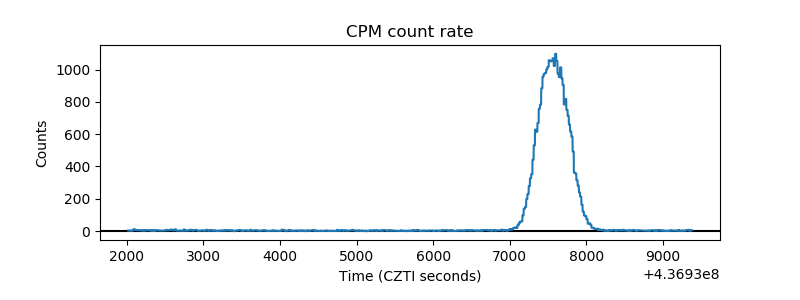 |
| CZT Counter | 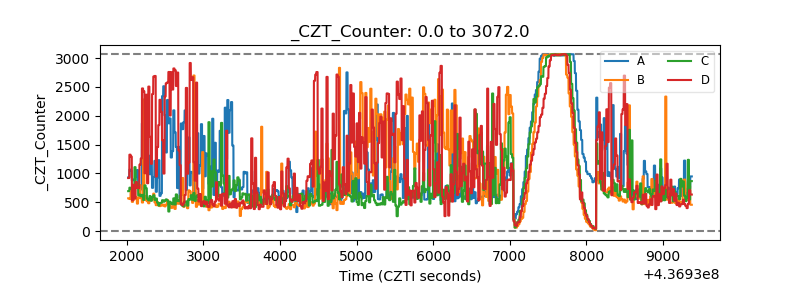 |
| +2.5 Volts monitor | 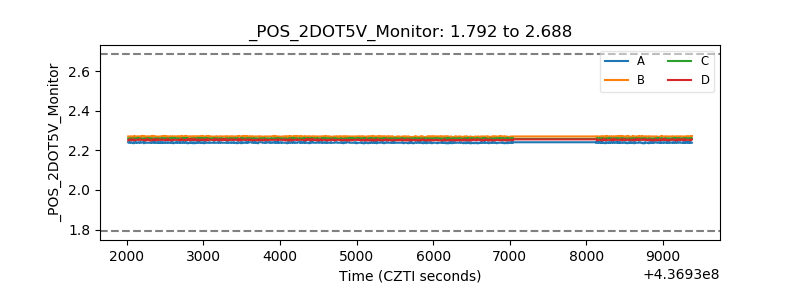 |
| +5 Volts monitor | 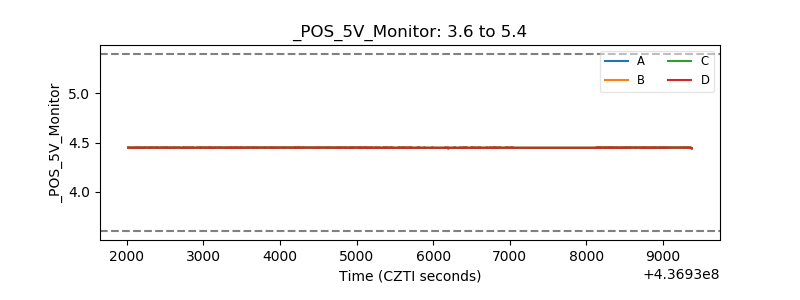 |
| _ROLL_ROT | 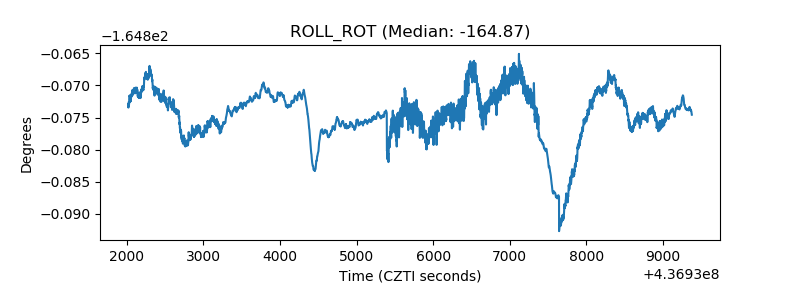 |
| _Roll_DEC | 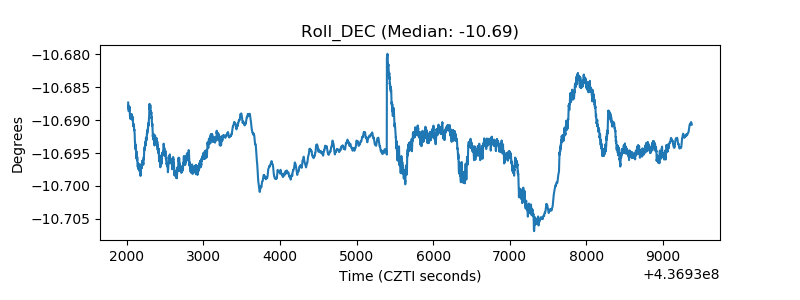 |
| _Roll_RA | 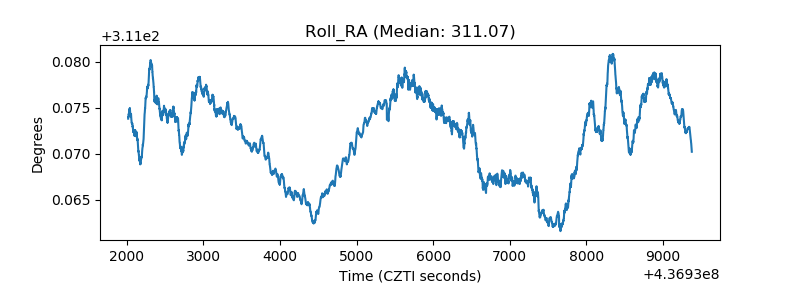 |
| Veto Counter | 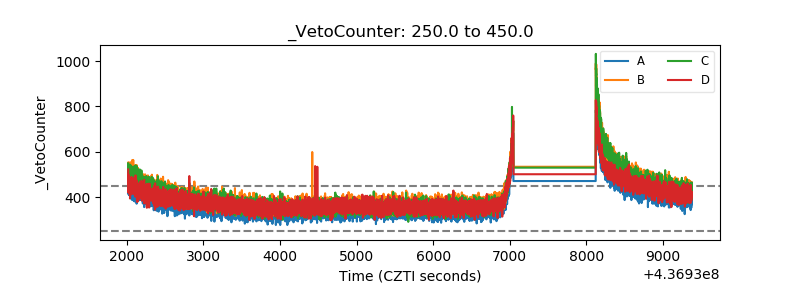 |