| Param | Original file | Final file |
|---|---|---|
| Filename | modeM0/AS1A13_018T01_9000005906_43835cztM0_level2.fits | modeM0/AS1A13_018T01_9000005906_43835cztM0_level2_quad_clean.evt |
| Size (bytes) | 570,646,080 | 107,052,480 |
| Size | 544.2 MB | 102.1 MB |
| Events in quadrant A | 5,072,835 | 724,988 |
| Events in quadrant B | 3,977,214 | 761,978 |
| Events in quadrant C | 5,707,523 | 719,960 |
| Events in quadrant D | 5,886,916 | 603,069 |
| Mode M0 | |||
|---|---|---|---|
| Quadrant | BADHDUFLAG | Total packets | Discarded packets |
| A | 0 | 19635 | 1 |
| B | 0 | 15778 | 1 |
| C | 0 | 21326 | 1 |
| D | 0 | 21603 | 1 |
| Mode SS | |||
|---|---|---|---|
| Quadrant | BADHDUFLAG | Total packets | Discarded packets |
| A | 0 | 124 | 0 |
| B | 0 | 124 | 0 |
| C | 0 | 124 | 0 |
| D | 0 | 124 | 0 |
| Mode M9 | |||
|---|---|---|---|
| Quadrant | BADHDUFLAG | Total packets | Discarded packets |
| A | 0 | 12 | 0 |
| B | 0 | 12 | 0 |
| C | 0 | 12 | 0 |
| D | 0 | 12 | 0 |
| Quadrant | Total seconds | Saturated seconds | Saturation percentage |
|---|---|---|---|
| A | 6188 | 301 | 4.864253% |
| B | 6188 | 229 | 3.700711% |
| C | 6188 | 288 | 4.654169% |
| D | 6189 | 816 | 13.184683% |
Noise dominated data is calculated using 1-second bins in cleaned event files. If a bin has >2000 counts, and if more than 50% of those come from <1% of pixels, then it is considered to be noise-dominated and hence unusable.
| Quadrant | # 1 sec bins | Bins with >0 counts | Bins with >2000 counts | High rate bins dominated by noise | Noise dominated (total time) | Noise dominated (detector-on time) | Marked lightcurve |
|---|---|---|---|---|---|---|---|
| A | 7358 | 6188 | 151 | 151 | 2.05% | 2.44% | 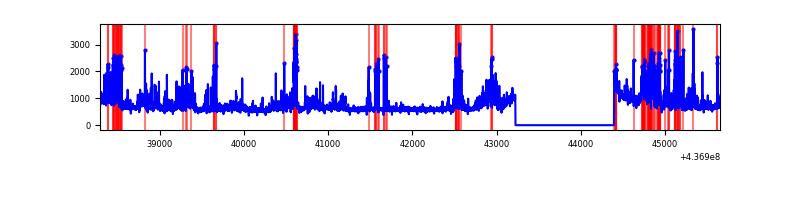 |
| B | 7358 | 6188 | 120 | 120 | 1.63% | 1.94% | 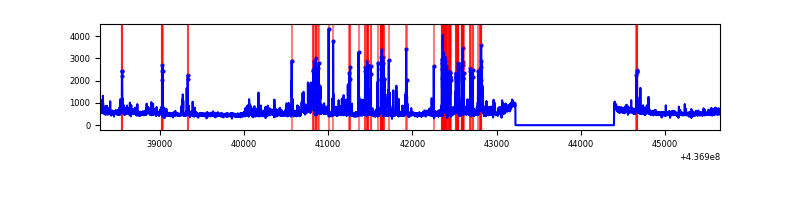 |
| C | 7358 | 6188 | 150 | 150 | 2.04% | 2.42% | 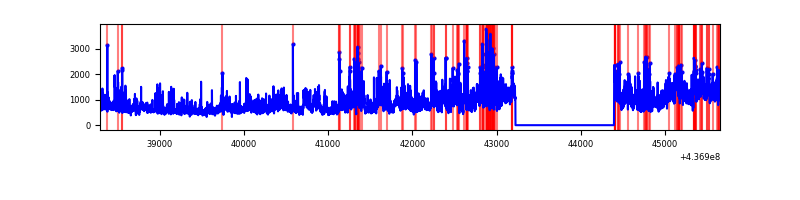 |
| D | 7359 | 6189 | 746 | 746 | 10.14% | 12.05% | 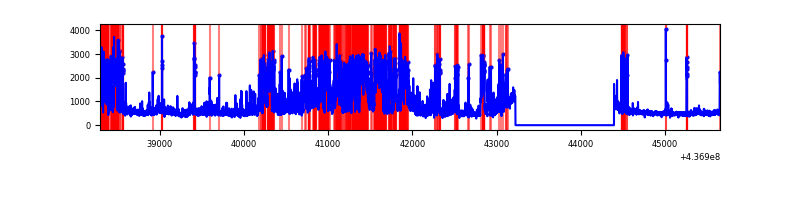 |
Top three noisy pixels from each quadrant. If the there are fewer than three noisy pixels in the level2.evt file, extra rows are filled as -1
| Pixel properties | Quadrant properties | ||||||
|---|---|---|---|---|---|---|---|
| Quadrant | DetID | PixID | Counts | Sigma | Mean | Median | Sigma |
| A | 15 | 223 | 966963 | 6317.6 | 745 | 732 | 152.9 |
| A | 10 | 83 | 953962 | 6232.59 | 745 | 732 | 152.9 |
| A | 2 | 79 | 116266 | 755.41 | 745 | 732 | 152.9 |
| B | 0 | 200 | 273881 | 1884.53 | 746 | 724 | 144.9 |
| B | 4 | 170 | 248587 | 1710.02 | 746 | 724 | 144.9 |
| B | 5 | 235 | 156574 | 1075.22 | 746 | 724 | 144.9 |
| C | 3 | 233 | 2660242 | 15593.5 | 727 | 731 | 170.6 |
| C | 15 | 158 | 138311 | 806.67 | 727 | 731 | 170.6 |
| C | 15 | 157 | 39755 | 228.81 | 727 | 731 | 170.6 |
| D | 12 | 33 | 1547905 | 8824.01 | 699 | 679 | 175.3 |
| D | 5 | 235 | 494238 | 2814.82 | 699 | 679 | 175.3 |
| D | 1 | 52 | 369642 | 2104.24 | 699 | 679 | 175.3 |
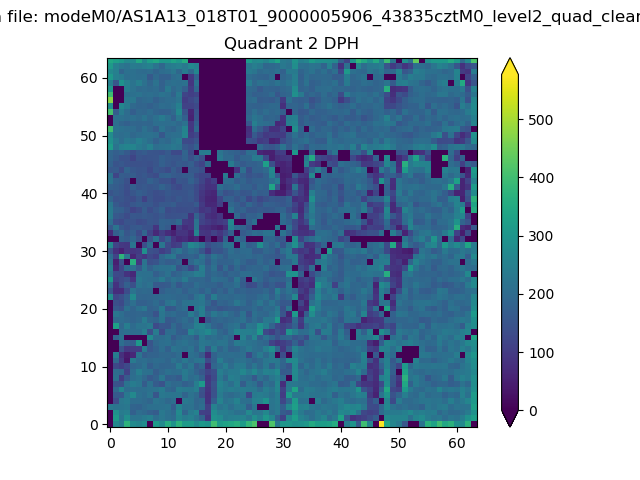
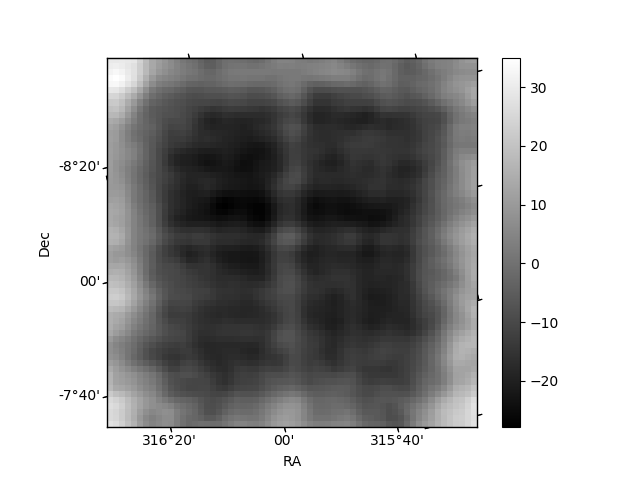
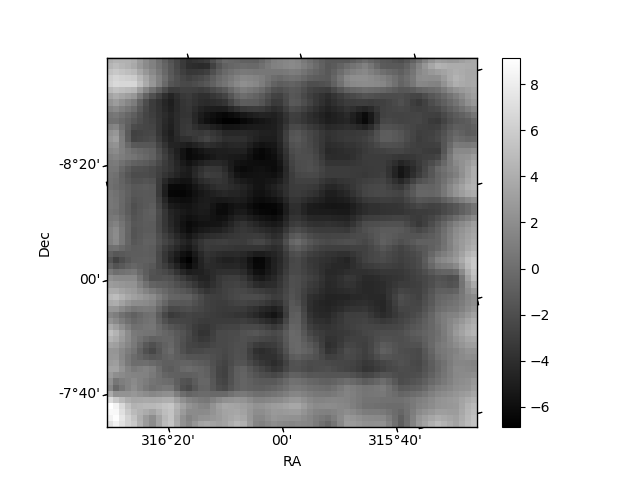
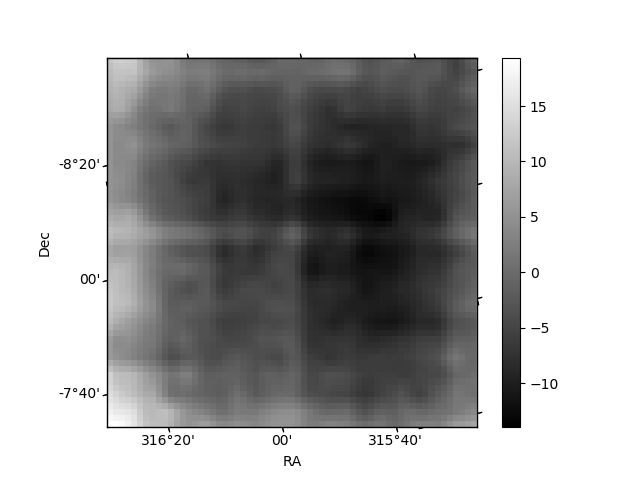
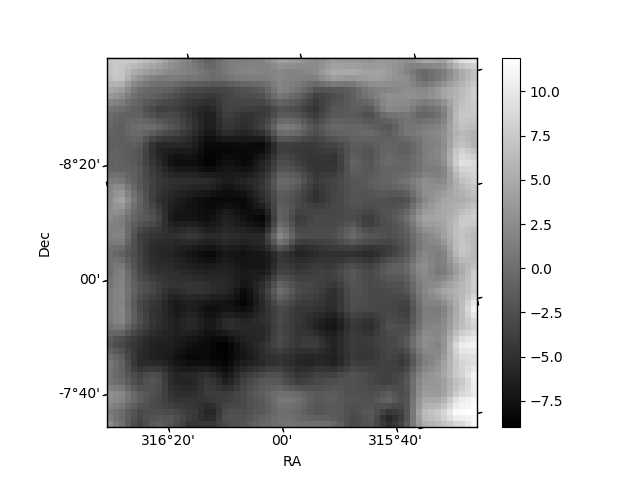
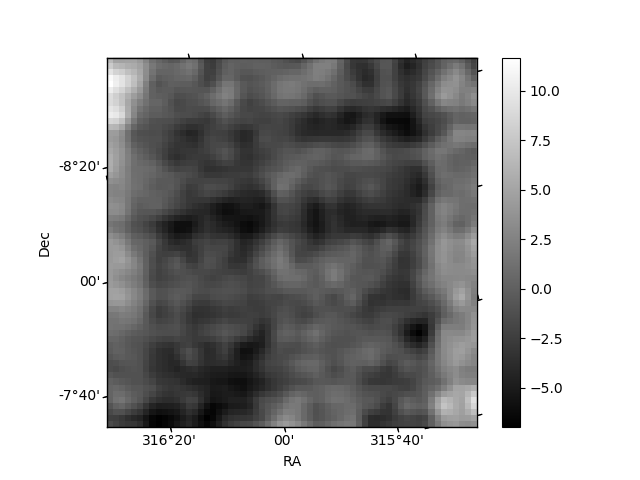
Histogram calculated using DETX and DETY for each event in the final _common_clean file
| Quadrant A | 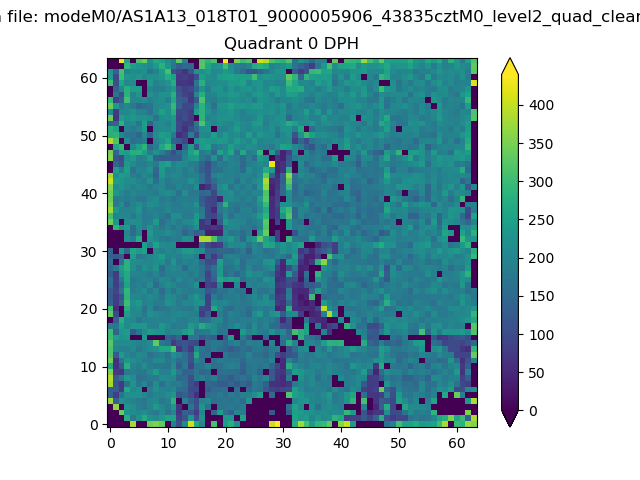 |
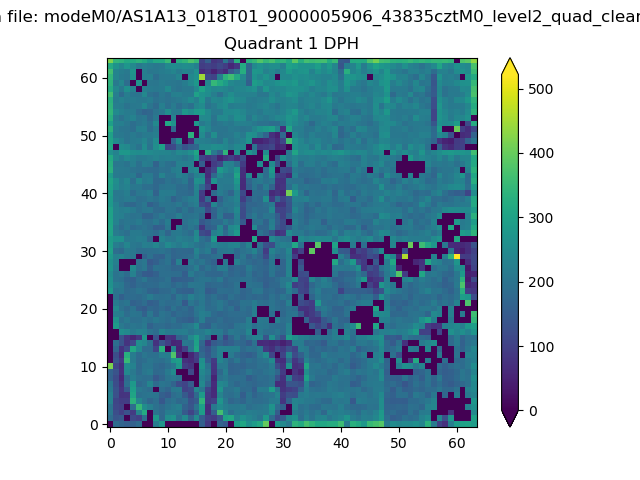 |
Quadrant B |
|---|---|---|---|
| Quadrant D | 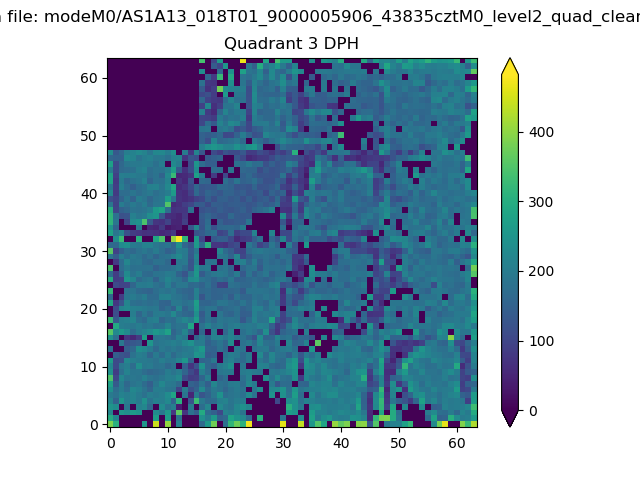 |
 |
Quadrant C |
| Plot type | Count rate plots | Images |
|---|---|---|
| Comparison with Poisson distribution Blue bars denote a histogram of data divided into 1 sec bins. Red curve is a Poisson curve with rate = median count rate of data. |
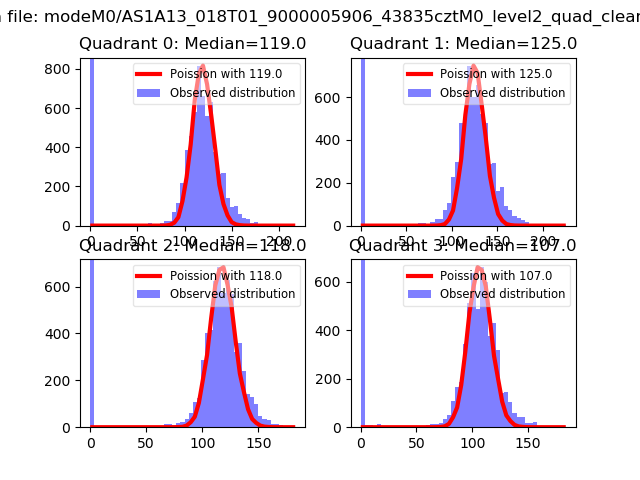 |
 |
| Quadrant-wise count rates Data is divided into 100 sec bins |
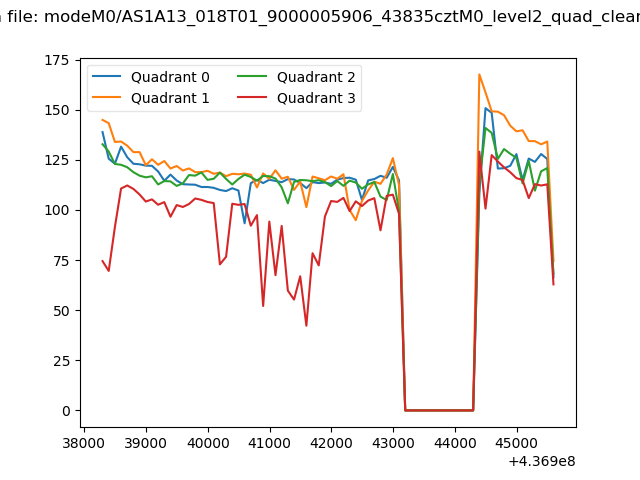 |
|
| Module-wise count rates for Quadrant A Data is divided into 100 sec bins |
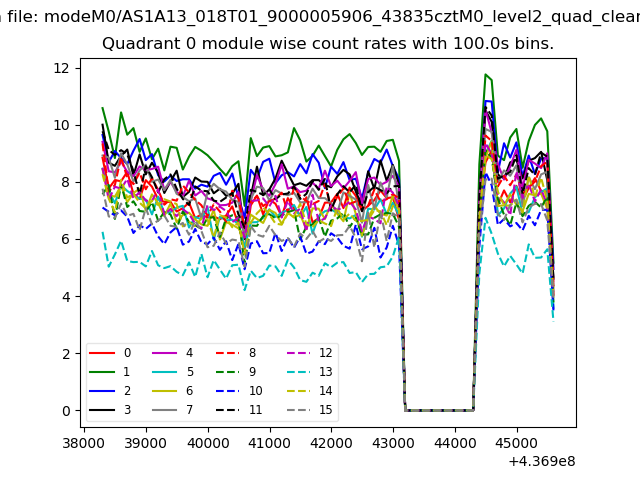 |
 |
| Module-wise count rates for Quadrant B Data is divided into 100 sec bins |
 |
 |
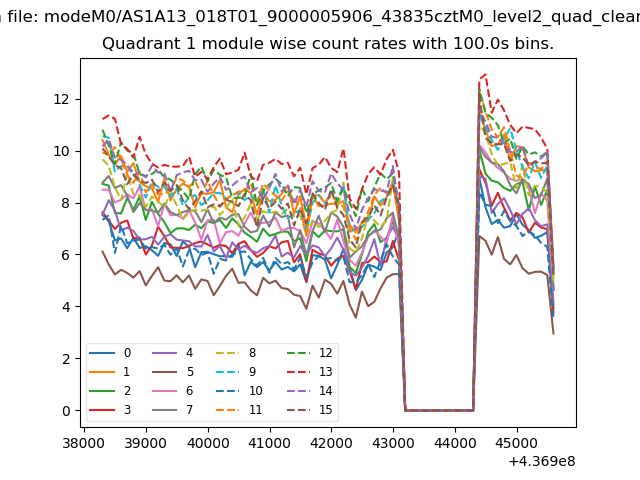
| Module-wise count rates for Quadrant C Data is divided into 100 sec bins |
 |
 |
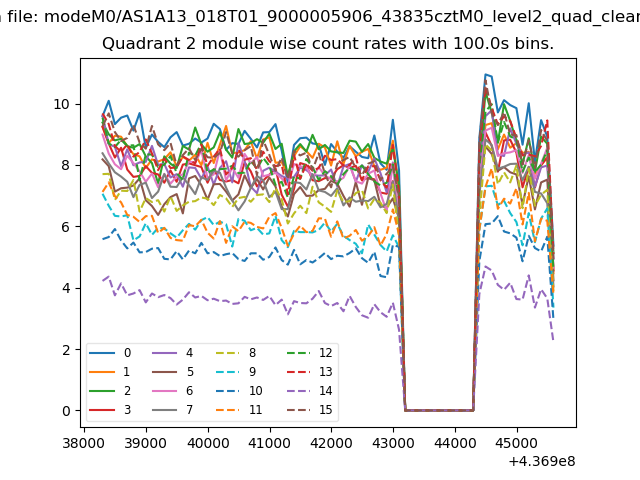
| Module-wise count rates for Quadrant D Data is divided into 100 sec bins |
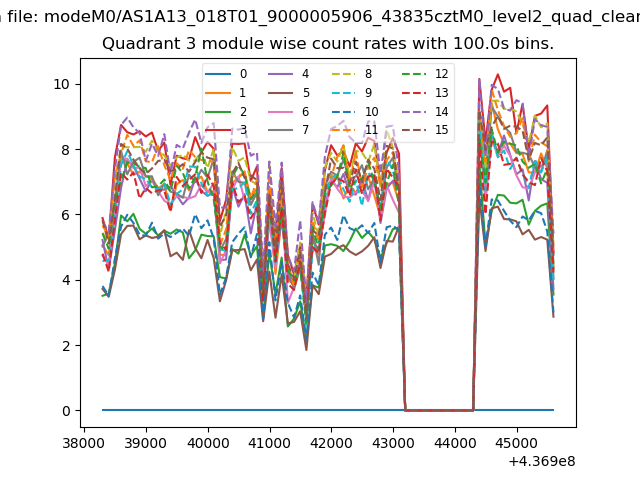 |
 |
| Parameter | Plot |
|---|---|
| CZT HV Monitor | 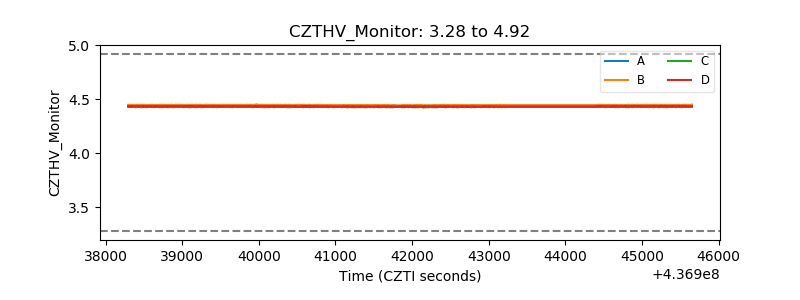 |
| D_VDD | 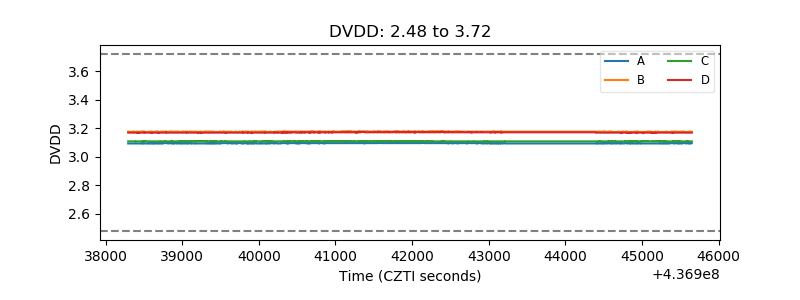 |
| Temperature 1 | 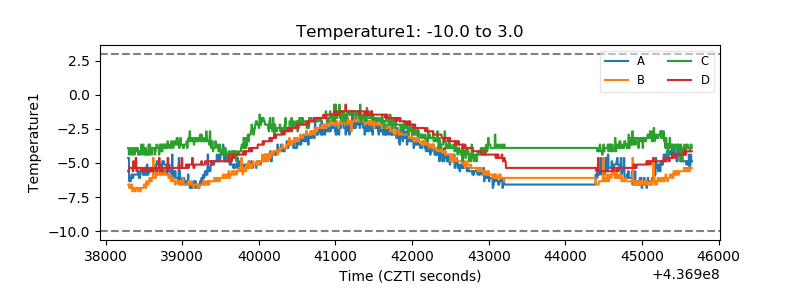 |
| Veto HV Monitor | 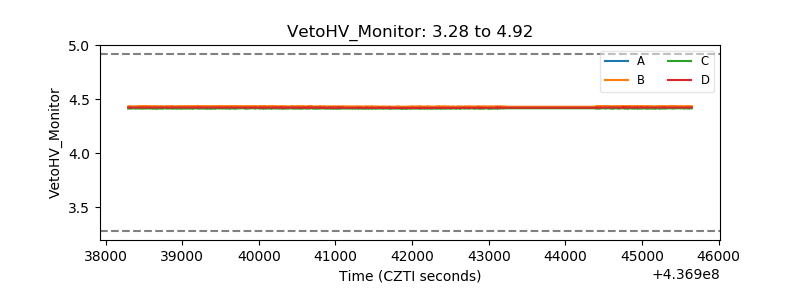 |
| Veto LLD | 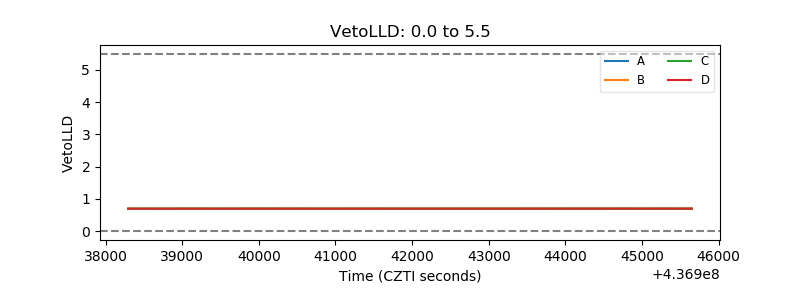 |
| Alpha Counter | 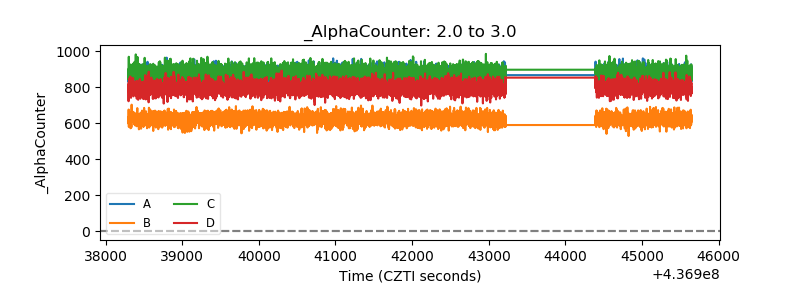 |
| _CPM_Rate | 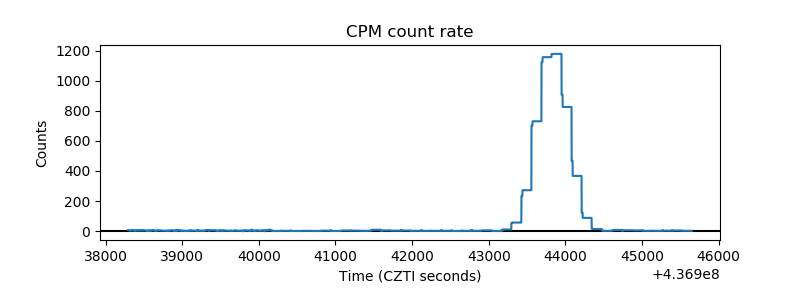 |
| CZT Counter | 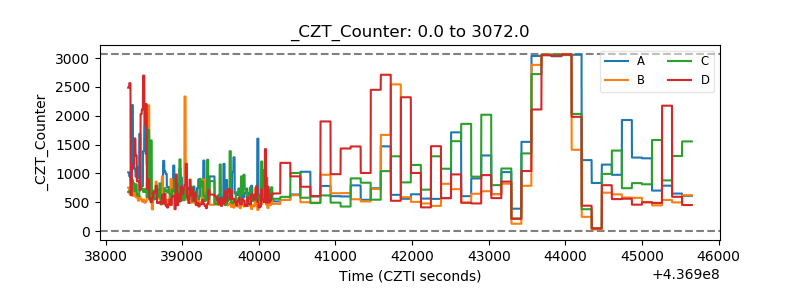 |
| +2.5 Volts monitor | 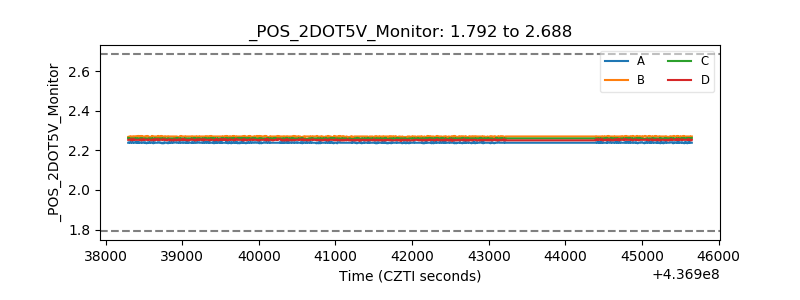 |
| +5 Volts monitor | 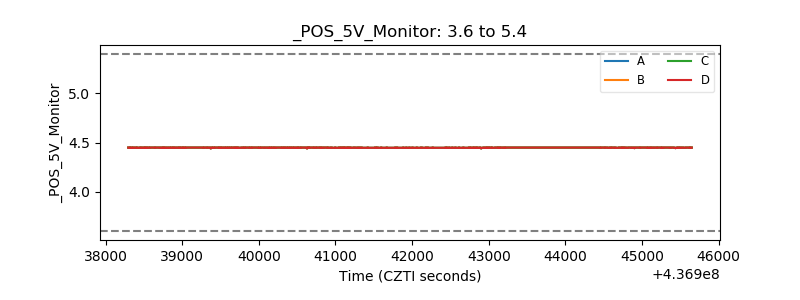 |
| _ROLL_ROT | 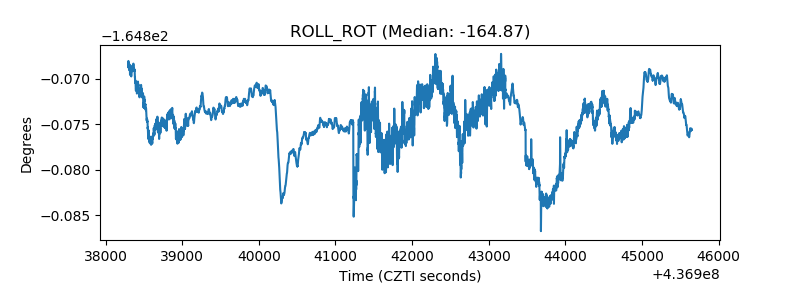 |
| _Roll_DEC | 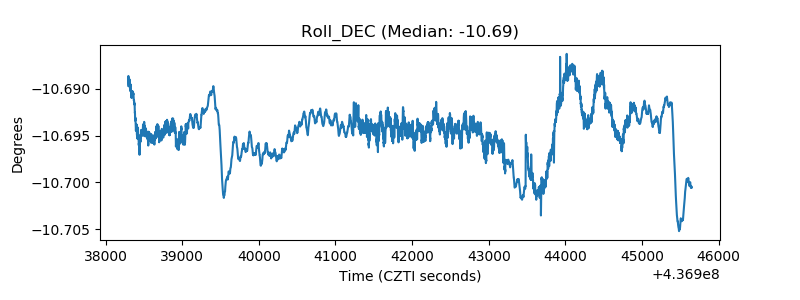 |
| _Roll_RA | 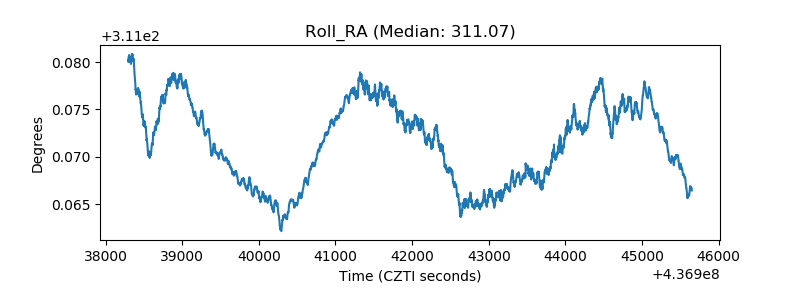 |
| Veto Counter | 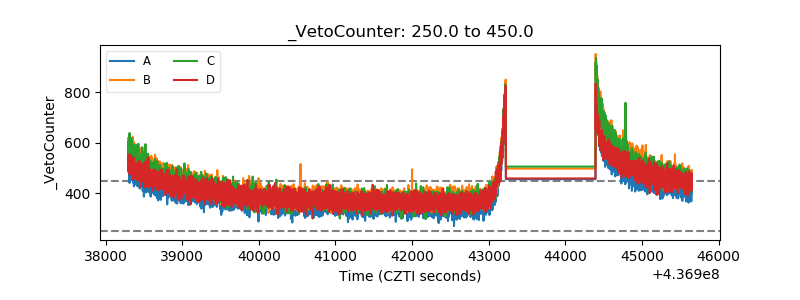 |