| Param | Original file | Final file |
|---|---|---|
| Filename | modeM0/AS1A13_018T01_9000005906_43836cztM0_level2.fits | modeM0/AS1A13_018T01_9000005906_43836cztM0_level2_quad_clean.evt |
| Size (bytes) | 733,155,840 | 105,791,040 |
| Size | 699.2 MB | 100.9 MB |
| Events in quadrant A | 6,297,954 | 700,993 |
| Events in quadrant B | 3,968,653 | 814,527 |
| Events in quadrant C | 7,464,806 | 739,693 |
| Events in quadrant D | 8,915,766 | 503,966 |
| Mode M0 | |||
|---|---|---|---|
| Quadrant | BADHDUFLAG | Total packets | Discarded packets |
| A | 0 | 23497 | 2 |
| B | 0 | 15834 | 2 |
| C | 0 | 26666 | 2 |
| D | 0 | 30761 | 2 |
| Mode SS | |||
|---|---|---|---|
| Quadrant | BADHDUFLAG | Total packets | Discarded packets |
| A | 0 | 130 | 0 |
| B | 0 | 130 | 0 |
| C | 0 | 130 | 0 |
| D | 0 | 130 | 0 |
| Mode M9 | |||
|---|---|---|---|
| Quadrant | BADHDUFLAG | Total packets | Discarded packets |
| A | 0 | 19 | 0 |
| B | 0 | 20 | 0 |
| C | 0 | 20 | 0 |
| D | 0 | 20 | 0 |
| Quadrant | Total seconds | Saturated seconds | Saturation percentage |
|---|---|---|---|
| A | 6363 | 876 | 13.767091% |
| B | 6362 | 206 | 3.237975% |
| C | 6362 | 598 | 9.399560% |
| D | 6362 | 2162 | 33.983024% |
Noise dominated data is calculated using 1-second bins in cleaned event files. If a bin has >2000 counts, and if more than 50% of those come from <1% of pixels, then it is considered to be noise-dominated and hence unusable.
| Quadrant | # 1 sec bins | Bins with >0 counts | Bins with >2000 counts | High rate bins dominated by noise | Noise dominated (total time) | Noise dominated (detector-on time) | Marked lightcurve |
|---|---|---|---|---|---|---|---|
| A | 7573 | 6363 | 618 | 618 | 8.16% | 9.71% | 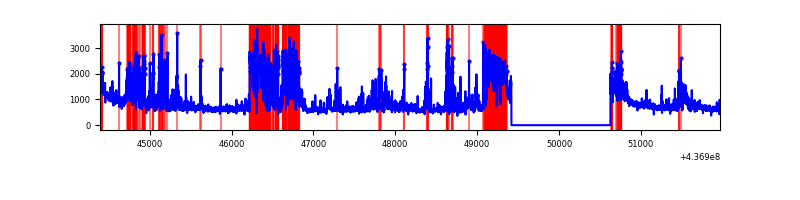 |
| B | 7572 | 6362 | 89 | 89 | 1.18% | 1.40% | 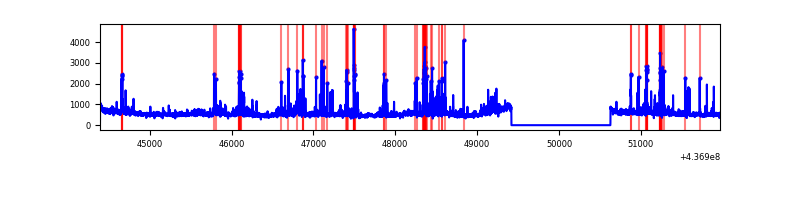 |
| C | 7572 | 6362 | 307 | 307 | 4.05% | 4.83% | 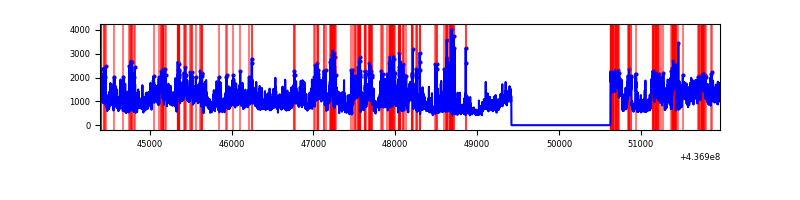 |
| D | 7572 | 6362 | 2012 | 2012 | 26.57% | 31.63% | 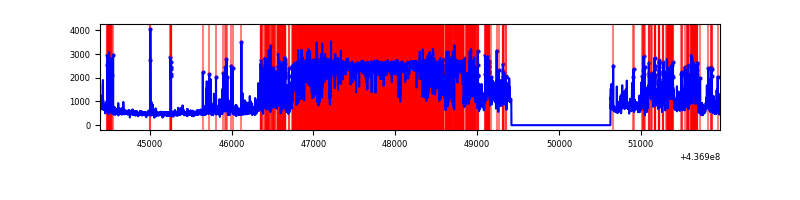 |
Top three noisy pixels from each quadrant. If the there are fewer than three noisy pixels in the level2.evt file, extra rows are filled as -1
| Pixel properties | Quadrant properties | ||||||
|---|---|---|---|---|---|---|---|
| Quadrant | DetID | PixID | Counts | Sigma | Mean | Median | Sigma |
| A | 15 | 223 | 1962133 | 12704.78 | 755 | 742 | 154.4 |
| A | 10 | 83 | 1023055 | 6621.97 | 755 | 742 | 154.4 |
| A | 13 | 248 | 263652 | 1702.98 | 755 | 742 | 154.4 |
| B | 4 | 170 | 244139 | 1589.25 | 789 | 770 | 153.1 |
| B | 5 | 235 | 198869 | 1293.63 | 789 | 770 | 153.1 |
| B | 0 | 200 | 120903 | 784.5 | 789 | 770 | 153.1 |
| C | 3 | 233 | 4370571 | 24600.18 | 758 | 763 | 177.6 |
| C | 14 | 254 | 58237 | 323.55 | 758 | 763 | 177.6 |
| C | 15 | 158 | 37735 | 208.14 | 758 | 763 | 177.6 |
| D | 12 | 33 | 3011170 | 18145.37 | 656 | 636 | 165.9 |
| D | 10 | 102 | 1635232 | 9852.19 | 656 | 636 | 165.9 |
| D | 5 | 235 | 592560 | 3567.7 | 656 | 636 | 165.9 |
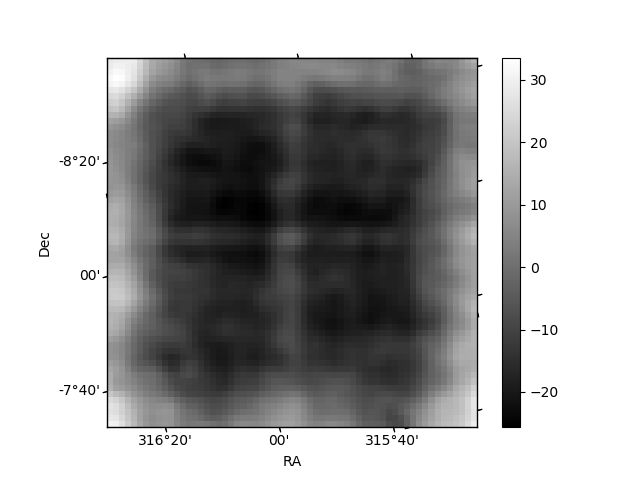
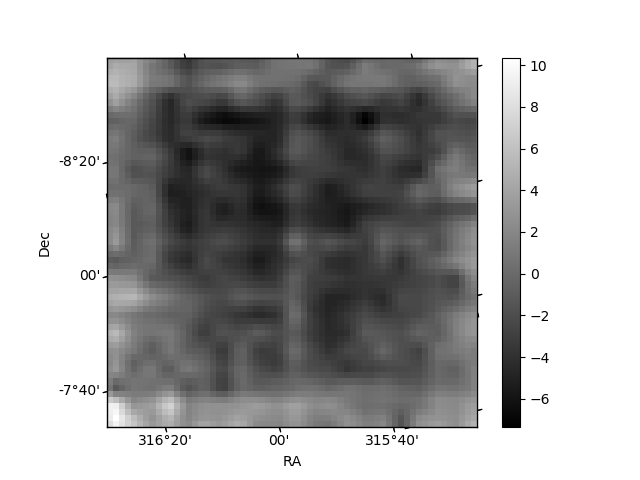
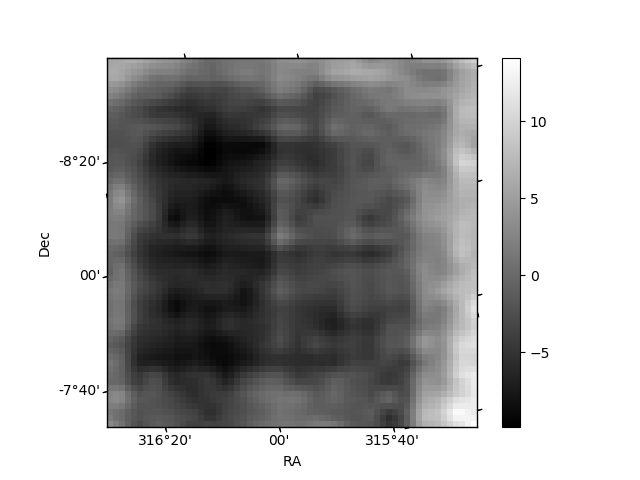
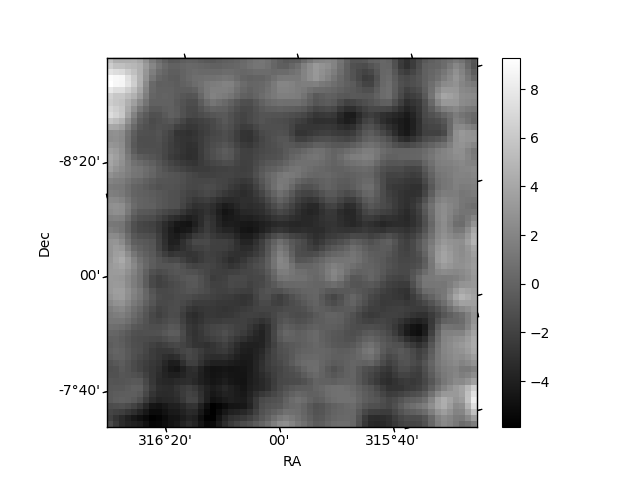
Histogram calculated using DETX and DETY for each event in the final _common_clean file
| Quadrant A | 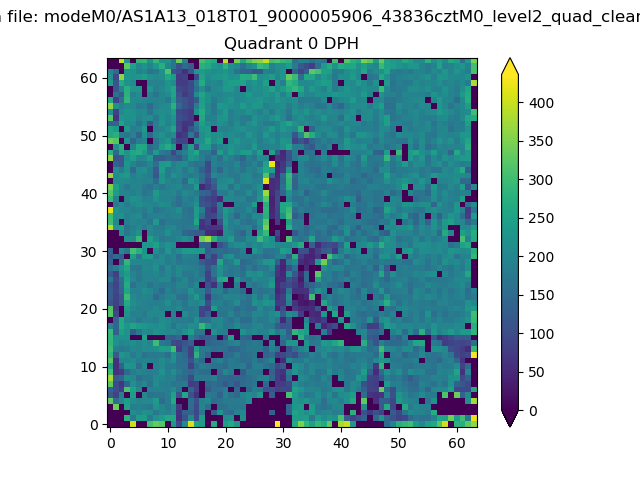 |
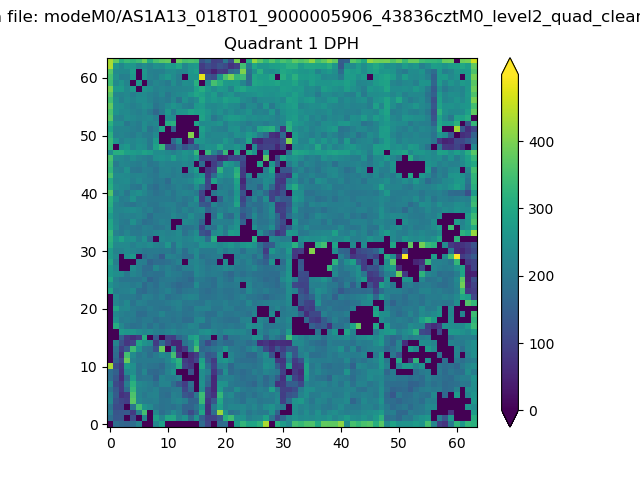 |
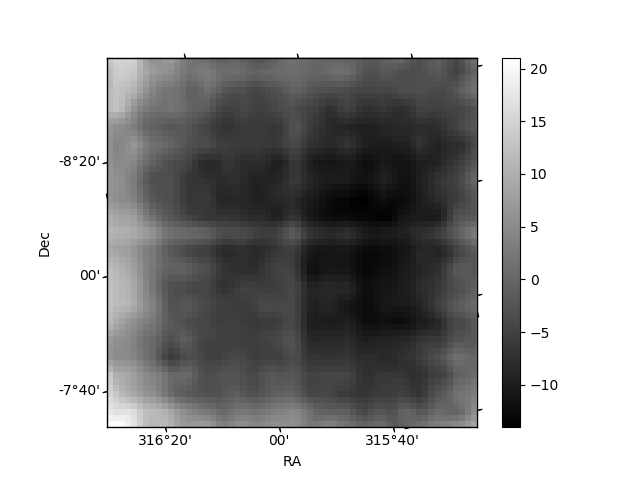
Quadrant B |
|---|---|---|---|
| Quadrant D | 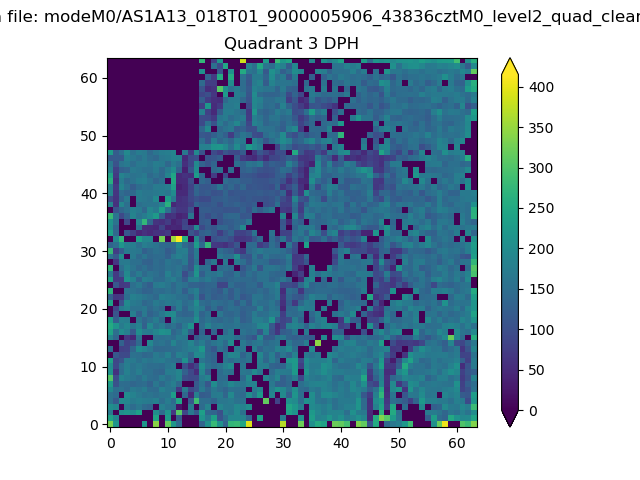 |
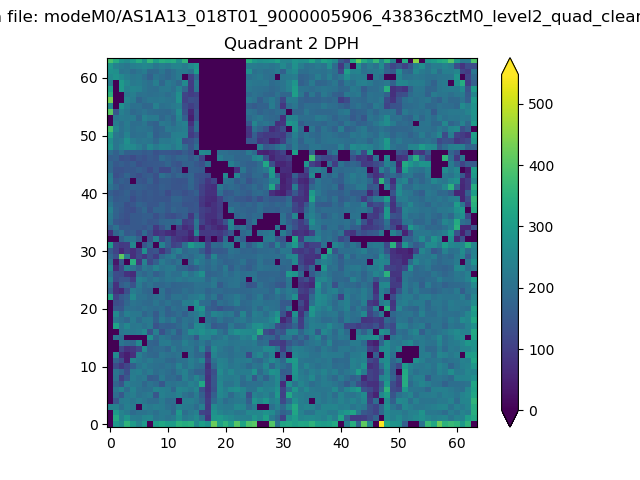 |
Quadrant C |
| Plot type | Count rate plots | Images |
|---|---|---|
| Comparison with Poisson distribution Blue bars denote a histogram of data divided into 1 sec bins. Red curve is a Poisson curve with rate = median count rate of data. |
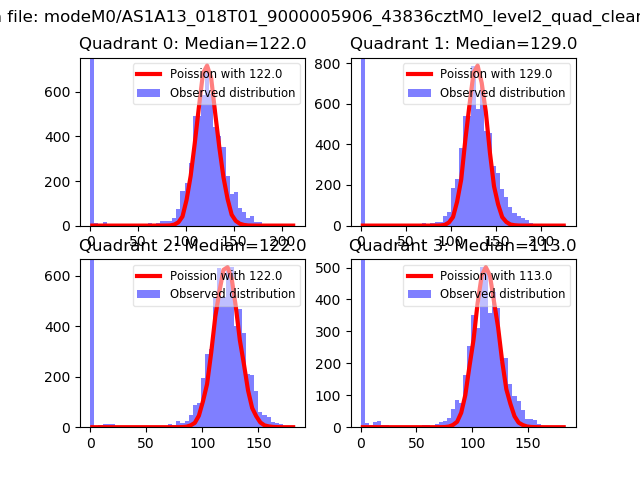 |
 |
| Quadrant-wise count rates Data is divided into 100 sec bins |
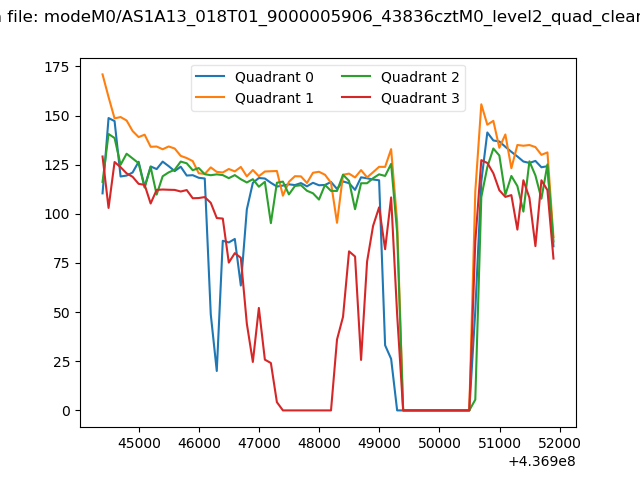 |
|
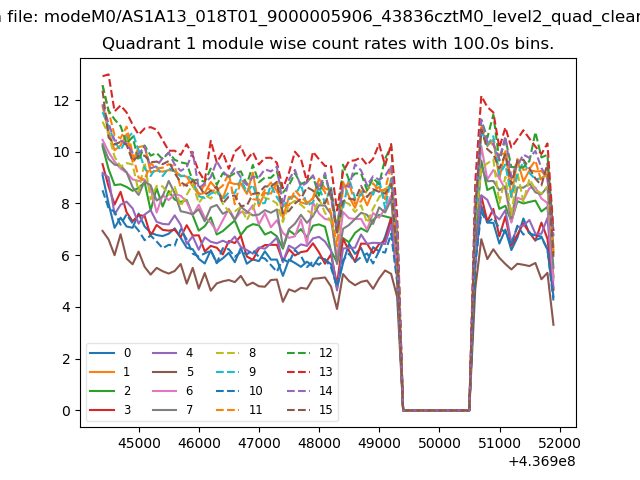
| Module-wise count rates for Quadrant A Data is divided into 100 sec bins |
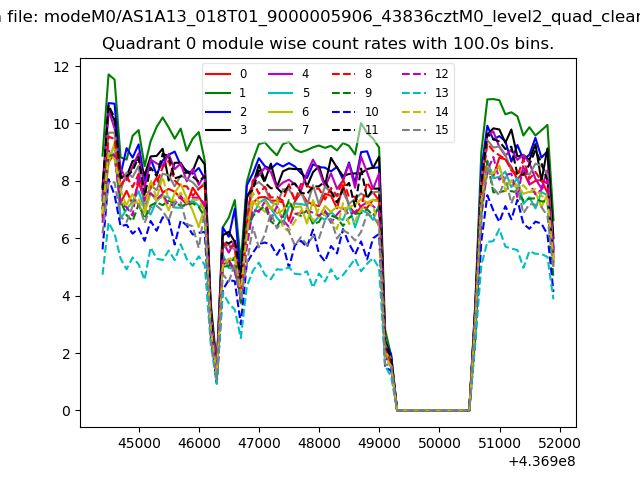 |
 |
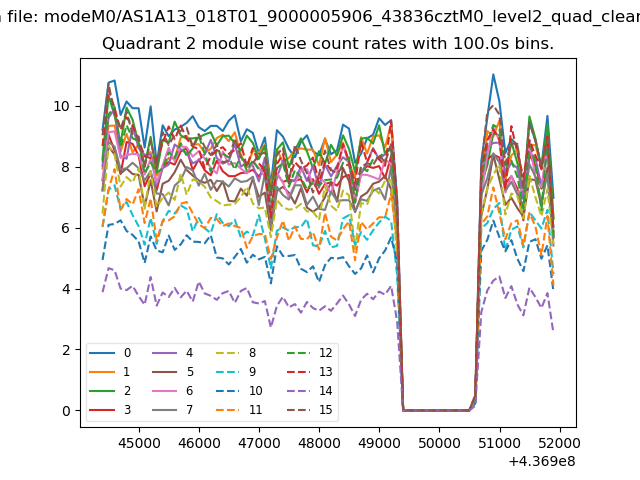
| Module-wise count rates for Quadrant B Data is divided into 100 sec bins |
 |
 |
| Module-wise count rates for Quadrant C Data is divided into 100 sec bins |
 |
 |
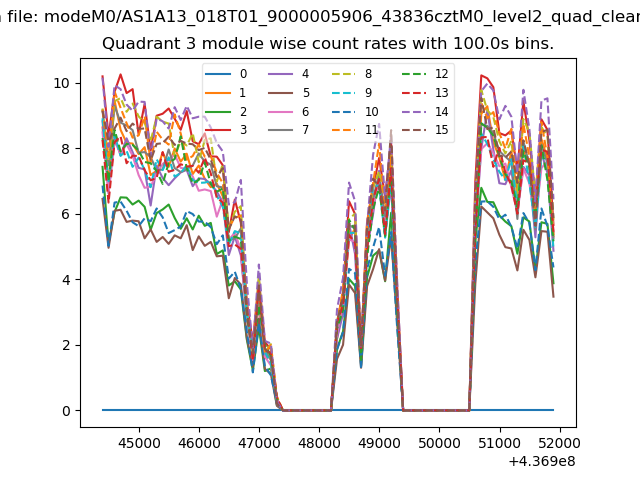
| Module-wise count rates for Quadrant D Data is divided into 100 sec bins |
 |
 |
| Parameter | Plot |
|---|---|
| CZT HV Monitor | 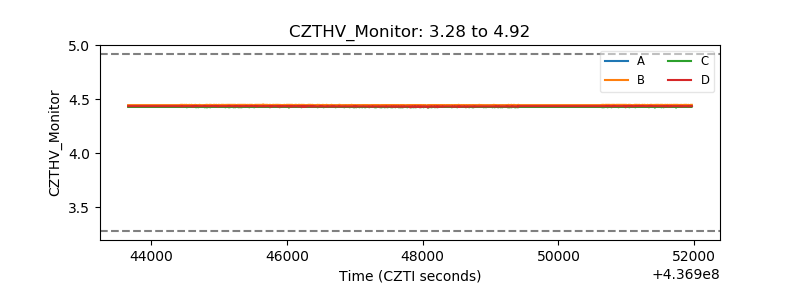 |
| D_VDD | 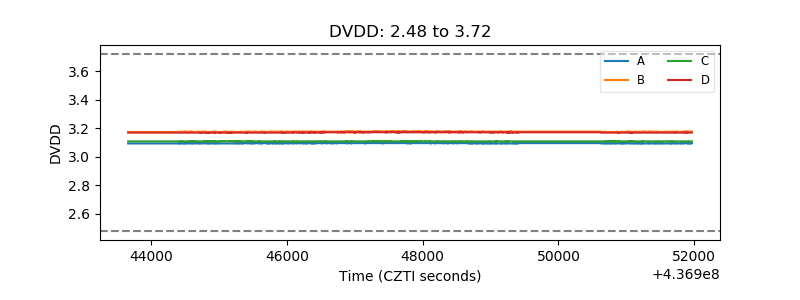 |
| Temperature 1 | 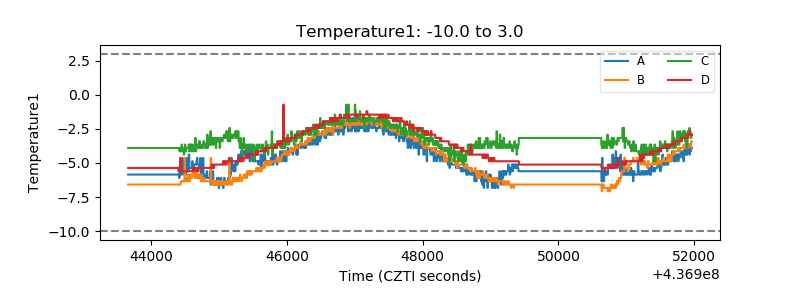 |
| Veto HV Monitor | 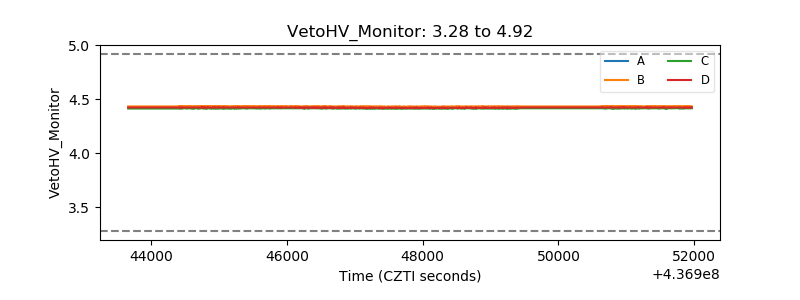 |
| Veto LLD | 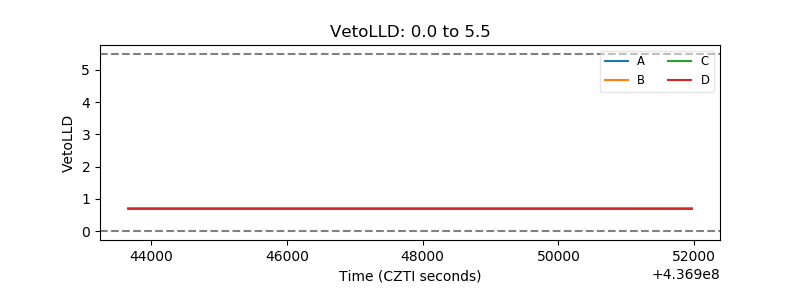 |
| Alpha Counter | 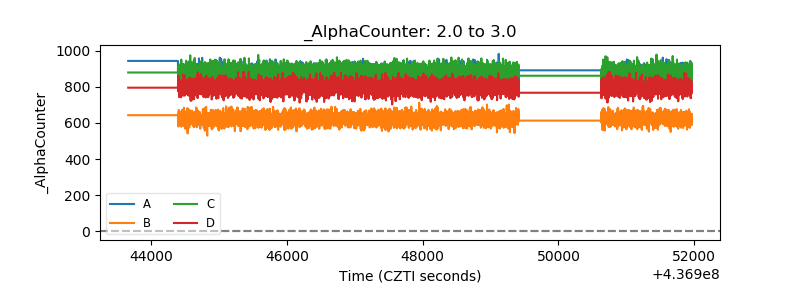 |
| _CPM_Rate | 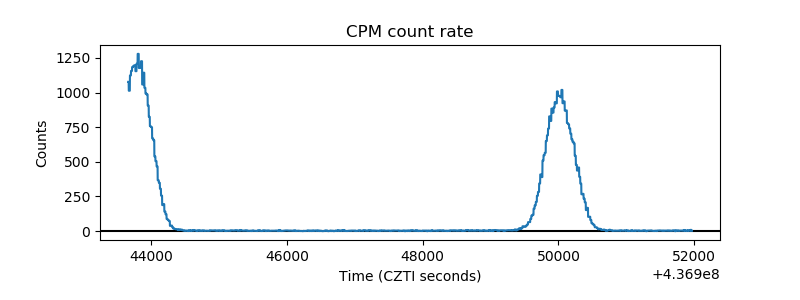 |
| CZT Counter | 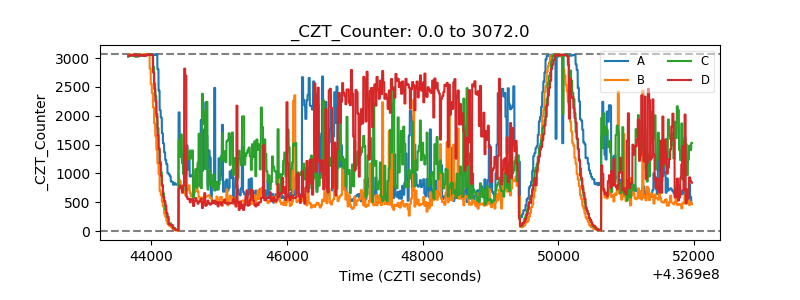 |
| +2.5 Volts monitor | 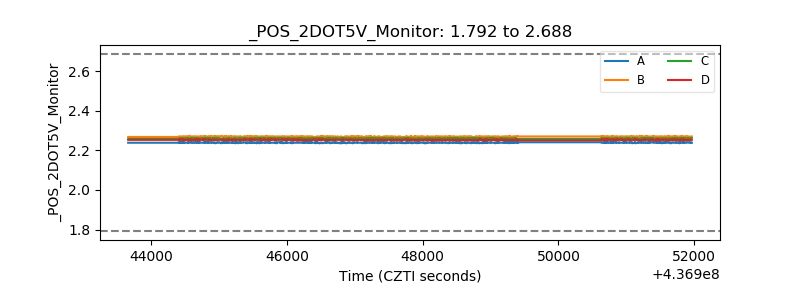 |
| +5 Volts monitor | 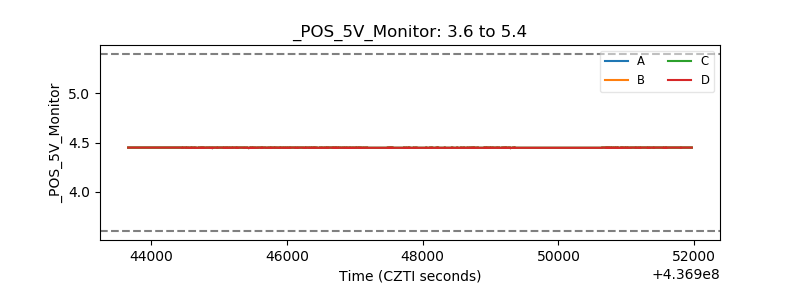 |
| _ROLL_ROT | 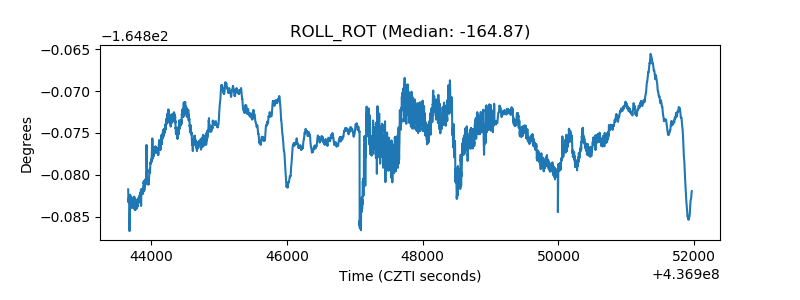 |
| _Roll_DEC | 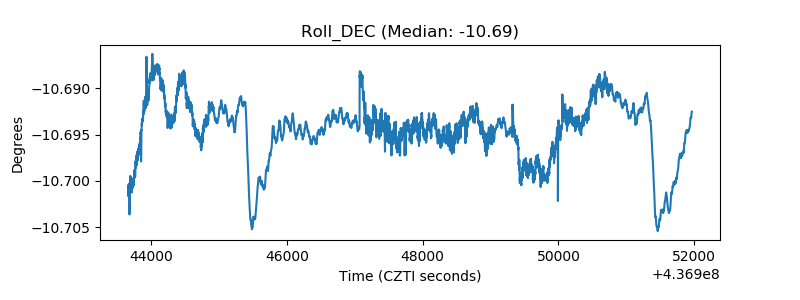 |
| _Roll_RA | 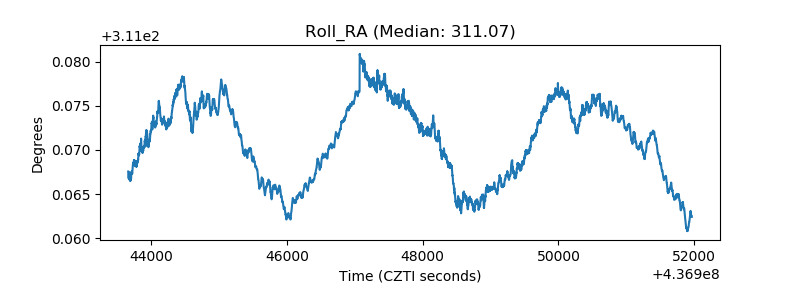 |
| Veto Counter | 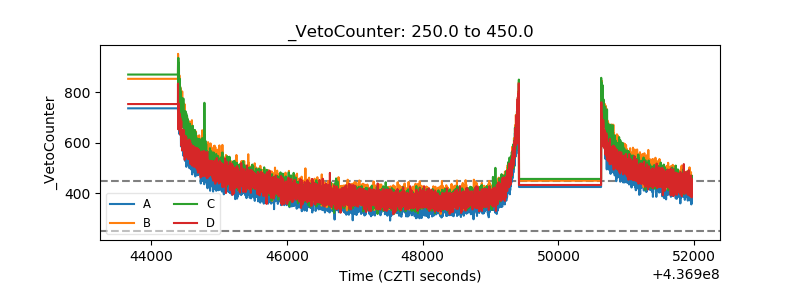 |