| Param | Original file | Final file |
|---|---|---|
| Filename | modeM0/AS1A13_018T01_9000005906_43837cztM0_level2.fits | modeM0/AS1A13_018T01_9000005906_43837cztM0_level2_quad_clean.evt |
| Size (bytes) | 688,904,640 | 109,284,480 |
| Size | 657.0 MB | 104.2 MB |
| Events in quadrant A | 5,679,194 | 745,407 |
| Events in quadrant B | 4,080,673 | 786,297 |
| Events in quadrant C | 6,853,393 | 723,570 |
| Events in quadrant D | 8,390,870 | 605,160 |
| Mode M0 | |||
|---|---|---|---|
| Quadrant | BADHDUFLAG | Total packets | Discarded packets |
| A | 0 | 21776 | 2 |
| B | 0 | 16293 | 4 |
| C | 0 | 24995 | 7 |
| D | 0 | 29452 | 1 |
| Mode SS | |||
|---|---|---|---|
| Quadrant | BADHDUFLAG | Total packets | Discarded packets |
| A | 0 | 130 | 0 |
| B | 0 | 130 | 0 |
| C | 0 | 130 | 0 |
| D | 0 | 130 | 0 |
| Mode M9 | |||
|---|---|---|---|
| Quadrant | BADHDUFLAG | Total packets | Discarded packets |
| A | 0 | 11 | 0 |
| B | 0 | 11 | 0 |
| C | 0 | 11 | 0 |
| D | 0 | 11 | 0 |
| Quadrant | Total seconds | Saturated seconds | Saturation percentage |
|---|---|---|---|
| A | 6432 | 501 | 7.789179% |
| B | 6431 | 331 | 5.146944% |
| C | 6431 | 655 | 10.185041% |
| D | 6433 | 1276 | 19.835225% |
Noise dominated data is calculated using 1-second bins in cleaned event files. If a bin has >2000 counts, and if more than 50% of those come from <1% of pixels, then it is considered to be noise-dominated and hence unusable.
| Quadrant | # 1 sec bins | Bins with >0 counts | Bins with >2000 counts | High rate bins dominated by noise | Noise dominated (total time) | Noise dominated (detector-on time) | Marked lightcurve |
|---|---|---|---|---|---|---|---|
| A | 7557 | 6432 | 283 | 283 | 3.74% | 4.40% | 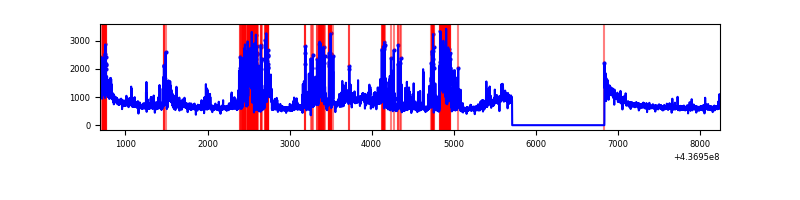 |
| B | 7558 | 6432 | 136 | 136 | 1.80% | 2.11% | 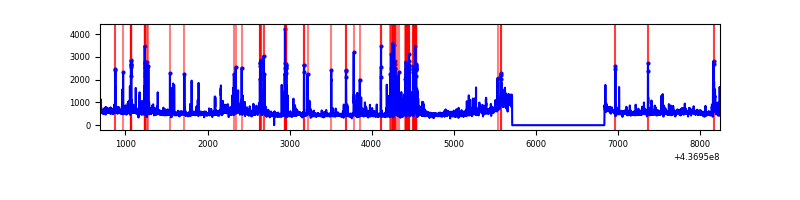 |
| C | 7558 | 6432 | 300 | 300 | 3.97% | 4.66% |  |
| D | 7557 | 6432 | 1202 | 1202 | 15.91% | 18.69% | 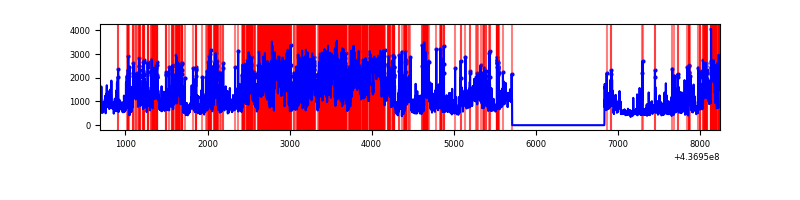 |
Top three noisy pixels from each quadrant. If the there are fewer than three noisy pixels in the level2.evt file, extra rows are filled as -1
| Pixel properties | Quadrant properties | ||||||
|---|---|---|---|---|---|---|---|
| Quadrant | DetID | PixID | Counts | Sigma | Mean | Median | Sigma |
| A | 15 | 223 | 1459784 | 9027.94 | 783 | 769 | 161.6 |
| A | 10 | 83 | 1007260 | 6227.86 | 783 | 769 | 161.6 |
| A | 13 | 248 | 139304 | 857.21 | 783 | 769 | 161.6 |
| B | 4 | 170 | 385567 | 2527.29 | 779 | 757 | 152.3 |
| B | 0 | 200 | 189199 | 1237.62 | 779 | 757 | 152.3 |
| B | 5 | 235 | 175405 | 1147.02 | 779 | 757 | 152.3 |
| C | 3 | 233 | 3735163 | 21174.69 | 753 | 757 | 176.4 |
| C | 14 | 96 | 70666 | 396.4 | 753 | 757 | 176.4 |
| C | 15 | 158 | 44883 | 250.2 | 753 | 757 | 176.4 |
| D | 12 | 33 | 2683507 | 14445.61 | 736 | 714 | 185.7 |
| D | 10 | 102 | 1078898 | 5805.52 | 736 | 714 | 185.7 |
| D | 1 | 52 | 422561 | 2271.45 | 736 | 714 | 185.7 |
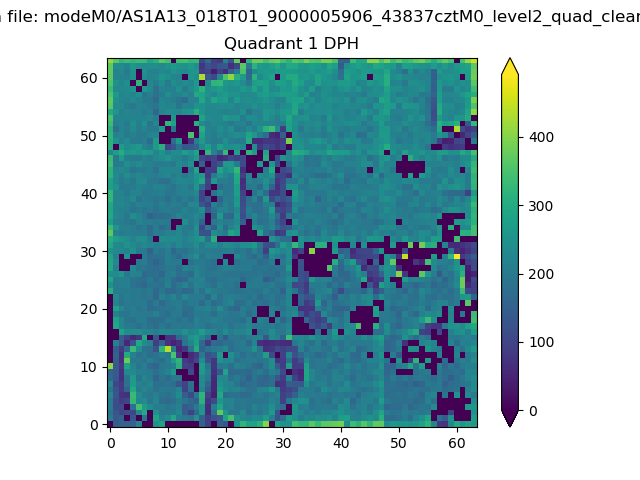
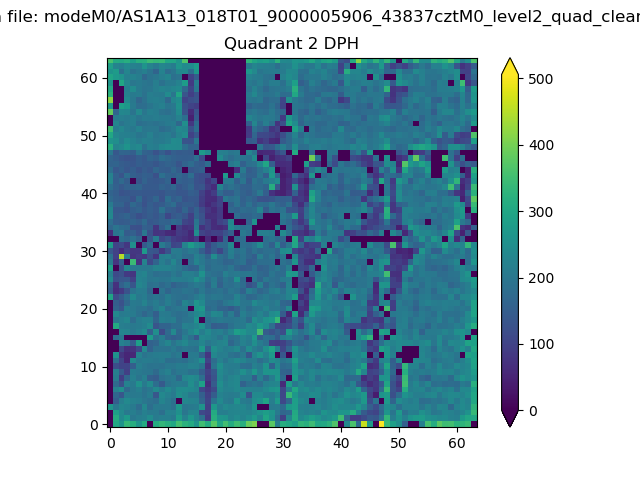
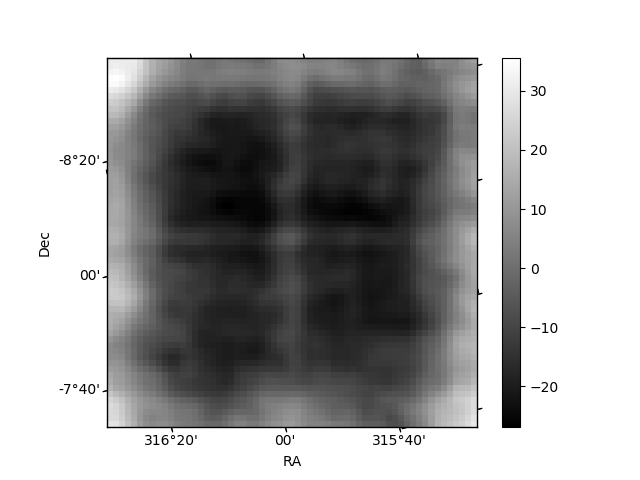
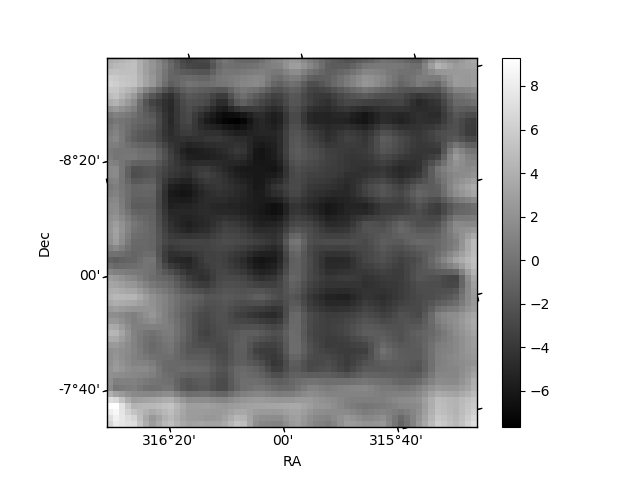
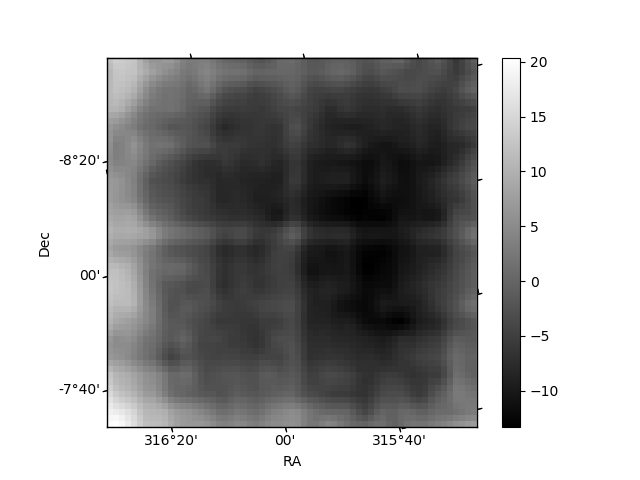
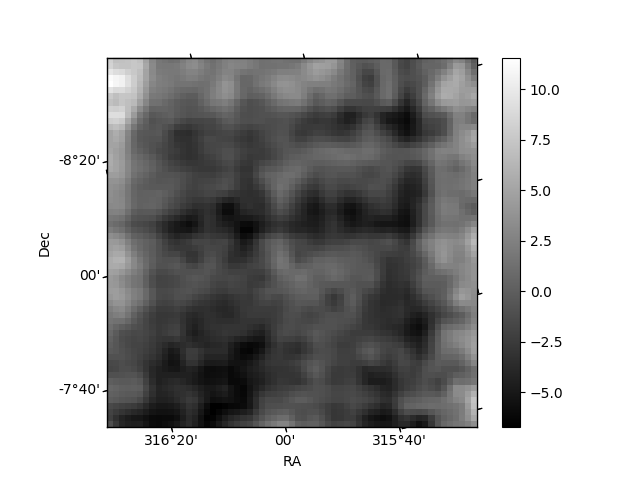
Histogram calculated using DETX and DETY for each event in the final _common_clean file
| Quadrant A | 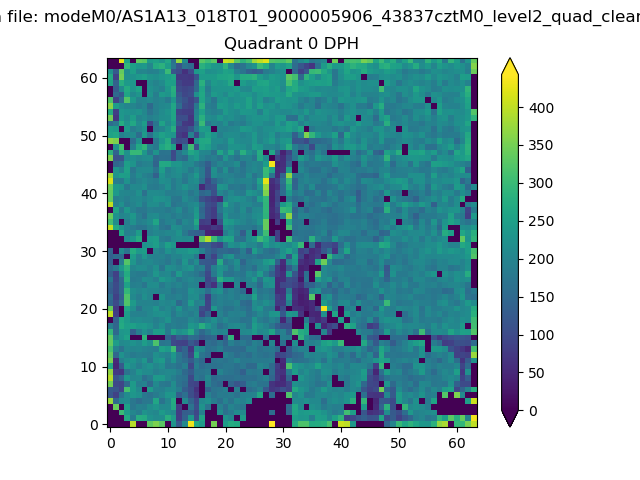 |
 |
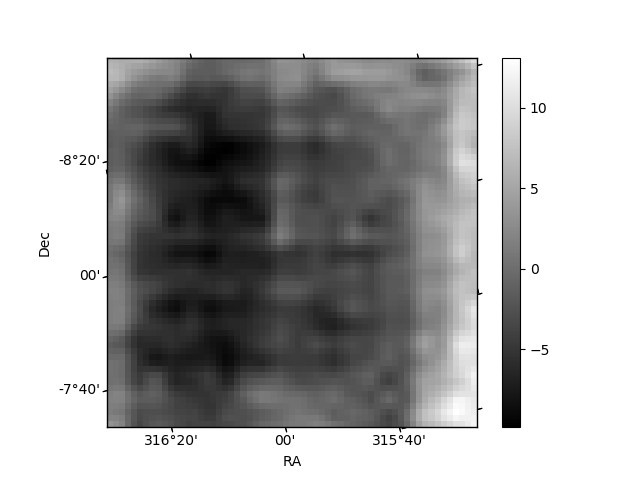
Quadrant B |
|---|---|---|---|
| Quadrant D | 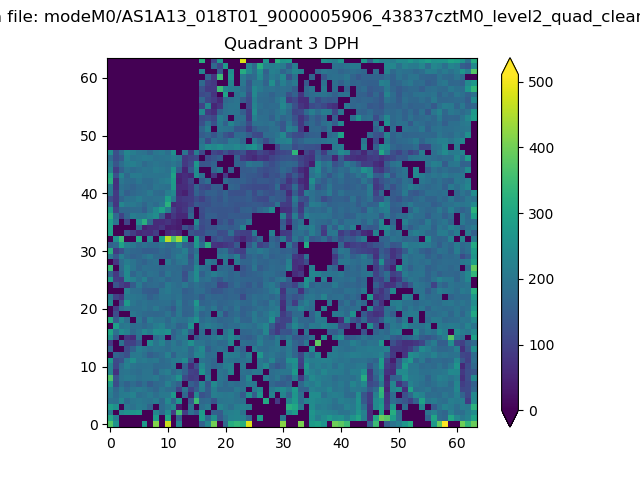 |
 |
Quadrant C |
| Plot type | Count rate plots | Images |
|---|---|---|
| Comparison with Poisson distribution Blue bars denote a histogram of data divided into 1 sec bins. Red curve is a Poisson curve with rate = median count rate of data. |
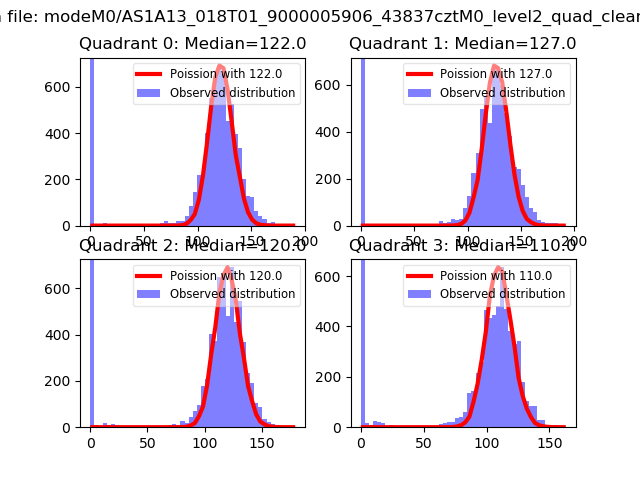 |
 |
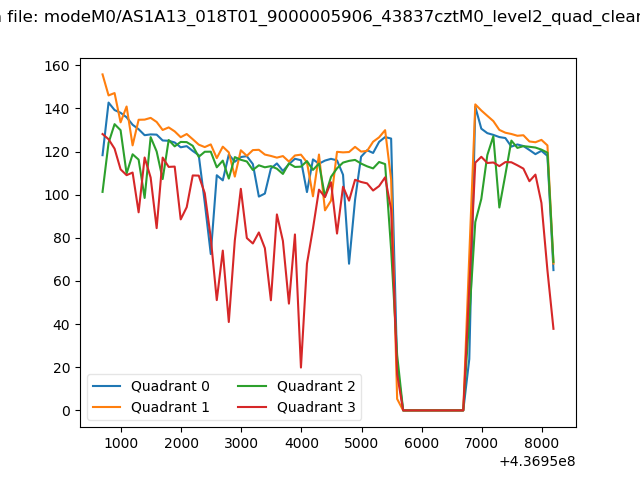
| Quadrant-wise count rates Data is divided into 100 sec bins |
 |
|
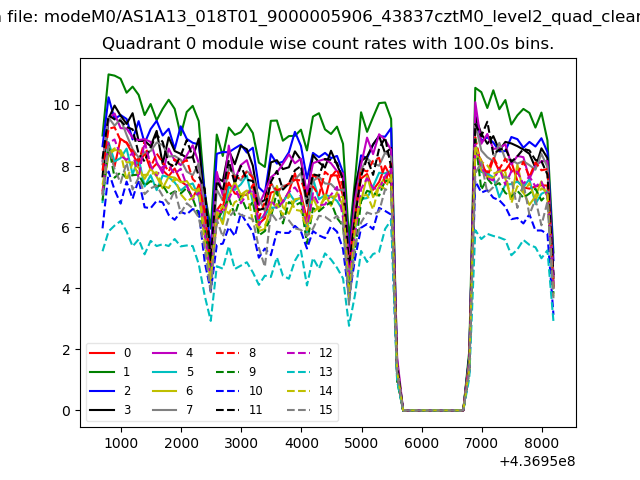
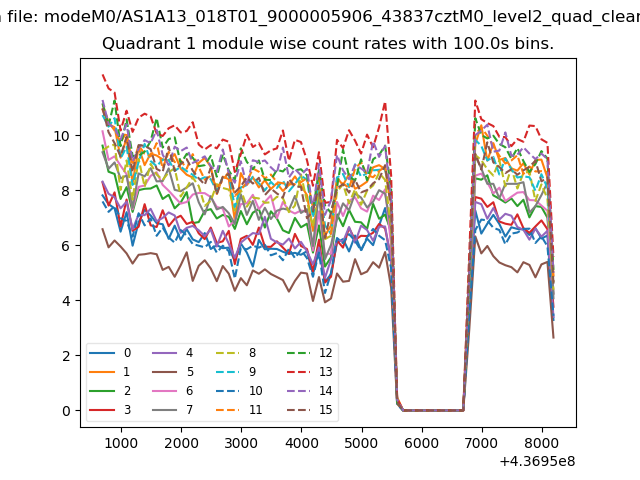
| Module-wise count rates for Quadrant A Data is divided into 100 sec bins |
 |
 |
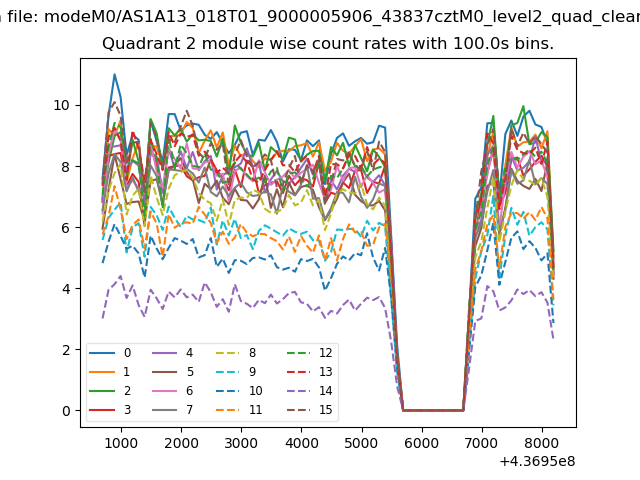
| Module-wise count rates for Quadrant B Data is divided into 100 sec bins |
 |
 |
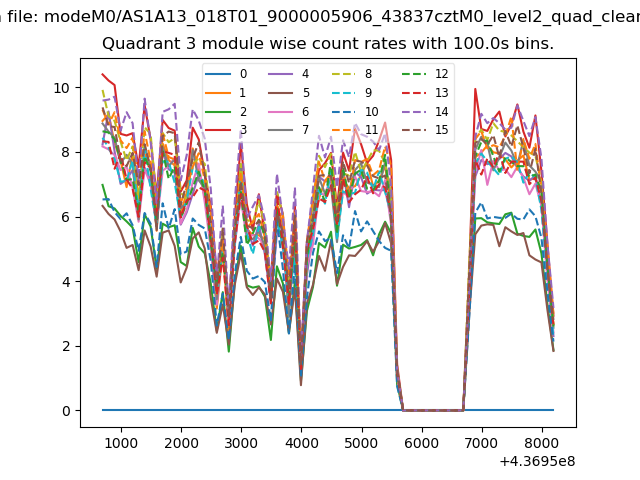
| Module-wise count rates for Quadrant C Data is divided into 100 sec bins |
 |
 |
| Module-wise count rates for Quadrant D Data is divided into 100 sec bins |
 |
 |
| Parameter | Plot |
|---|---|
| CZT HV Monitor | 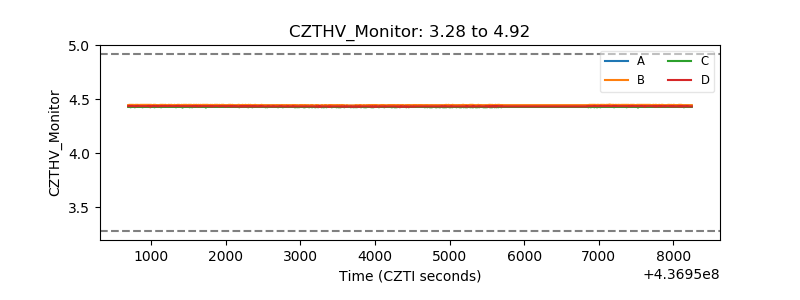 |
| D_VDD | 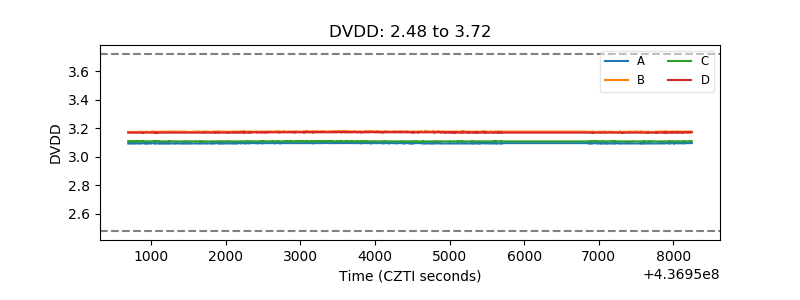 |
| Temperature 1 | 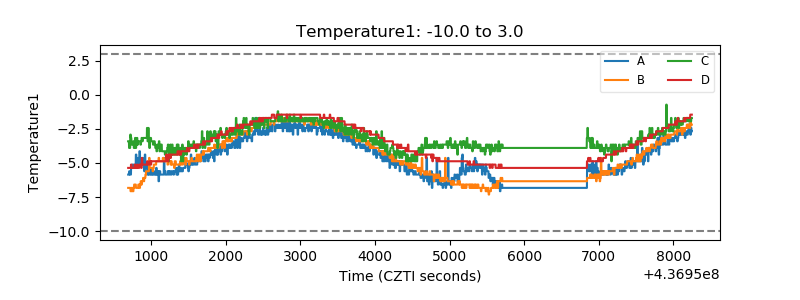 |
| Veto HV Monitor |  |
| Veto LLD | 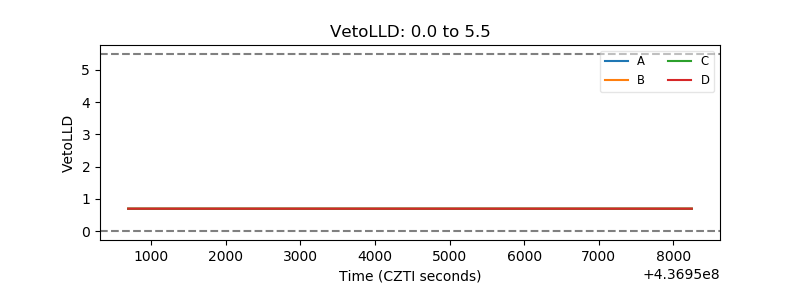 |
| Alpha Counter | 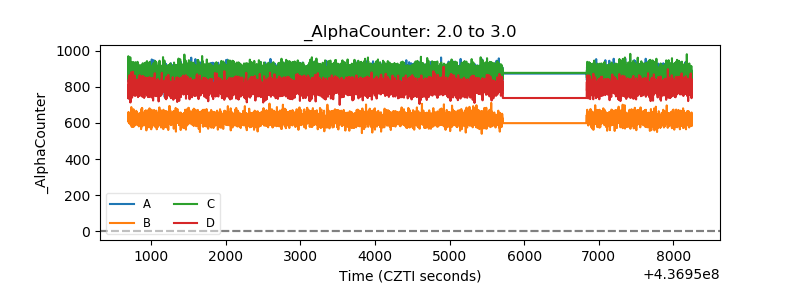 |
| _CPM_Rate | 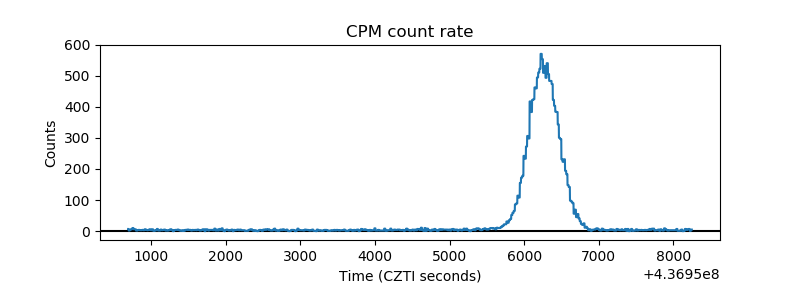 |
| CZT Counter | 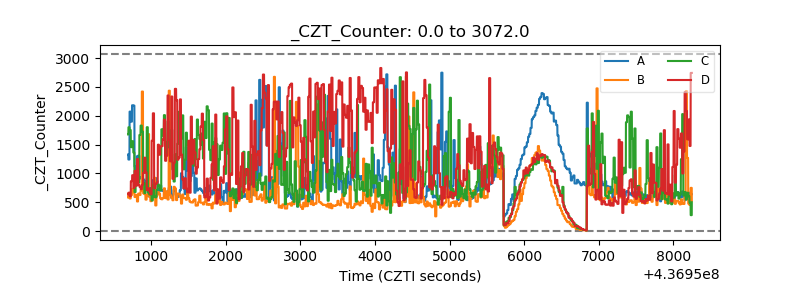 |
| +2.5 Volts monitor | 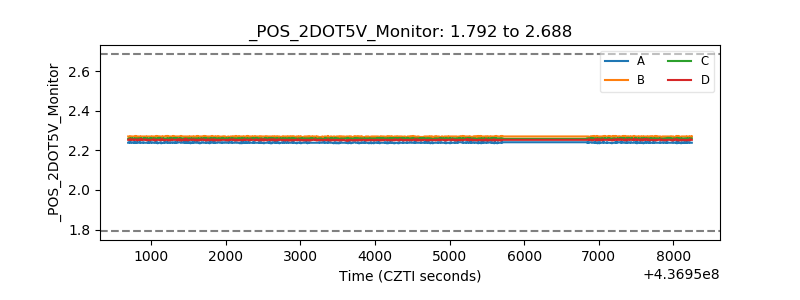 |
| +5 Volts monitor | 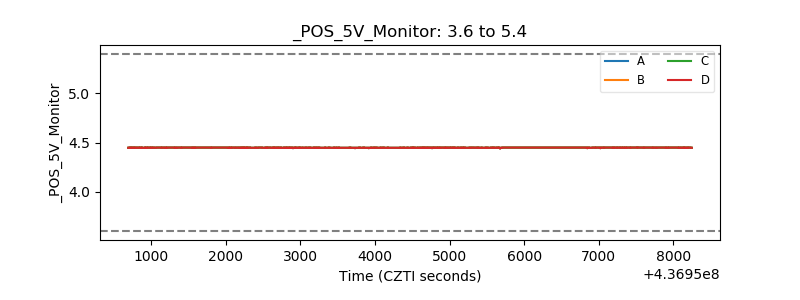 |
| _ROLL_ROT | 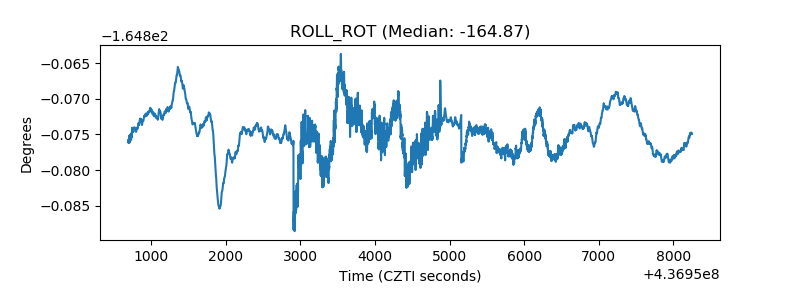 |
| _Roll_DEC | 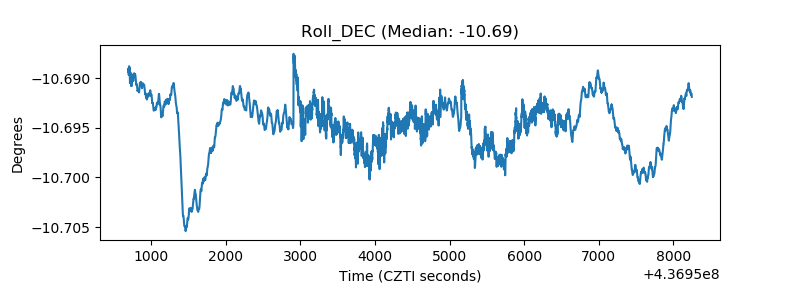 |
| _Roll_RA | 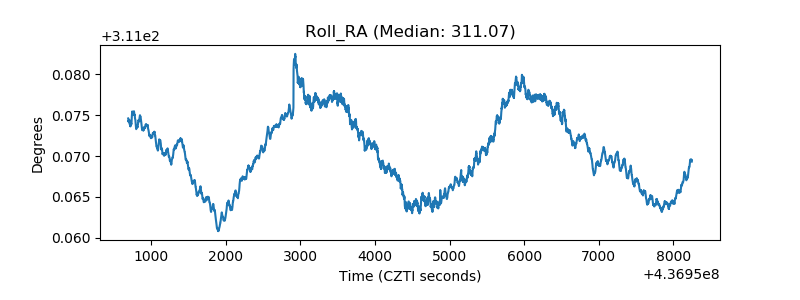 |
| Veto Counter | 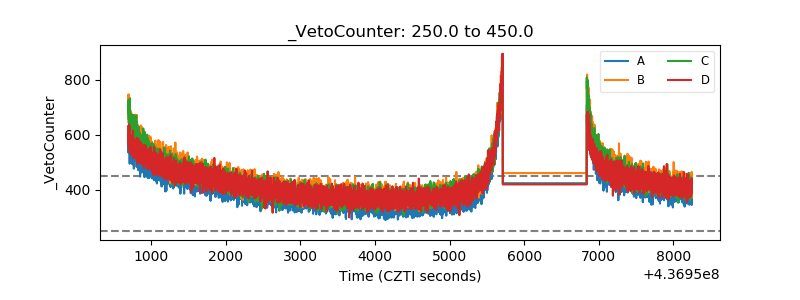 |